PROCESS INTENSIFICATION A usual approach in water treatment for the chemical industry
|
|
|
- Kevin Wiggins
- 5 years ago
- Views:
Transcription


1 PROCESS INTENSIFICATION A usual approach in water treatment for the chemical industry Sylvie BAIG Head of Scientific Innovation Treatment Solutions Agnès PILAS-BEGUE Head of Global Environmental R&I Network
2 Process intensification A usual approach in water treatment for the chemical industry 1. Integrated Water management Introduction & drivers 2. Water treatment Processes Intensification 2-1. Primary treatment 2-2. Biological processes 2-3. Tertiary treatment using chemical oxidation 2-4. Water Reuse& Recycling 3. Challenges & Perspectives 2
3 1. Introduction & Drivers 3


4 Water stress Water Stress Index Ratio of withdrawals to supply +80% is the forecasted growth in industrial water consumption by 2030 Who uses freshwater Domestic Industrial Agricultural Nonconsumptive Consumptive World HIC L,M-IC > 80% 40-80% 20-40% 10-20% < 10% 0% 10% 20% 30% 40% 50% 60% 70% 80% 90% 100% 4


5 Water Food EnergyNexus Increasing demands with population growth to 9.6 bn by 2050 L m 3 /GJ Agri-food supply chain: the largest consumer of water resources, approximately 70% of all freshwater use. Energyproduction: 44% of water abstraction in Europe 5


6 Genericdrivers along the industry water cycle Reliability of water management Process failure issues Sustainabilityand regulatory constraints Regulationson effluent quality Green image Access to Water Withdrawal limits Competition beween agriculture, industry and domestic uses Operating costs reduction Rationalization of investments 6


7 Integrated watermanagement Raw materials Resources Eco-industrial approach Barriers and incentives Energy Water Reduce Reuse Recycle Technologies Policies & Regulations Economics Products By-products, Waste Risks Environment Human health Production 7
8 2. Intensification in Water Treatment 8


9 More and more stringent regulations have a huge impact on the cost of effluent treatment. Process intensification is a permanent challenge to reduce costs It will support Water Recycle & Circular Economy Development Suspended solids Nitrogen, Phosphorus Organics Refractory Organics, Micropollutants 2020 s Water recycling Primary treatment Neutralization Sedimentation N removal (Denitrification) Biological treatment Clarifier Sludge dewatering Disposal Incineration, Landfilling Tertiary treatment SS, Refractory COD Salts removal s : Zero Liquid Discharge Waste valorization & Circular Economy 9
10 Water treatmentprocesses: needto beadaptedto wastewaterswithvariable qualities& flowratesup to thousandsm 3 /h Pollutants Organics Potential processes Oxidation Biological Chemical Thermal Wastesto be valorized or removed Refractory Organics, CO 2, Sludge Minerals Concentration processes Precipitation Separation(Sedimentation, Floatation, Membranes ) Ion exchange Adsorption Concentrates, Brines, Sludges Recovery? Recycle? 10
, Suspended Solids (SS) Chemical Process 4.")


11 Usual WWTP Process intensification is a permanent challenge to reduce costs Influent Organics(COD), Suspended Solids (SS) Chemical Process 4. Water Recycle 1. Primary treatment Precipitation Neutralization Sedimentation COD SS, metals 2. Biological Treatment Separation SS, COD Sludge dewatering 3. Tertiary treatment : SS, Micropollutants, salts Treated effluent Valorization or Discharge Incineration, landfill, landfarming 11
12 Intensification of Water TreatmentProcesses An on going approach Reduction in size of unit operation Simplification of processes by combining some steps Significant lower capital and running costs Improved performances Improved reliability and productivity Improved sustainability New processes and technologies involving materials, catalysts, reagents with higher performances 12
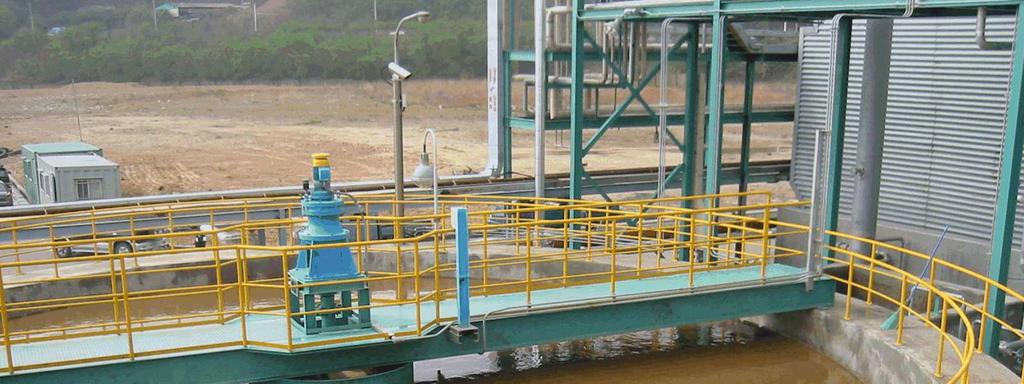
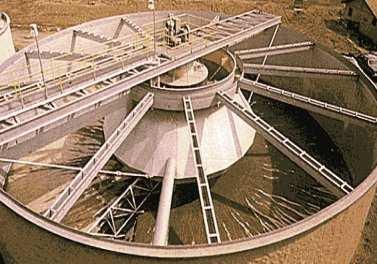
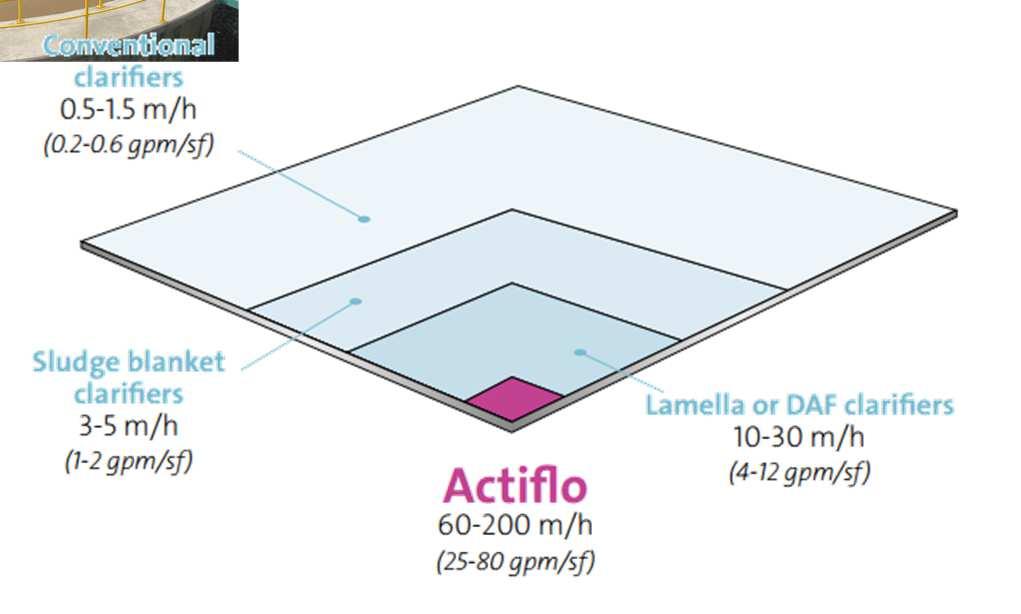
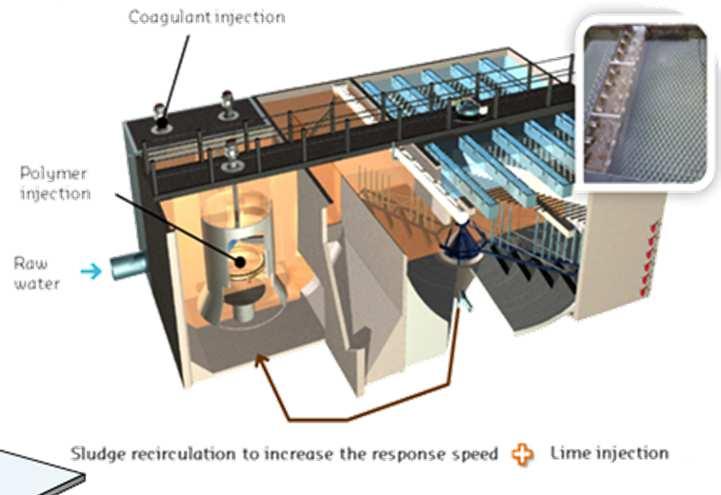
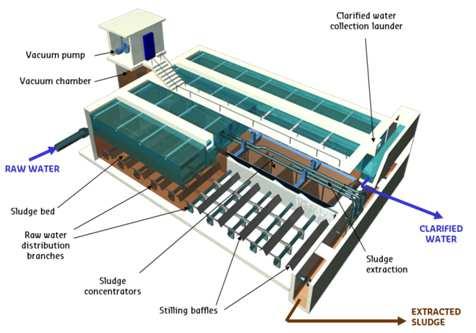
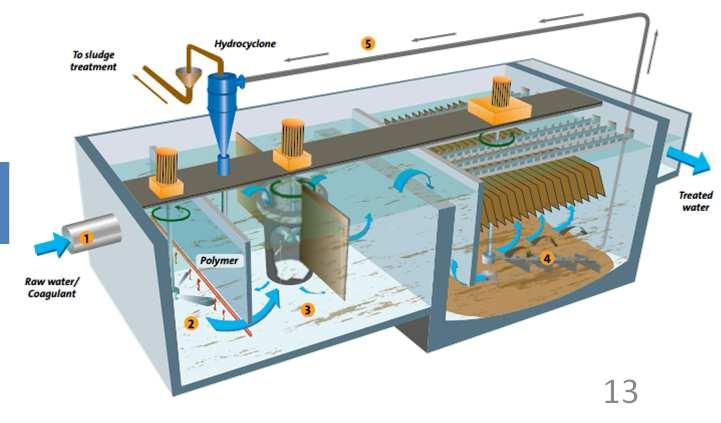
13 2.1. PrimarySuspendedSolidsseparation From conventional to ballasted settling 1. Conventional clarifiers m/h 2. Sludge blanket clarifiers 3 5 m/h 3. Lamella clarifiers 4. Ballasted m/h clarifiers m/h Intensification X


14 2.2. Biological processes intensification From m 3 (0,5 g SS/l) to 1000 m 3?? 14
")
 & Concentration")
15 2-2. Biologicaltreatmentof organics Potential intensification factors Conventional Activated Sludge Process CouplingwithAdsorption (Activated Carbon ) Wastewater Settler Bioréactor Air Treated effluent Aeration using Air, O 2 Mass transfer Sludge recycling Biomass Type (specific micro-organisms) & Concentration Separation 15

16 Aerobic Biological process intensification Achievements enabling a 2-3 fold intensification rate Wastewater MEMBRANES IMMERGEES < 5000 m3/j - DCO > 2000 mg/l Settler Bioréactor Air Sludge recycling Treated effluent Addition of packed material in aerator Modules à fibres creuses Dépression : 0,5 B Vitesse de filtration : l/m².h Balayage : air Activated Sludge Moving Bed Bioreactor Membrane Bioreactor Free Biomass Separationby sedimentation Free +Fixedbiomass: Packing material addition Separationby sedimentation Free Biomass Ultrafiltration separation (Membranes) (Biomass): 3-5 g/l 3-5 g/l + fixedbiomass 10 g/l Intensification x 2 X
 Free Biomass Mixed free / fixed biomass Granular Biomass (Biomass): 3-5 g/l 3-5 g/l + fixedbiomass 30 g/l Intensification x 2 x 6-10 COD")
17 Anaerobic Biological process intensification Achievements enabling a 2-3 fold intensification rate Décanteur Digesteur TSH ~ 30 j Matériau filtrant Biomasse fixée Biomasse libre Free Biomass Hybrid Anaerobic reactor Upflow Anaerobic Sludge Blanket(UASB) Free Biomass Mixed free / fixed biomass Granular Biomass (Biomass): 3-5 g/l 3-5 g/l + fixedbiomass 30 g/l Intensification x 2 x 6-10 COD removal: 70-80% 80 90% 90% 17

18 2-3. Tertiarytreatment Chemical oxidation for micropollutants and refractory COD Ox O 2 H 2 O 2 O 3 HO E (V) 1,23 1,77 2,07 2,80 Chemical Photochemical Catalytic Concentration decay Obj. 1 Wet Oxidation Kinetic advantage Possible dose saving Usual oxidation Advanced oxidation process Usual oxidation Usual oxidation vs AOP AOP Intensification X 2-10 O3 O 3 /H 2 O 2 Primary treatment O 3 /H 2 O 2 /UV O 3 /UV H 2 O 2 /UV Secondary treatment (biological) H 2 O 2 /Fe II /UV TiO 2 /UV O 3 /catalyst H 2 O 2 /Fe II Advanced treatment Obj. 2 Performance benefit time 18
19 2-4. Water reuseand recycling Low to zero liquid discharge and chemical recovery Development of closed loop recycling and reuse Extended WWTP Specificstreamtreatmentat source In-plant usage control Site synergy Advanced treatment technologies for «fit for use» quality Salt control uponconcentration technologies OUR SOLUTION OUR SOLUTION No reuse Low Liquid Discharge Zero liquide discharge Intensification X 2 X 10 19


20 ZLD and Chemical Recovery Ultimatecuttingedgetreatmentfor intensification by 20 Reduction of liquid wasteinto the environment Production of process water of appropriate quality Reduction of water consumption for the supply Optimization of energy consumption Compliance with environmental standards Recovery of salts and minerals CONDENSATE CONDENSATE Nickel processing Pre-treatment Preconcentration EV1 Evaporation / Crystallization stage 2 FEED - Na, Cl, SO4 - Borax Na2SO4 98.5% CONDENSATE CONDENSATE CONDENSATE Evaporation / Crystallization stage 3 Evaporation / Crystallization stage 4 OUR SOLUTION Evaporation / Crystallizatio n stage 5 NaCl / Na2SO4 Na2SO4 98.5% NaCl 97.5% Purge < 3% 20
21 3. Challenges and perspectives 21
22 Technologyneeds Next process intensification field Area Technology need Major drivers Biologicaltreatment Reliable and extended treatment regarding influents with complex matrix with toxic constituents and «high salinity/conductivity» Anaerobic treatment with energy recovery Membrane Salt removal Persistent organics treatment Brine treatment Low scaling membrane treatment Membranes with modified surface to limit scaling and fouling Ceramic membranes with catalytic properties Increase of membranes capacity by nanotechnologies Low energy desalination Membrane processes for high load effluent Combined membrane processes for energy savings Salt separative treatment integrated in industrial re-use strategy in order to limit corrosion and scaling Cost effective oxidative treatments with control of by-products Catalytic combined processes for adsorption and/or oxidation Green biocide for biofouling control Energy saving membrane concentrate treatment Energy saving distillation processes Low fouling selective membrane for electrodialysis treatment Evaporation / Crystallization processes with by-product control Regulations Technology Cost Technology Technology Cost Cost Cost Cost Business Regulations Cost 22
23 Technologyneeds Next process intensification field Area Technology need Major drivers By-product valorization Selective separation of valuable inorganics(e.g. metals) Selective separation of concentrated organic compounds Functionalized membrane Highly selective adsorbent easy to regenerate Cost Cost Technology Business Engineered systems Low energy gas/water/sludge handling Cost Tools Reliable on line sensors and bio sensors Monitoring of processes Smart Plants Cost 23
24 Thank you for your attention