GHG Emission Quantification & Targeting Tool for urban transport
|
|
|
- Janel Little
- 5 years ago
- Views:
Transcription


1 GHG Emission Quantification & Targeting Tool for urban transport COP24 Transport Day Markus Delfs / Marie Jamet Supported by : Implemented by:

2 Global Status Report Comprehensive overview about the Partnership s objectives, structure, and activities Aggregated impact monitoring towards international agendas (NUA, UNFCCC) across all support-programs 5 core impact indicators 4 investment indicators Visibility & coherent reporting about Contributors and Beneficiaries activities Download your copy:
3 Agenda of today ❶ Presentation ifeu ❷ Transport bottom-up GHG emission what for? ❸ The methodology of the MobiliseYouCity tool ❹ ❺ Monitoring and KPIs Next steps
4 ifeu - Institut für Energie- und Umweltforschung Heidelberg History: Funded in 1978 as an independent private and non-profit research institute in the field of the environment. About 80 scientists work in interdisciplinary teams in 2 offices in Heidelberg and Berlin on the following areas of expertise : Energy Transportation Industry and Products Food and biomass Protection of resources and waste Expertise in national and local transport climate inventory : TREMOD (TRansport Emission MODel) calculates GHG and pollution emissions for the Federal Environment Agency TrIGGER (Transport Inventory of GHG emissions reporting) excel tool, calculates GHG emissions for all transport sectors (road, rail, maritime and aviation) for developing countries Co-development of the GHG transport emission methodology within the "Climate Protection Planner (Klimaschutzplanner)" to enable German cities to carry out harmonised inventories Inventories for many German cities e. g. Frankfurt, Bremen...
5 Agenda of today ❶ Presentation ifeu ❷ Transport bottom-up GHG emission what for? ❸ The methodology of the MobiliseYouCity tool ❹ ❺ Monitoring and KPIs Next steps


6 Situation in cities: the relevance of transport- examples Share of transport emissions in cities GHG-Emissions in Germany: 12-23% GHG-emissions in Sfax (Tunisia): 40% comes from transport Source: IFEU-calculation for several cities > inhab. Source: Taieb 2016


7 Why top-down (tier 1) GHG emissions? National fuel sales i l GHG emission factor of fuel i CO2eq/l - Gross estimation + Easy + Straight forward + Gives total CO2 emissions Transport GHG emissions - Complex + Gives a detailed picture of GHG emission + Better quantification of pollution emissions + Enables quantifying effect of policies Total activity Modal splít Energy Intensity Carbon content km % l/km CO2eq/l i = fuel type
8 Agenda of today ❶ Presentation ifeu ❷ A bottom-up transport GHG emission methodology what for? ❸ The methodology of the MobiliseYouCity tool ❹ ❺ Monitoring and KPIs Next steps


9 Methodology & system boundary Provides a framework and a methodology to follow stepby-step Gives (inter)national defaults (e.g. emission factors) Enables fair comparison of the results for different cities Also followed by: Support on adaptation to the needs and answer to questions BOTTOM-UP GHG emission quantification Download under: y_mrv_approach.pdf Source: adapted from Dünnebeil et al., 2012
10 Content of the current tool Inventory Inputs: Road: kilometers per vehicle type & fuel, vehicle fuel consumption; occupancy rate; load Rail: total kilometer, total fuel consumption, occupancy rate and load BAU scenario Inputs: Road & Rail: Growth rate of kilometers per vehicle type; growth rate of fuel consumption, Population; Climate scenario Inputs: Road & Rail: share of km avoided, shifted or rate of improvement of vehicle fuel consumption (incl. Use of renewable energy) compared to BAU Outputs Transport performances (pkm) Total mileage (km) Modal split (%) GHG emissions (CO2eq) Emission savings BAU vs climate scenario (2016;2020;2025;2030;2040;2050) BAU: Business-as-usual
11 Levers for climate friendly transportation Avoid Shift Improve Using ICT (i.e. home office) City planning: short trips Shifting towards sustainables passenger modes (PT, bike etc) Improving vehicle use Improving vehicles energy efficiency Regional and local economy Future transport infrastructure (based on needs no traffic induced) Shifting towards sustainable freight modes (rail, navigation) Increasing the use of low carbon vehicles i.e. e- mobility, biofuels etc Improving traffic control ICT: Information and communication technology


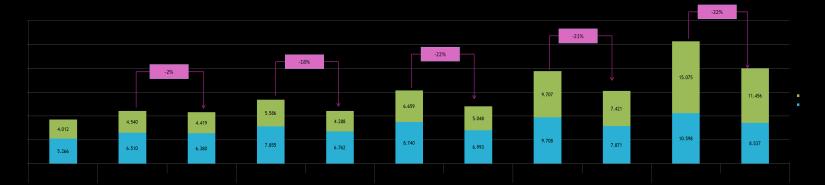

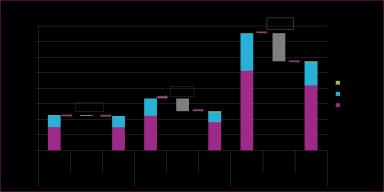
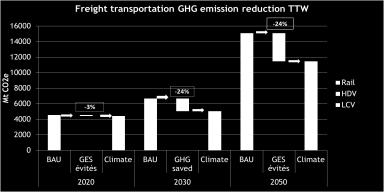
12 Example: graphic results Ifeu MYC tool
13 Agenda of today ❶ Presentation ifeu ❷ Transport bottom-up GHG emission what for? ❸ The methodology of the MobiliseYouCity tool ❹ ❺ Monitoring and KPIs Next steps
14 The heart of monitoring plan: KPIs KPI General KPI généraux du transport Value 2016 Value BAU 2030 Value Climat 2030 t CO2(eq)/inhab 0,81 1,23 0,94 g CO2(eq)/$ KPI passenger transportation (selection) KPI passenger transportation Value 2016 Value BAU 2030 KPI freight transportation (selection) Value Climat 2030 Modal split ind/pt (%) 53/47 61/39 47/53 % km electric train/metro KPI freight transportation Value 2016 Value BAU 2030 Value Climat 2030 Modal split road/rail (%) 98/2 99/1 91/9
15 Agenda of today ❶ Presentation ifeu ❷ Transport bottom-up GHG emission what for? ❸ The methodology of the MobiliseYouCity tool ❹ ❺ Monitoring and KPIs Next steps
16 Next steps What is planned for the first generalization phase of the tool? Have the tool in 3 languages Have a standardized output sheet for MobiliseYourCity reports Technical guidance documents Embedded error check For the future development: any adaptation is possible in the context of a project but it must be paid attention to the balance between complexity and user friendliness Current ideas : Provide defaults for specific regions e.g. fuel consumption values Allow calculating air pollution Integrate more options (ex: shift from bus to rail, biofuels, simplified approach, additional vehicle categories)
 Im Weiher 10 69121 Heidelberg Telefon +49 (0)6 221.")
17 Thanks for your attention! Marie Jamet Im Weiher Heidelberg Telefon +49 (0) Telefax +49 (0)

18 Scope of the emissions assessment in the tool Compendium on GHG baselines and monitoring, UNFCCC et al.

19 GHG emission calculation: ASIF methodology GHG Total activity Modal split Energy Intensity Carbon content Co2 eq km % l/km CO2eq/l NATIONAL Vehicle fleet Vehicle registration authorities Average mileage Survey/traffic counts % LOCAL km Mileage in the city per vehicle category l/km Vehicle fuel consumption Total fuel consumption Survey/traffic counts Survey/study/ defaults Total fuel consumption CO2eq/l Emission factors Total GHG emissions IPCC

20 KPIs currently available in the tool Gross values Give a trend to compare between years Relative values Give carbon intensity General GDP transport $ GDP transport Level and type of mobility Carbon intensity pass. Passenger transport % pkm Penetration of alternative fuel Freight transport Level and type of freight % $ GDP Carbon intensity freight tkm LPG/ CNG