Prepared for: Ebensburg Borough, Cambria County Pennsylvania
|
|
|
- Nickolas Howard
- 5 years ago
- Views:
Transcription
1 Prepared for: Ebensburg Borough, Cambria County Pennsylvania Prepared by: STIFFLER, McGRAW & ASSOCIATES, INC N. JUNIATA STREET HOLLIDAYSBURG, PENNSYLVANIA
2 TABLE OF CONTENTS 1. Introduction Wastewater Treatment Facilities Hydraulic Loadings and Projections Organic Loadings and Projections Wasteload Management Plan Industrial Wastes Sewer System Extensions Sewer System Monitoring, Maintenance, Repair, & Rehabilitation Condition of the Sewer System Combined Sewer System - Annual CSO Report Condition of the Pumping Stations Sludge Production and Disposal Certification of Preparer and Permittee...24 TABLES: Table 1 - Table 2 - Table 3 - Average Monthly Hydraulic Loadings and Annual Flow Projections Average Monthly Organic Loadings and Annual BOD Projections 2015 Industrial Park, Industrial Park-South and Emerald Estates Pump Station Flow Estimates and Projections EXHIBITS: Hydraulic Loadings Graph Organic Loadings Graph ATTACHMENTS: Flow Meter Calibration Certificate 2015 Annual Sewage Sludge Management Inventory 2015 Monthly CSO Data and Management Activities Summary i
3 1. Introduction Preparation of an annual Municipal Wasteload Management Report is required pursuant to Title 25, Chapter 94 of the PA Code. This chapter applies to the Ebensburg Municipal Authority (EMA) as the owner and operator of a public wastewater treatment plant (WWTP) and the associated collection and conveyance system. The purpose of the chapter is to manage wasteloads discharged to the sewer system to prevent the occurrence of overloaded facilities and to limit extensions and connections to all sewer systems that may be determined to be, or may become overloaded. Please note, in reviewing this report, that portions of the following narrative, tables and graphs contain information that has been derived from or based, in part, upon narrative and data obtained from previous annual reports and documents prepared by L.R. Kimball of Ebensburg, PA. 2. Wastewater Treatment Facilities The Ebensburg Municipal Authority (EMA) owns a wastewater collection and conveyance system and a treatment facility which serve customers in Ebensburg Borough and portions of Cambria Township in Cambria County. The wastewater collection, conveyance and treatment systems are operated and maintained by the Borough of Ebensburg under a management agreement with the EMA while the wastewater treatment plant is managed by the Severn Trent Environmental Services under a sub-contract with the Borough. The EMA wastewater treatment facility operates under National Pollutant Discharge Elimination System (NPDES) Permit No. PA and discharges at Outfall 001 to the Howell s Run. The flow and organic loading limits established in the most recent NPDES permit are 2.0 MGD for hydraulic loading and 2,652 lbs/day average monthly loading of BOD for organic loading
4 An upgrade of the treatment plant was completed in 1990 which converted the existing 1.25 MGD trickling filter plant to a 1.25 MGD activated sludge treatment plant utilizing the sequencing batch reactor (SBR) process. An expansion of the SBR treatment plant was completed in 2008 which increased the hydraulic treatment capacity of the plant to 2.0 MGD (5.5 MDG peak) and increased the organic loading capacity from 2,130 lbs/day to 2,652 lbs/day. The current SBR treatment plant consists of a mechanical bar screen, a grit removal unit, a grit classifier, four SBR tanks, an ultraviolet disinfection system, an effluent reaeration tank, an effluent ultrasonic flow meter, a process water storage tank, two sludge thickeners, four aerobic digester tanks, and a sludge dewatering centrifuge. The EMA collection and conveyance system also contains two (2) permitted Combined Sewer Overflows, referred to as the Griffith s Field Diversion Structure (Outfall 002) and the Shenkle Mill Road (aka Lakeview Road) Diversion Structure (Outfall 003). Both CSOs discharge to Howells Run. The CSOs serve the remaining combined sections of the collections system. The Griffith s Field CSO serves Subsystem 3 of the collection system while the Shenkle Mill Road CSO serves Subsystem 4. Both CSOs are equipped with flow meters which log operation of the CSOs. The CSOs are operated and maintained in accordance with the EMA CSO Long Term Control Plan and Nine Minimum Controls. Terms and conditions of the current NPDES permit for the WWTP call for both CSOs to be eliminated and for all flows to be conveyed to the WWTP. To accomplish this goal, the EMA is currently undertaking a comprehensive inflow and infiltration evaluation which will be utilized to develop a project or projects aimed at reducing extraneous wet weather flows entering the sewer system to levels that will eliminate discharges from the CSOs and enable the CSOs to be abandoned. It is anticipated that the projects will involve the separation of storm sewers from the sanitary sewer system and replacement of a substantial portion of the collection systems tributary to these CSOs. The status of the evaluation is discussed in more detail in Section 4 of this report - 2 -
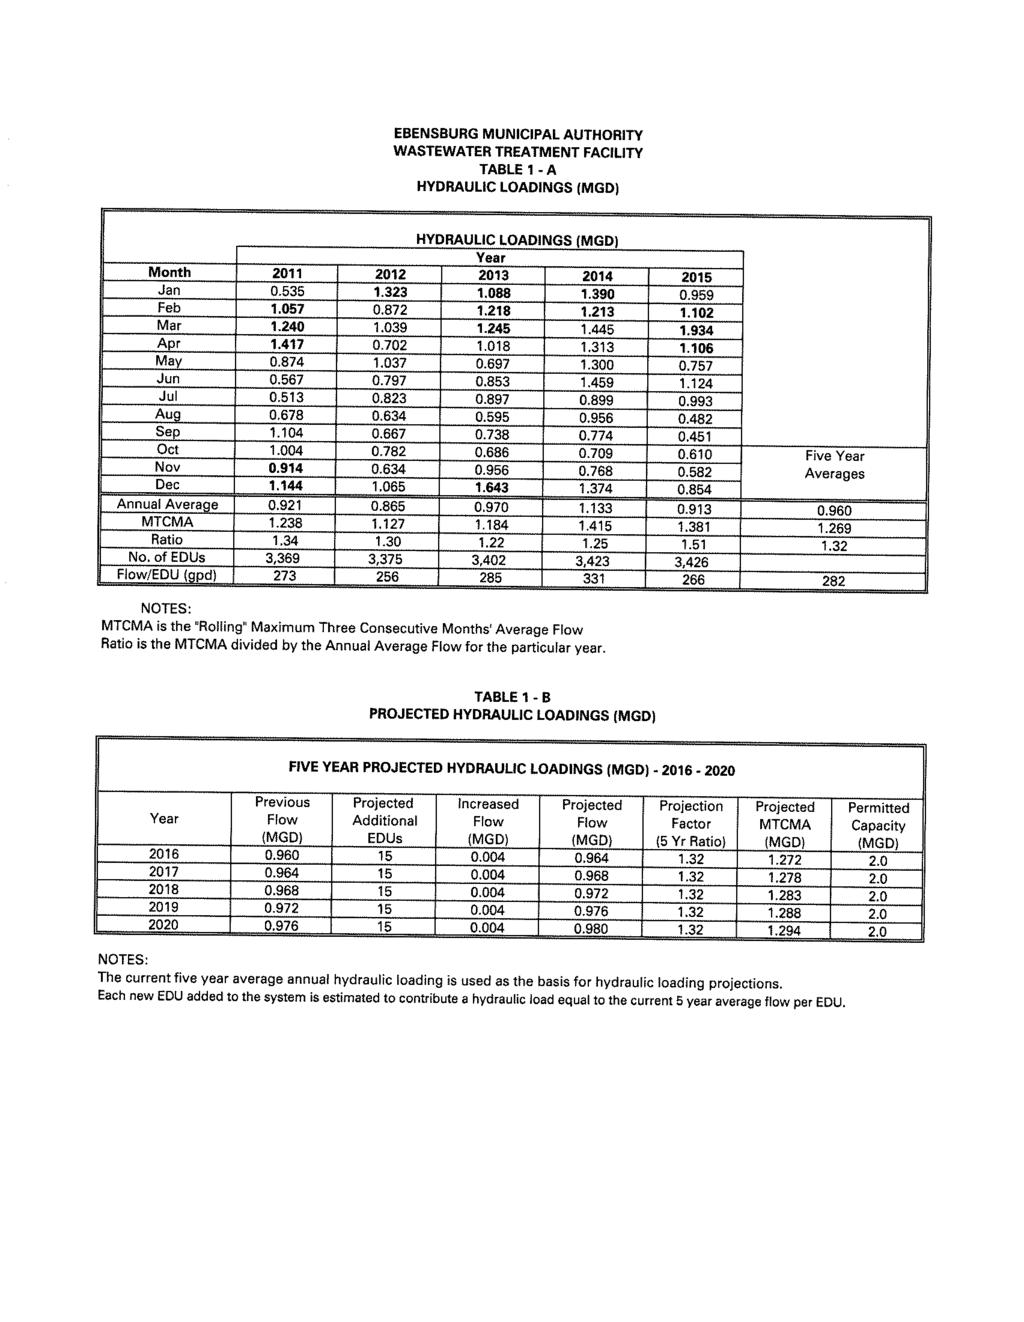
5 3. Hydraulic Loadings and Projections Table 1-A (found in the Tables section at the end of this report) presents average daily flows for each month of the past five (5) year operating period. Average daily flow rates for each month shown represent the arithmetic mean of all daily flow measurements collected over each calendar month. Table 1-A also presents the annual average flow for each year of the previous five year operating period as well as the average of the maximum three consecutive monthly flows and the ratio between these flows. In 2015, the annual average monthly flow to the treatment plant was MGD and the rolling maximum three consecutive months average (MTCMA) flow was MGD which occurred during the three month period of February through April, Both were below the limit of 2.0 MGD established in the plant s NPDES permit limit for Chapter 94 reporting. There also were no single months during which the average daily flow exceeded the permitted hydraulic loading limit. Thus, the treatment plant was not hydraulically overloaded in 2015 as defined under Title 25, Chapter 94 of the PA Code. The Hydraulic Loading Graph in Exhibit A (found in the Exhibits section at the end of this report) is a graphical representation of the data in Table 1-A. Table 1-B presents information relative to projected hydraulic loadings for the ensuing five year operating period. The past five year average daily flow serves as the basis for the projections. For each year of the ensuing five year operating period, increased flows due to new system connections are added to the five year average flow to result in the projected annual average flows. The five year average ratio of the maximum three consecutive months average flow to the annual average flow for the previous five year operating period serves as the projection factor to determine whether an impending hydraulic overload exists
6 The annual average hydraulic projections are based on past trends in development and the Authority's knowledge of potential developments within their service area. During 2015, only three (3) new connections equivalent to three (3) EDUs were made within the collection system owned and operated by the EMA. Two (2) were located in Ebensburg Borough and one (1) was located in the Cambria Township service area. All three connections were for single family residential uses. The additional three (3) EDUs increased the estimated total service area EDU count to 3,426. Although there are no immediate or definite plans for new connections from existing or proposed developments, several areas of the Borough and Cambria Township that are served by the Ebensburg WWTP may experience development during the five year planning period. Both the Emerald Estates single family residential development and the S&P Estates residential development may see additional growth, with a potential additional ten (10) EDUs in Emerald Estates and twenty (20) EDUs in the S&P Estates. Additional development may also occur in the Cambria County Industrial Park South Complex, Phase I which currently has fifteen (15) lots available for development. The proposed South Complex Phase II, which is currently in the planning stages, will provide up to an additional eighteen (18) lots for light industrial development. The potential also exists for commercial development within the SR219 and SR22 interchange. Over the previous five year period, the service area has experienced an average growth of approximately eleven (11) EDUs per year. Therefore, in order to provide for potential additional development in these areas and for potential in-fill development elsewhere in the Borough and Township service areas, an average of fifteen (15) additional EDUs per year has been used for projecting flows to be contributed from the EMA service area over the next five year planning period. The Hydraulic Loading Graph in Exhibit A graphically depicts the projection of the annual average daily flows and the MTCMA flows over the next five years through 2020 expressed by the data in Table 1-B
7 As the data tables and graph indicate, the projected hydraulic loading will remain well under the treatment plant s NPDES permitted capacity through the next five year planning period. Based upon the existing and projected hydraulic loading data, the plant is currently not hydraulically overloaded and is not projected to become hydraulically overloaded, as defined by Title 25, Chapter 94 of the PA Code. 4. Organic Loadings and Projections Table 2-A presents the average daily organic loading for each month of the past five (5) year operating period. Average daily loads for each month shown represent the arithmetic mean of the BOD 5 loading values calculated and recorded each calendar month. Table 2-A also presents the annual average organic load for each year of the previous five year operating period as well as the maximum monthly load and the ratio between these loads. Each organic loading value shown as a monthly average was computed by utilizing the daily flow for the day the BOD 5 analysis was performed and the result of the BOD 5 analysis. The following formula derived the BOD 5 in pounds per day: BOD 5 concentration (mg/l) x daily flow rate (MGD) x 8.34 lbs./gal. (conversion factor) = pounds of BOD 5 per day. The monthly average was then obtained by averaging all BOD 5 loadings calculated through the course of each respective month. During 2015, the annual monthly average organic loading was calculated to be 957 lbs/day which is well below the plant s permitted capacity of 2,625 lbs/day. There also were no instances where the treatment plant experienced monthly average organic loadings that exceeded the plant s permitted organic capacity. The maximum monthly average organic loading recorded in 2015 was 1,554 lbs/day and was recorded in March. Therefore, the wastewater treatment plant was not organically overloaded in 2015 as defined under Title 25, Chapter 94 of the PA Code
8 Table 2-B presents information relative to projected organic loadings for the ensuing five year operating period. The five year average organic load serves as the basis for the projections. For each year of the ensuing five year operating period, increased loads due to anticipated new system connections are added to the five year average load to result in the projected annual average organic load. The average ratio of the maximum monthly load to the annual average load for the previous five year operating period serves as the projection factor to determine whether an impending organic overload exists. Projections of the annual average and one-month maximum loadings show that organic loadings are expected to remain below the permit limit through the five year planning period. Exhibit B provides a graphical representation of the above described past and projected organic loads. Based upon the current and projected organic loading data, the plant is currently not organically overloaded and is not projected to become organically overloaded within the next five year planning period, as defined by Title 25, Chapter 94.1 of the PA Code. 5. WASTELOAD MANAGEMENT PLAN The projected annual average monthly flow, the projected peak three consecutive month's average monthly flow, the projected annual average monthly organic loading and the projected peak month's average monthly organic loading all fall below the permitted capacity of the plant for the next five years. However, due to the age and condition of the Borough collection and conveyance system and the presence of stormwater connections to the sewer system, a significant increase in flows is experienced during wet weather as a result of inflow and infiltration. Much of the collection and conveyance system is constructed of vitrified clay pipe and was installed in the early1900 s. In addition, two sections of the collection system are combined sewer systems which contain direct connections of stormwater. To reduce the wet weather induced flows and to improve the system s hydraulic conveyance and treatment capacities, the EMA has undertaken a number of projects - 6 -
9 over the past several years, which have been aimed at reducing sources of inflow and infiltration. Previous projects have included: 1. Installation approximately 6,400 LF of cured-in-place liner in the terra cotta sewer lines serving the Cambria County Industrial Park (1997) 2. Replacement of 5,010 LF of 8 VCP pipe with SDR35 PVC pipe and precast manholes (2007) 3. Replacement of 1,230 LF of 10 VCP with SDR35 PVC pipe and precast manholes (2007) 4. Replacement of 2,540 LF of 12 VCP with SDR35 PVC pipe and precast manholes (2007) 5. Replacement of 360 LF of 12 VCP with SDR26 PVC pipe and precast manholes (2007) 6. Replacement of 820 LF of 15 VCP with SDR35 PVC pipe and precast manholes (2007) 7. Replacement of 535 LF of 18 VCP with SDR35 PVC pipe and precast manholes (2007) 8. Replacement of 1,105 LF of 6 service laterals with SDR35 PVC pipe (2007) 9. Cleaning and video inspection of the sanitary sewers in the Cambria County Industrial Park, New Germany Road, Mini Mall Road and Industrial Park Drive. Main line defects identified were repaired or replaced. In addition, repairs/replacements were made to numerous defective lateral connections to the Industrial Park s terra cotta main that had previously been lined in 1997 (2010) The work completed in 2007 removed inflow/infiltration from the Fairground Interceptor and a portion of the West Street Interceptor that flow to the Griffiths Field CSO. Despite these improvements, a certain level of inflow and infiltration continues to exist within the system and periodic operation of the operation of both CSO Outfalls has continued to occur. In light of this, the PA DEP has included a Schedule of Compliance in the most recent NPDES permit renewal for the WWTP that requires the two CSOs to be eliminated and that all flows within the sewer system to be conveyed to the treatment plant
10 To accomplish this goal, the EMA initiated a new sewer system study in last quarter of 2015 which has been designed to characterize inflow and infiltration and plan for long term collection system repairs and improvements that are aimed at reducing the wet weather flows that result in discharges from the Authority s two CSOs. Because the system flows appear to react quickly in response to rainfall and snow melt, initial investigations are aimed at identifying and reducing inflow into the system. Following the initial inflow evaluation, a characterization of the infiltration experienced will be completed. The study is being completed through use of a combination of analytical methods including smoke testing, flow metering, visual observations, and limited internal inspection of the system. At completion, the study will provide a prioritization of system needs which will be utilized to define the scope of future improvement projects. A summary of the scope of work to be provided in this study includes: 1. Generation of an updated sewer collection system map. The updated map will be used to assist with the planning of future projects. 2. Preparation of a manhole inventory. The inventory involves the inspection and inventory of all accessible manholes in the Authority system. The inspection will provide various physical and condition data about each manhole, and observations regarding leakage and potential for surface water infiltration. The data collected will be used to classify repairs needed for each manhole and to prepare a prioritized list recommended manhole repairs. 3. Collection System Smoke Testing. Smoke testing at key manholes within the system will be used to identify defects that may be allowing inflow and infiltration into the system. Smoke testing will be conducted during dry weather, low groundwater conditions to improve the effectiveness of the testing. Defects identified will be documented by address, photo number and observation log entries. 4. Flow Metering. An analysis of system flows will be performed utilizing portable flow meters to obtain flow data under various weather conditions. Flow data obtained will be used to compare normal flows to wet weather flows in an effort to quantify relative infiltration amounts and to identify areas of apparent high infiltration and to screen those areas for internal examination. The flow metering plan includes initial flow monitoring in six major sub-systems, with follow-up monitoring in upstream locations to further pinpoint problem areas contributing excess flow
11 5. Internal video inspections. Internal inspection of the lines will be conducted in areas where problems were identified through visual inspections during manhole inspections, smoke testing, flow metering and other observations. 6. Final report preparation. Following completion of the preceding activities, a final report will be prepared that summarizes the results of the field investigations and records review. Each defect identified will be assigned a repair priority. Preliminary cost estimates will be prepared for remediation of defects identified in the public system along with recommendations for remediation. A list and location of defects and inflow sources identified on private lines will also prepared for use by the Authority to notify customers of the defects or violations and the follow-up action to be completed by the customer. 7. Preparation and submission of a Remediation Plan. Following review of the final report by the EMA, a Remediation Plan will be prepared which outlines projects to be undertaken along with a proposed schedule of implementation for the projects. The Plan will then be submitted to PA DEP for approval. Authorization was granted in October 2015 by the EMA to proceed with the sewer system evaluation. To date, work on the updated system mapping has been commenced and is expected to be completed in the Spring of The manhole inventories have been completed for all manholes that were accessible or able to be located in the field. Additional manhole inventories will be completed for manholes that may be located during the internal video inspection stages of the investigation. remaining manholes within a proposed project area that were not inspected during the initial inventory will be located and inspected during the design phase for that specific project area. Any Data gathered during the manhole inspections and sewer line video inspections will be incorporated into the mapping update to improve the accuracy of the system map and project design. Six flow meters were installed on November 11, 2015 and were monitored weekly through mid-january The initial flow metering data has been reviewed and additional areas have been selected for the second round of flow metering in order to further isolate potential problem areas. The first round of internal video inspections has also been commenced. Smoke testing will be scheduled once the system mapping is completed and weather and groundwater conditions are favorable for smoke testing
12 At the completion of the investigation, a Remediation Plan will be prepared and submitted to PA DEP which has been based upon the findings and recommendations in the Inflow and Infiltration Investigation report. The Remediation Plan will include a proposed implementation schedule for the completion of the proposed projects that are expected to result in a significant reduction of inflow and infiltration and the ultimate elimination of CSO 002 and CSO Industrial Wastes There currently are no known industrial customers that discharge process or non-domestic wastewater to the Ebensburg wastewater system. To date, wastewater discharges from the industrial users connected to the Ebensburg sewer system have resulted in no known adverse impacts on the collection or conveyance systems, treatment plant operations, or pass-through to the receiving stream. In accordance with the current NPDES discharge permit, annual Whole Effluent Toxicity (WET) testing was performed August 25 through September Testing performed for both Ceriodaphnia dublia and Pimphales promelas passed the respective endpoints for both species tested. The successful results provide support to the assertion that the treatment plant operations and processes are not adversely impacted by discharges from industrial users connected to the wastewater collection system. In 1989, the Borough of Ebensburg adopted a comprehensive amendment to its ordinances which regulate industrial wastewater discharges. The ordinance amendments have been reviewed and approved by the PA DEP as part of the WWTP upgrade project
13 7. Sewer System Extensions and Connections No sewer line extensions were constructed and only three (3) new sewer connection permits were issued within the EMA owned and operated service area in All three connections were for single family residences which added a total of three (3) EDUs to the system. Two of the connections were located in Ebensburg Borough and one was in Cambria Township. No extensions of service are currently planned for construction within the EMA service areas in 2016 or the immediate future. 8. Sewer System Inspection, Maintenance and Monitoring During 2015, maintenance, daily operation and administration of the WWTP were performed by licensed treatment plant operators and maintenance personnel of Severn Trent Services, a contract WWTP operations service. The WWTP has a preventative maintenance plan which is implemented by the operators. The plan includes routine measures such as greasing pump and blower motor bearings, oil and filter changes on blowers, and cleaning and service of the plant s emergency generator, UV disinfection system, centrifuge, mechanical bar screen, solids compactor and grit washing equipment. Required analyses and sampling frequencies of treatment plant influent and effluent are performed in accordance with the Authority's NPDES Permit for the treatment plant. NPDES compliance monitoring is performed as follows: The hydraulic loading is monitored continuously, through use of the plant s ultrasonic effluent flow meter situated immediately ahead of the UV disinfection unit. The flow meter is checked and calibrated annually. 24-hour composite samples are collected twice per week from the WWTP s influent and effluent streams utilizing two refrigerated, automatic samplers. The influent samples are analyzed for BOD and total suspended solids while the effluent samples are analyzed for CBOD, suspended
14 solids, ammonia-n, total nitrogen and total phosphorus. Effluent ph and dissolved oxygen (DO) concentrations are measured from grab samples collected twice per week. An Ultraviolet (UV) system is utilized for effluent disinfection. Grab samples of the post-disinfection effluent are collected twice per week and are analyzed for fecal coliform levels. As mentioned in the Industrial Wastes section of this report, the NPDES discharge permit that was reissued for the WWTP in 2013 requires annual chronic WET testing to be performed on the WWTP effluent. WET testing was completed in August and September 2015 with passing results for both the Ceriodaphnia dubia and Pimephales promelas endpoints analyzed. The collection system and pumping stations are operated and maintained by the Ebensburg Public Works personnel under the direction of the Public Works Superintendent. Routine and preventive maintenance and repairs were performed as necessary during the year throughout the collection system. Portions of the collection system are sewer jetted and inspected with video equipment to identify sources of groundwater infiltration and line sections in need of repair or replacement. During 2015 two sections of broken sewer mains were discovered during the sidewalk installation project in the Borough. The broken mains were situated near storm drains and were believed to be taking on stormwater. Both were repaired during the project. During 2015, fifty-four (54) pre-sale tests were conducted on the customer service lines prior to property transfer. Six (6) were in Cambria Township and the remainder were in Ebensburg Borough. All defects identified were corrected prior to transfer. In addition to pre-sale testing, the Borough sent violation notices to the owners of the twenty-eight (28) properties identified with defects during smoke testing conducted in the Crestwood and Industrial Park areas in Fifteen (15) corrections have been verified to date. The Borough will be following up with the remaining locations in
15 Operation of the CSO diversion structures is monitored through use of flow meters installed within the structures. The meters continuously monitor overflow discharges and flow to the WWTP. The meters record the frequency, volume and duration of the CSO overflows. Data recorded by the meters are reported on the monthly CSO Supplemental Report forms which are submitted to PA DEP along with the monthly WWTP Discharge Monitoring Reports. Tables summarizing precipitation and flow data recorded each month for both CSOs and are provided in Attachments section at the end of this report. The CSOs are checked following each precipitation event and on a minimum monthly basis. Service complaints are investigated by the Borough personnel and are managed in a timely manner. The Borough, the EMA and Severn Trent Services each have the personnel, equipment and parts necessary to complete minor repairs and to conduct routine maintenance. Major repairs requiring specialized equipment and outside assistance are handled through local contractors, when needed. 9. Condition of the Sewer System The wastewater treatment plant is relatively new, is in good operating condition and has operated well within the discharge limits of the current NPDES discharge permit. No major repairs or improvement projects have been necessary within the treatment plant in On the contrary, the collection and conveyance system may be considered to be generally in fair, and in some areas, poor condition. The collection system has adequate capacity to convey existing dry weather flows. However, the collection system is subject to high flows resulting from wet weather inflow and infiltration. The system is also a partially combined sewer system and contains two currently permitted CSO outfalls (Outfall 002 and Outfall 003) as discussed in previous sections of this report. The wet weather flows have resulted in periodic overflow from the CSOs. During 2015, fifty-three (53) overflow events were recorded at CSO 002 and forty-nine (49) were recorded at CSO 003. Although no major improvements, repairs or replacements were necessary to be performed
16 within the system during 2015, it is anticipated that significant improvements (line and manhole replacements or rehabilitation and storm water separations) will be determined to be necessary in a major portion of the system, pending the outcome of the sewer system investigation that is currently underway. As discussed in the Wasteload Management section, the EMA commenced an Inflow and Infiltration Investigation during the last quarter of 2015 which is expected to continue through a majority of The investigation is aimed at identifying and characterizing sources of inflow and infiltration into the collection and conveyance system. The results of the investigation will be utilized to develop a remediation plan and implementation schedule for projects to be undertaken to reduce wet weather induced flows within the collection and conveyance systems to a level where the CSOs are no longer needed and are ultimately able to be eliminated. An internal video inspection is also currently being completed within the Industrial Park collection and conveyance system by the Authority s engineering consultant in an effort to locate the source or sources of infiltration within that subsystem. Wet weather flows observed emanating from the subsystem and at the Industrial Park Pump Station in 2015 are higher than expected and this system has had a history of problems in the past. Findings from this separate investigation will be used by the Borough to identify specific areas of that section of the system in need of further investigation and/or potential repair and replacement. An abnormally high peak flow period was recorded at the Industrial Park pump station in March 2015 which is believed to have been the result of the pipe liner becoming dislodged between two manholes and allowing infiltration to enter the manhole section. The liner had been installed in several sections of the Industrial Park collection system to reduce infiltration within that section of the service area. The liner was repaired but elevated flows continue to be present within that service area. It is suspected that the liner may have become separated in additional locations within the Industrial Park service area since large amounts of
17 stones and debris have been found in the collection system pipes. The Borough maintenance personnel have also found significant leakage where the liner terminates in the manholes. During 2016, the Borough plans to utilize chemical grout to reseal the liner and host pipe to reduce the leakage until such time that a more comprehensive rehabilitation project may be planned and scheduled. 10. Combined Sewer System Annual CSO Report The two system CSOs are maintained in good operating condition. No instream water quality impacts or adverse effects on downstream water uses are known or have been observed to exist. The following is a summary of CSO operation and status of the Nine Minimum Controls for the 2015 operating year. CSO Operations Summary: a. Frequency, duration, volume and cause of CSO discharges for 2015 Outfalls 002 and 003 are currently the only active and permitted CSOs on the EMA sewer system. There were a total of fifty-three (53) recorded discharge events from CSO Outfall 002 and a total of forty-nine (49) events from CSO Outfall 003 during the 2015 operating year. The discharge events were all the result of elevated wet weather flows due to precipitation or a combination of precipitation and snow melt. A detailed listing of each event for each CSO is provided on the monthly CSO flow summary tables and the DEP monthly CSO Supplemental Reports found in Attachments section at the end of this report. b. Operational Status of all overflow points Both the CSO 002 and 003 diversion facilities and their associated equipment were functional during the 2015 operating year. c. Identification of known or potential in-stream water quality impacts, their causes and effects on downstream water uses No adverse impacts were observed in the receiving stream as a result of the discharges from the two CSOs, and there were no known or reported in-stream water quality impacts due to these discharge events. Flows within the receiving stream were generally elevated and turbid due to the storm event and additional rain events preceding the overflow which resulted in a dilution of the CSO discharges
18 d. Summary of all actions taken during the year to implement the Nine Minimum Controls (NMC) and the CSO Long Term Control Plan (CSO-LTCP) and their effectiveness The CSOs are checked after each significant precipitation event and at least once per month by the WWTP personnel. Any necessary maintenance or repairs are performed immediately. All CSO discharge activity is recorded and reported on monthly CSO report forms which are submitted with the monthly DMR reports. The CSO facilities are cleaned as necessary to reduce the chance of flushing accumulated debris during discharge events. More detailed operational information is provided in the following Nine Minimum Controls section. e. A summary and progress report on implementing necessary revisions to the NMC and LTCP The EMA, in October 2015, authorized the preparation of an Inflow and Infiltration (I/I) Investigation which is aimed at identifying sources of I/I and prioritizing recommended projects and measures that may be implemented to reduce I/I entering the sewer system and ultimately enable the elimination of both CSO facilities. The Inflow and Infiltration Investigation is currently underway and is currently planned to be completed in f. Precipitation Data Associated with CSO Discharge Events See the monthly summary tables of CSO events provided in Attachments section at the end of this report which include precipitation data for each CSO overflow event. g. CSO Inspection Summary Both CSOs were checked on a routine monthly basis and after each significant precipitation event during 2015 to identify any obstructions, necessary maintenance or repair, and operation of the respective CSO. CSO flow meter data is downloaded during each monthly inspection. No blockages were identified during An internal inspection of the CSO chambers is performed at least annually and is cleaned as needed. h. List of blockages (if any) corrected or other interceptor maintenance performed, including location, date, and time discovered, date and time corrected, and any discharges to the stream observed No blockages occurred during i. Dry Weather Overflows No dry weather overflows occurred during j. Wet Weather Overflows A total of fifty-three (53) wet weather discharge events were recorded at CSO 002 and a total of forty-nine (49) were recorded at CSO 003. Details regarding the dates, discharge flow volumes, duration and cause are included in the Summary tables found in Attachments section at the end of this report
19 k. Chronic or Continuous Discharges There were no chronic or continuous CSO discharges occurred during All discharges were due to stormwater flow resulting from precipitation events which elevated flows within the combined sewer system and allowed combined flows to overflow the control weirs. Overflows subsided and ceased following termination of the precipitation event and associated stormwater runoff. Nine Minimum Controls Implementation: a. NMC-1 Regular Operation and Regular Maintenance Program The contract operators of the WWTP (Severn Trent Services) conduct regular operation and maintenance of the WWTP in accordance with the Preventative Maintenance Plan (PMP) developed for the WWTP. Implementation of the PMP ensures that the WWTP is capable of handling peak flows to the greatest extent feasible during and after wet weather events. The CSOs are operated and maintained by the Borough Public Works personnel. The Borough personnel inspect the CSOs after each significant precipitation event and at least once per month. The CSO Activities list provided in the Attachments section at the end of this report includes a summary of CSO monitoring and management activities performed during the 2015 operating period b. NMC-2 Maximum Use of the Collection System for Storage During the last quarter of 2014, the Borough raised the CSO weir overflow elevations by ½ to increase storage in the collection system and to divert more wet weather flow to the WWTP. Based upon flow conditions observed by the Borough personnel during 2015, raising the weir elevations further will create overflows at the WWTP and therefore will not be possible. Routine sewer jetting of collection system lines in location where debris has been found to accumulate is also performed to maintain maximum conveyance and storage capacity of the collection system c. NMC-3 Review and Modification of Pre-Treatment Requirements As discussed in previous reports, the Borough adopted a comprehensive amendment to its ordinances regulating industrial waste discharges in The amendments were subsequently approved by PA DEP. Ebensburg continues to maintain and enforce these pre-treatment requirements. No significant industrial users are connected to the sanitary sewer system and no existing industrial customers are known to discharge wastewater other than sanitary sewage. d. NMC-4 Maximization of Flow to the Sewage Treatment Plant The CSO flow data is used to evaluate the operation of the CSOs to determine if adjustments may be made to the weir elevations to send more flow to the WWTP. This data, along with flow data for the WWTP were used in 2014 to increase the elevations of the weirs by ½. Based on flow data reviewed in 2015 and the observed impacts of the increased flows in the conveyance system to the WWTP, an additional adjustment to the weir elevations will not
20 be feasible since an increase will cause overflows at the WWTP. Flow data will continue to be collected and monitored in 2016 to provide information for future evaluations. e. NMC-5 Elimination of CSOs During Dry Weather Based upon historical data collected, discharges from the CSO facilities occur during wet weather events, unless a physical obstruction or blockage of the line to the WWTP would occur that would cause a backup in the line and subsequent overflow. During 2015, no dry weather discharges were recorded or known to occur. Inspection of the CSO facilities are conducted as least monthly to check to make sure they are flowing freely to the WWTP, and within 24 hours of a significant wet weather event to make sure debris has not accumulated that may be obstructing flows to the WWTP. Should a dry weather discharge event occur, it will be reported on the monthly CSO Supplemental forms that are submitted with the DMR reports. Signage at the CSO outfalls also informs the public to notify the Borough in the event of an observed overflow during dry weather. f. NMC-6 Control of Solid and Floatable Materials Street sweeping is conducted on a regular basis within the service area to reduce the amount of debris washed into the combined system during wet weather. Sweeping is typically performed two to three times per month in the business district and at least once during the Spring throughout the remainder of the Borough. Trash receptacles are provided throughout the downtown area and are picked up once per week which reduces littering and subsequently reduces litter from being washed into the storm inlets on the combined system. Yard waste is collected by the Borough at a drop-off location and leaves are collected in the fall at curbside up by the Borough Public Works Department using a leaf vac and are composted at the Borough compost facility. The yard waste and leaf collection and composting helps prevent inlets and sewer lines from becoming clogged with leaf debris and helps maintain the conveyance capacity of the sewer system to the WWTP. The installation of screening mechanisms in each of the outfall facilities, as proposed in the 2014 Chapter 94 Report, has been deferred indefinitely since the CSOs are planned to be eliminated. g. NMC-7 Pollution Prevention Program The Borough currently implements both a recycling and yard waste collection program which help to reduce the potential for debris to enter the combined sewer system. The Borough has also developed a public education program to inform the public of the need to remove sources of extraneous water from the sewer system and the impact to the sewer system and receiving streams of dumping of cleaning chemicals, oils and hazardous materials into the sewer
21 system and storm inlets. The program has previously consisted of public meetings, news releases and printed materials. Ebensburg provides a semi-annual newsletter to customers with articles regarding the need to remove sources of extraneous water from the sewer system to prevent overloading the system during wet weather and the need to avoid dumping of pollutants into the sanitary or storm sewer systems to prevent adverse impacts to the WWTP and receiving stream during wet weather discharge events. News releases and notification letters have been provided to customers prior to smoke and dye testing to explain the reasons for the testing and need to remove the extraneous water from the sewer system. The Ebensburg Borough website also includes a section that explains the smoke testing procedures, pre-sale dye testing requirements and the effects of illegal stormwater connections to the sanitary sewer system. h. NMC-8 Public Notification of Overflow Occurrences and their Impacts Signage is provided at both CSO outfall locations with includes warnings to the public of the potential hazards of contact with the discharge water and also provides Borough contact information in the event of an observed dry weather discharge event. The public education program and Borough website have provided information to the public regarding the risks and impacts of the discharges from the overflows. i. NMC-9 Monitoring to Characterize the CSO Impacts and the Efficiency of Controls - Please see the Attachments section of this report for dates of CSO activities and related events during Characterization of the frequency, duration, and volume of CSO discharges on a monthly basis may be found in the monthly CSO Supplemental Reports and also on the CSO Flow Summary Tables found in Attachments section at the end of this report. 11. Condition of the Pumping Stations There are currently six (6) sanitary sewage pumping stations within the EMA sewer service area. However, only four (4) of the six (6) are owned and operated by the EMA. The four EMA pump stations include the Cambria County Industrial Park Pump Station, the Cambria County Industrial Park-South Park Pump Station, the Emerald Estates Pump Station and the Ebensburg Water Treatment Plant Pump Station. The two privately owned, operated and maintained pump stations include the Cambria Co-Gen Plant Pump Station and the Ebensburg Center Pump Station
22 None of the EMA pump stations are equipped with flow meters. Therefore, recorded pump runtimes are utilized to estimate flows. In addition, since the pump stations are not visited daily, daily runtime records are not available to calculate an actual peak day flow. Therefore, it is only possible to estimate flow. Flow estimates and projections are based upon the recorded pump run times, pump station rated capacities, the maximum runtime recorded during any read period, a calculated ratio of the maximum recorded runtime to the average annual daily runtime, a calculated daily peaking factor and projected growth within the pump station service area. The average annual daily flow rate is calculated by dividing the total valid runtime hours recorded during the year by the number of days in the valid annual read period, and multiplying the result by rated capacity of the pump. The maximum weekly read period daily flow rate is similarly calculated by dividing the read period runtime hours of the weekly read period with the highest valid recorded runtime hours by the number of days in that read period and then multiplying the result by the rated pump capacity. A read period runtime may be considered to be an invalid record if a pump clog or pump control malfunction has been noted to have occurred by the system operators and the malfunction has caused the pumps to run for extended periods of time without pumping flow. Where an invalid read period has occurred, the weekly read period is not included in the runtime hours, read period days, or the annual average flow calculations since these periods would erroneously, and in many cases drastically, inflate the calculated flows and resulting peaking factors for the pump station. The pump station s estimated maximum daily flow rate is calculated by dividing the average daily runtime hours calculated for the read period with the highest valid recorded runtime by the calculated annual average daily runtime to derive a weekly peaking factor. The weekly peaking factor is then multiplied by an assumed peaking factor of 1.3 to derive a daily peaking factor. The resulting daily peaking factor is then multiplied by the calculated average annual daily flow to derive an estimated daily peak flow for the pump station. The calculated daily
23 peaking factor is also applied to projected average daily flow to be generated by the additional EDUs to be connected in the service area during the next two year period to derive a peak daily flow to be contributed by the additional EDUs. The estimated peak flow from the new EDUs is then added to peak daily flow rate calculated for the pump station to derive the two-year peak daily flow rate. Cambria County Industrial Park Pump Station As the name indicates, this pump station serves the businesses in Cambria County Industrial Park, including the PA DEP Ebensburg District Office, the State Police Barracks, the Marine Reserve Office, a taxidermy school, a computer business, a health spa, Fiberblade, a multiple restaurants, a convenience store and garage buildings. The rated capacity of this pump station is approximately 388,880 gpd, with one pump in operation. Based upon the 2015 pump runtime meter records, the average daily flow for this pump station in 2015 was estimated to be 99,380 gpd and the peak daily flow was estimated to be 408,038 gpd. Assuming the connection of an additional two (2) EDUs over the next two years, the projected peak day flow will increase to 410,353 gpd. Based upon these flow estimates, the rated capacity of the pump station was exceeded for a short period of time during early March, which likely required both pumps to operate during peak flow periods. Both pumps were able to handle the flows during this period and the high flows did not result in a sewer system overflow. As discussed in the Condition of the Sewer System section of this report, the high flows experienced in March were likely due to the separation and dislodging of the pipe liner system in one section of the collection system upstream from the pump station which allowed a significant amount of groundwater to enter the system. The liner has since been repaired in that location and in 2016 the Borough maintenance personnel plan to reseal the liner termination points in several manholes to reduce leakage at these locations. It is believed that the repairs made to date have reduced the loading on the pump station that was observed in March to
24 levels below the pump station s rated capacity, however elevated wet weather flows continue to be apparent within the tributary system. Since the service area tributary to this pump station has continued to exhibit higher than expected flows during wet weather, the Borough has scheduled a video inspection of the system to be completed in February 2016 to identify potential sources of inflow and infiltration and areas in need of further investigation and potential repair or replacement. With respect to maintenance of the pump station, both pumps were replaced in Cambria County Industrial Park Pump Station South Park Pump Station This pump station is tributary to the Cambria County Industrial Park Station and currently serves only the Gamesa Plant. At this time the Gamesa plant is not in business and is occupied only by a security guard. Therefore flows to this pump station are minimal. This pump station has a rated capacity of 167,040 gpd. Based upon 2015 pump station runtimes, the average daily flow was estimated to be 1,401 gpd and the peak daily flow was estimated to be 4,790 gpd. This station is operating well below its design capacity and is expected to continue to do so through the two year planning period. No major repairs or replacements were necessary for this pump station in 2015 Emerald Estates Pump Station - This pump station serves the Emerald Estates residential subdivision. The pump station has a rated capacity of 362,880 gpd. The station is not equipped with a flow meter so recorded pump runtimes are utilized to estimate runtimes. Based upon the 2015 pump runtime meter records, the average daily flow for this pump station in 2015 was estimated to be 8,043 gpd and the peak daily flow was estimated to be 28,665 gpd. Assuming the connection of an additional two (2) EDUs over the next two years, the projected peak day flow will increase to 30,139 gpd. Based upon these flow estimates, the pump station operated within its rated capacity in 2015 and is expected to continue to do so through the next two year planning period. During 2015, one pump was replaced at this pump station
25 Ebensburg Water Treatment Plant Pump Station This pump station serves the Ebensburg Water Treatment Plant. The rated capacity of the pump station is 245,000 gpd. During 2015, the average daily flow was approximately 20,000 gpd. Flow rates fluctuate daily depending upon water product rates and quantities of water that are wasted at any given time. During trial operation of the Dissolved Air Floatation (DAF) treatment unit at the water plant, the pump station may have experienced peak flow rates as high as 100,000 gpd. During 2015, this pump station operated within its design capacity and is expected to continue to do so during the two year planning period. Only routine maintenance was required for this pump station in 2015 Detailed pump station runtimes, flow estimates and projections for the Emerald Estates and Industrial Park Pump Stations are found on Table 3 in the Tables section at the end of this report. 12. Sludge Production & Disposal Annual Sludge Management Inventory Waste sludge from the SBR process is processed in a series of four aerobic digesters for stabilization. The existing aerobic digesters were converted from the original treatment plant s clarifier units and anaerobic digesters and have a combined volume of approximately 448,000 gallons. Once stabilized the sludge is dewatered utilizing a sludge dewatering centrifuge which typically produces dewatered sludge with a solids content ranging from 17% to 20%. During 2015, the WWTP produced wet tons of sludge. At an average solids content of 18.37%, the wet tons of sludge was equivalent to dry tons. All dewatered sludge was disposed at the Laurel Highlands Landfill. In accordance with the current NPDES permit an Annual Sewage Sludge Management Inventory has been prepared for the 2015 operating year and is included in Attachments section at the end of this report. Actual WAS volumes pumped to the digester and WAS concentrations were not recorded in
26 Therefore, theoretic values from the DEP Sludge Estimating worksheet for an SBR process with aerobic digesters were utilized for the calculations in the Sludge Management Inventory During 2015, the WWTP accepted hauled in wastewater from two sources. A total of 2,500 gallons of filter backwash sludge was received from the Cresson Swimming Pool and 130,000 gallons of liquid sludge was received from the High Ridge Water Authority CERTIFICATION OF PREPARER AND PERMITTEE: I hereby certify that the information provided herein is true and correct to the best of my knowledge and belief. R. Michael McClain Stiffler, McGraw & Assoc., Inc. Signature of Preparer/Date Bernard Kozlovac, Wastewater, Project Manager Severn Trent Services Authorizing Signature of Permittee/Date Daniel L. Penatzer, Borough Manager Borough of Ebensburg Authorizing Signature of Permittee/Date
27
28 EBENSBURG MUNICIPAL AUTHORITY Wastewater Treatment Plant Hydraulic Loading Graph EXHIBIT A Chapter 94 Flow Limit MGD Flow (MGD) Operating Year Monthly Average Flow Projected Annual Average Flow Projected Max. 3-Month Flow Chapter 94 Flow Limit (2.0 MGD) Annual Average Flow Past Max. 3-Month Average Flow 2016 Stiffler, McGraw Associates, Inc.
29 EBENSBURG MUNICIPAL AUTHORITY Wastewater Treatment Plant Organic Loading Graph EXHIBIT B 3,000 2,652 lb/day 2,500 Organic Load (Lbs BOD5/Day) 2,000 1,500 1,000 1,484 1,067 1,789 1,190 2,009 1,920 1,248 1,266 1, ,761 1,769 1,776 1,784 1,792 1,151 1,156 1,161 1,166 1, Operating Year Monthly Average Organic Load Annual Average Organic Load Past Maximum Monthly Loads Permitted Capacity (2,652 lbs/day) Projected Annual Avg. Organic Load Projected Maximum Monthly Load 2016 Stiffler, McGraw and Associates, Inc.
30
31

32
33 Table 3 Ebensburg Municipal Authority Wastewater Pump Stations 2015 Flow Estimates and 2-Year Flow Projections 2015 Pump Station Parameters Emerald Estates Industrial Park Industrial Park South Pump Station Capacity (GPM) Pump Station Capacity (GPD) 362, , , Average Daily Runtime (hr/day) Calculated 2014 Average Daily Flow (GPD) 8,043 99,380 1, Estimated Flow/EDU (GPD) Pump Station's Max Recorded Runtime Period Jun 22 - Jun 29 Feb 25 - Mar 20 Mar 13 - Mar 30 Number of Days in Peak Period Peak Period Total Runtime Hours Peak Period Avg. Runtime (hr/day) Est Avg Flow during peak Period (GPD) 21, ,875 3, PS Peak Read Period to Annual Avg Peaking Factor Estimated Daily Peaking Factor (Peak period/annual avg peak factor x 1.3) Estimated Peak Day's Flow - GPD (Average daily flow x estimated daily peaking factor) 28, ,038 4,790 Projected 2-Year Additional EDUs* Estimated Avg Flow per EDU (GPD)** Estimated Additional Avg Daily Flow from New EDUs through next 2-yrs (Additional EDUs x flow per EDU) Projected Avg Daily PS Flow thru 2017 (2015 Avg daily flow + avg flow from new EDUs) 8,607 99,944 1,683 Est. Peak Flow from New EDUs (GPD) (New EDUs flow x peaking factor) 1,975 2, Projected 2-Year Peak Daily PS Flow (peak day flow + new EDU peak day flow) 30, ,353 5,754 *No additional connections are in the current planning stages. Two (2) additional EDUs per station per year have used in the calculations for Emerald Estates and the Industrial Park PS and one (1) EDU for the Industrial Park South PS to provide for possible growth during the two year plannig period. **GPD per EDU values are based upon five year average flow per EDU recorded for the WWTP
34 2015 Municipal Authority of the Ebensburg Municipal Authority Wastewater Pump Stations - Runtime Summaries Date 1/8 1/23 2/11 2/25 3/13 3/30 4/6 5/8 5/22 5/28 6/4 6/12 6/22 6/29 7/6 7/14 7/23 7/28 8/6 8/9 8/13 8/22 8/29 9/3 9/19 10/1 10/12 10/22 11/4 11/12 11/23 12/2 12/7 12/21 12/31 Annual Totals Emerald Estates #1 Hr Mtr Emerald Estates #2 Hr Mtr Emerald Estates #1 runtime hrs Emerald Estates #2 run time hrs Total PS Runtime Hours Total Annual PS Run Time Hours Days in read period Total Days in read period Avg run time hours/day Avg daily run time 1.43 Max Avg Daily Run Time 2.69 Peaking Factor - Max to Average Date 1/8 1/23 2/11 2/25 3/13 3/30 4/6 5/8 5/22 5/28 6/4 6/12 6/19 6/26 6/29 7/10 7/17 7/24 8/7 8/21 8/30 9/13 9/19 10/4 10/12 10/26 11/9 11/12 11/18 11/23 12/2 12/9 12/21 12/24 12/27 12/28 12/30 Industrial Park #1 Hr Mtr Industrial Park #2 Hr Mtr Industrial Park #1 runtime hrs Industrial Park #2 runtime hrs Total PS Runtime Hours Total Annual PS Run Time Hours Days in read period Total Days in read period Avg run time hours/day Avg daily run time Max Avg Daily Run Time 3.16 Peaking Factor - Max to Average 1/8 1/23 2/11 2/25 3/13 3/30 4/6 5/8 5/22 5/28 6/4 6/12 6/19 6/26 7/10 7/17 7/24 8/7 8/15 8/21 8/30 9/13 9/19 10/4 10/12 10/26 11/9 11/23 12/2 1/15 Indust. Park South #1 hr mtr Indust. Park South #2 hr mtr Indust Park South #1 runtime hrs Indust Park South #2 runtime hrs Total Run Hours Total Annual PS Run Time Hours Days in read period Total Days in read period** Avg run time hours/day Avg daily run time 0.53 Max Avg Daily Run Time 2.63 Peaking Factor - Max to Average
35
36
37
38
39
40
41
42
43
44

45
46
47

48
49
50

51
52
53

54
55
56

57
58
59

60
61
62

63
64
65

66
67
68

69
70
71
72
73
74

75
76
77

78