THE SUSTAINABLE GROUNDWATER MANAGEMENT ACT OF 2014 SGMA
|
|
|
- Luke Hart
- 5 years ago
- Views:
Transcription
1 THE SUSTAINABLE GROUNDWATER MANAGEMENT ACT OF 2014 SGMA
2 .
3
4 CHOWCHILLA SUBBASIN FOUR LOCAL AGENCIES FORMED GSAs Chowchilla Water District Madera County Merced County Triangle T Water District
5 CHOWCHILLA SUBBASIN Formed GSP Advisory Committee GSAs are working together to prepare GSP Received $1.5M grant to prepare GSP Selected Davids Engineering to prepare GSP
6 ESSENTIAL PROVISIONS Local Agencies create Groundwater Sustainability Agencies (GSAs) GSAs Adopt Groundwater Sustainability Plans (GSPs) Mandatory for High and Medium Priority Basins
7 KEY FEATURES OF SGMA Management by local agencies Robust stakeholder involvement Defined objectives Sustainability New tools and authorities for local agencies 20-year timeframe to become sustainable Defined roles for Department of Water Resources and State Water Resources Control Board
8 TECHNICAL COMMITTEE PRESENTATION.
9 Sustainable Groundwater Management Act Chowchilla Subbasin GSP Advisory Committee Special Meeting 12:00 p.m. December 5, 2018 Portuguese Hall Chowchilla, CA
10 Meeting Objectives Review SGMA requirements Review HCM and Groundwater Conditions Review subbasin overdraft estimate Present GSA-specific conditions and solutions Discuss impacts to individual landowners
11 Chowchilla Subbasin: 4 GSAs 1 GSP
12 SGMA Requirements Adopt and submit a Groundwater Sustainability Plan (GSP) by January 31, 2020 Sustainable groundwater management means the management and use of groundwater in a manner that can be maintained without causing undesirable results. [CWC 10721(v)] Sustainable groundwater management must be occurring by 2040 for the entire subbasin Today through 2039 focus on implementation, with undesirable results likely to continue 2040 and beyond must be sustainable, with no undesirable results
 Where Undesirable Results means one or more of the following effects caused by")
![groundwater conditions occurring throughout the basin [CWC 10721(x)]: (1) Chronic](/docs-images/92/109672721/images/13-1.jpg "lowering of groundwater levels (2) Significant and unreasonable reduction of")
 Significant and")
13 SGMA Requirements (cont.) Where Undesirable Results means one or more of the following effects caused by groundwater conditions occurring throughout the basin [CWC 10721(x)]: (1) Chronic lowering of groundwater levels (2) Significant and unreasonable reduction of groundwater storage (3) Significant and unreasonable seawater intrusion (4) Significant and unreasonable degraded water quality (5) Significant and unreasonable land subsidence (6) Depletions of interconnected surface water

14 14 Hydrogeologic Conceptual Model to represent the Chowchilla Subbasin
 Components Surficial")


15 15 Hydrogeologic Conceptual Model (HCM) Components Surficial Soils Subsurface Geology o Lateral and Vertical Extent of Subbasin Aquifer Properties Groundwater Data Inputs Water Levels/Storage Change Subsidence Water Quality Groundwater-Surface Water Interaction
16 Chowchilla Subbasin Review Initial Overdraft Estimates 16
17 Total = ~ 146,000 ac Irrigated Lands (2015) = ~ 123,000 ac 17
18 Chowchilla Subbasin consumptive use [a.k.a. Evapotranspiration of Applied Water (ETAW)] Irrigated ag dominates Significant shift in crop types Average ETAW has increased 1989 = 1.97 af/ac 2015 = 2.66 af/ac Urban use is minor City of Chowchilla ~2,500 af/yr Rural residential ~ 7,200 af/yr Land Use Crop Area (acres) Citrus and Subtropical Corn 10,439 18,117 Grain and Hay Crops 4,590 5,805 Grapes 8,023 10,934 Idle 19,511 1,085 Miscellaneous Field, Truck, Deciduous 26,964 5,358 Almonds 12,337 53,489 Pistachios 1,970 9,041 Walnuts Pasture and Alfalfa 35,012 19,435 Total 119, ,350
19 Chowchilla Subbasin water sources to meet ETAW Surface water brought into subbasin Significant CWD contracts and rights Other GSA water rights/contracts (e.g. Sierra Vista, Triangle T, riparian) Periodic diversion of flood flows Portion routinely seeps/percolates to groundwater Groundwater in subbasin Native groundwater from percolating rainfall and storm water seepage Previously seeped and percolated surface water 19
20 Simplified Groundwater Condition (2015 Land Use) 350,000 Average Annual Volume, (Acre-feet) 300, , , , ,000 50, , ,400 Extraction Groundwater Recharge 0 Groundwater Extraction Groundwater Recharge + Overdraft DRAFT PRELIMINARY ANALYSIS AND RESULTS TO BE REFINED AS GROUNDWATER SUSTAINABILITY PLAN DEVELOPMENT PROCEEDS 20
21 Simplified Groundwater Condition (2015 Land Use) 350,000 Average Annual Volume, (Acre-feet) 300, , , , ,000 50, , , ,400 Estimated overdraft including lateral inflow from other subbasins Extraction Groundwater Recharge 0 Groundwater Extraction Groundwater Recharge + Overdraft DRAFT PRELIMINARY ANALYSIS AND RESULTS TO BE REFINED AS GROUNDWATER SUSTAINABILITY PLAN DEVELOPMENT PROCEEDS 21
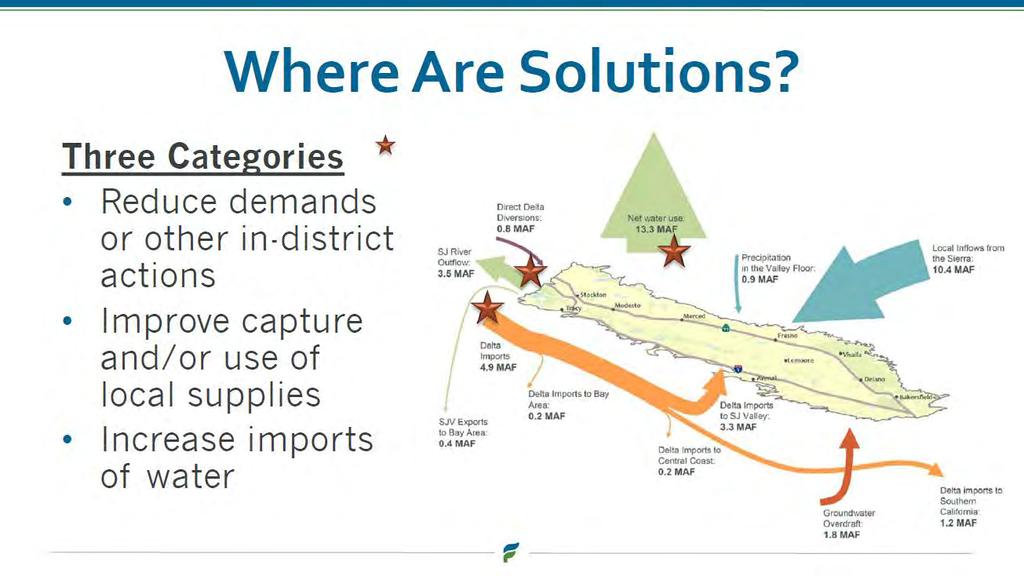
22 We must solve this ourselves [or face potential SWRCB intervention] We define undesirable results that will not be exceeded Use groundwater elevations as a proxy for all six undesirable results Set objectives and minimums that can vary across the basin We define opportunities to augment supplies Bring in more surface water Enhanced use of existing surface water sources We define how/where to reduce consumption Use groundwater allocations transitioned over time Incentive to reduce overall consumptive use 22
23 While we are in this together, the 4 GSAs differ on historic shortfall conditions, and on options to resolve groundwater shortage GSAs and even individual parcels may have different options available to them The distribution of costs and benefits from projects and management actions is not uniform across the subbasin A combination of projects and management actions can be evaluated by considering costs, feasibility (technical and economic), and fairness. 23
24 Use native groundwater as a starting point for Sustainable Yield Native groundwater is estimated as the combination of percolating rainfall and stormwater seepage For purposes of exploring solutions, each acre in each GSA boundary is provided 0.5 af/ac/yr of Native Groundwater All 4 GSAs share equally in the availability of native groundwater Each GSA may have other water supplies that contribute to Sustainable Yield
25 Madera County GSA Water Budgets East and West subareas Conditions and Initial Solutions 25

26 Madera County East subarea Total = ~11,400 ac Irrigated = ~7,500 ac 26
27 99% of Madera County East s 2015 ETAW is from irrigated agriculture Irrigated Agriculture = 19,350 acre-feet Rural residential = 190 acre-feet Total = 19,540 acre-feet Current average consumptive use (ETAW) (ETAW) = 2.58 acre-feet/ac 27
28 Average Groundwater Balance (2015 Land Use) 25,000 Average Annual Volume, (Acre-feet) 20,000 15,000 10,000 5,000 Average Annual Extraction ~ 23,600 AF Average Annual Recharge ~ 7,900 AF Madera GSA - East subarea Current shortfall: ~ 15,700 af/year 0 Groundwater Extraction Groundwater Recharge DRAFT PRELIMINARY ANALYSIS AND RESULTS TO BE REFINED AS GROUNDWATER SUSTAINABILITY PLAN DEVELOPMENT PROCEEDS 28

29 Madera County West subarea Total = ~31,200 ac Irrigated = ~27,400 ac 29
30 99% of Madera County West s 2015 ETAW is from irrigated agriculture Irrigated Agriculture = 62,500 acre-feet Rural residential = 700 acre-feet Total = 63,200 acre-feet Current average consumptive use (ETAW) (ETAW) = 2.28 acre-feet/ac 30
31 Average Groundwater Balance (2015 Land Use) 90,000 Average Annual Volume, (Acre-feet) 80,000 70,000 60,000 50,000 40,000 30,000 20,000 10,000 Average Annual Extraction = 82,400 AF Average Annual Recharge = 38,200 AF Madera GSA - West subarea Current shortfall: ~ 44,200 af/year 0 Groundwater Extraction Groundwater Recharge DRAFT PRELIMINARY ANALYSIS AND RESULTS TO BE REFINED AS GROUNDWATER SUSTAINABILITY PLAN DEVELOPMENT PROCEEDS 31
32 What is being planned by the Madera County GSA to close this deficit by 2040? Water Supply Projects/Programs Augment supplies Flood flows (limited) Purchase from others Build recharge projects On-farm and dedicated Participate with others: Work with Chowchilla WD and Triangle T where feasible Demand Management Create conservation easements Establish groundwater allocations Create market for allocations Charge extraction fees Temporary continued use of existing stored groundwater Establish potential mitigation for dry domestic wells (County GSA area only) 32

33 What might this look like in detail? Recharge projects Planning for avg of 2,000 to 10,000 af/yr Competitive and expensive Incremental reduction from current consumptive use Transition from current per-acre use Coordinated with other projects Continued use of stored groundwater (lowering levels) Initially ~ 43,000 af/yr in west subarea ~ 12,000 af/yr in east subarea Lowering as consumptive use reduction is implemented 33
34 As a landowner in the Madera County GSA, how much can I pump? By 2040 and beyond, may be limited to consuming no more than 0.5 af/ac Pumping quantities will depend on efficiency and deep percolation of pumped groundwater County is working on ways to transition from current pumping to sustainable levels Trading and credit systems can allow more water per acre Continued use of existing stored groundwater can help, but will lower groundwater levels in many areas 34
35 What does this mean to me as a landowner in the Madera County GSA? Developing recharge projects to help augment natural groundwater where economically feasible Transitioning to much lower total consumptive use, possibly through allocations, incentives, or charges Continued lowering of groundwater levels before stabilizing Increasing groundwater regulations and reporting Participating in groundwater market 35
36 Chowchilla WD GSA Conditions and Initial Solutions 36
37 Chowchilla WD GSA Total = ~85,300 ac Irrigated = ~72,400 ac 37
38 96% of Chowchilla WD s 2015 ETAW is from irrigated agriculture Irrigated Agriculture = 205,800 acre-feet Rural residential = 7,900 acre-feet Total = 213,700 acre-feet Current average consumptive use (ETAW) (ETAW) = 2.48 acre-feet/ac 38
39 Average Groundwater Balance (2015 Land Use) 160,000 Average Annual Volume, (Acre-feet) 140, , ,000 80,000 60,000 40,000 20,000 Average Annual Extraction = 150,600 AF Average Annual Recharge = 115,700 AF Current shortfall: ~ 34,900 af/year 0 Groundwater Extraction Groundwater Recharge DRAFT PRELIMINARY ANALYSIS AND RESULTS TO BE REFINED AS GROUNDWATER SUSTAINABILITY PLAN DEVELOPMENT PROCEEDS 39
40 What is being planned by the Chowchilla WD GSA to close this deficit by 2040? Water Supply Projects/Programs: acre-feet/yr Winter Flooding of Crops 9,000 Construct Groundwater Recharge Basins 11,000 Expand Capacity of Buchanan Dam 10,000 Expand Capacity of Madera Canal 6,000 Construct Merced-Chowchilla Intertie 6,000 42,000 40
41 What is being planned by the Chowchilla WD GSA to close this deficit by 2040? Demand Management Programs & Policies: Consider establishing surface water allocations in 2020 Continued use of existing stored groundwater until 2039 Implement management programs and policies over time Establish groundwater allocations within 5 to 10 years Create market for allocation trading Charge groundwater extraction fees 41
42 As a landowner in the Chowchilla WD GSA, how much can I pump? Average groundwater pumping in CWD = ~ 2.1 af/ac Safe yield in CWD = ~ 1.6 af/ac Overdraft = ~ 0.5 af/ac Overdraft will continue until water supply projects and management actions make up the difference. 42
43 What does this mean to me as a landowner in the Chowchilla WD GSA? Groundwater allocations will begin in 5 to 10 years Winter flooding of crops will allow you credits to pump more groundwater Water cost will go up as water supply projects are built Continued lowering of groundwater levels until water supply and management actions make up the difference 43
44 Triangle T WD GSA Conditions and Initial Solutions 44

45 Triangle T WD GSA Total = ~14,700 ac Irrigated = ~13,700 ac 45
46 99% of Triangle T GSA s 2015 ETAW is from irrigated agriculture Irrigated Agriculture = 34,450 acre-feet Rural residential = 150 acre-feet Total = 34,600 acre-feet Current average consumptive use (ETAW) (ETAW) = 2.5 acre-feet/ac 46
47 Average Groundwater Balance (2015 Land Use) 45,000 40,000 Average Annual Volume, (Acre-feet) 35,000 30,000 25,000 20,000 15,000 10,000 5,000 Average Annual Extraction = 40,000 AF Average Annual Recharge = 13,200 AF Current shortfall: ~ 26,800 af/year (Excluding contribution from landowner riparian diversions) 0 Groundwater Extraction Groundwater Recharge DRAFT PRELIMINARY ANALYSIS AND RESULTS TO BE REFINED AS GROUNDWATER SUSTAINABILITY PLAN DEVELOPMENT PROCEEDS 47

48 What we re doing: shallow aquifer recharge & extraction 48

49 What we re doing: building infrastructure and importing surface water
50 What we re doing and will continue to do Deep well extraction limited to less than 0.5 af/ac Import surface water Build infrastructure: Applied for an $12M OES grant with CCID (East Side Bypass flood water, surface water conveyance, shallow wells, and recharge facilities) Voluntary fallowing: Supplemental feed purchase program Create market for allocation and trading of groundwater credits Development of a groundwater extraction fee

51 Dec 2012-Dec 2013 Subsidence Rate

52 Jul 2016-Jul 2017 Subsidence Rate

53 Jul 2017-Jul 2018 Subsidence Rate 53
54 Merced County GSA/Madera County GSA Sierra Vista MWC Water Budget Subarea Conditions and Initial Solutions 54
 Total = ~3,800 ac Irrigated = ~3,400 ac 55")
55 Sierra Vista MWC (in both Merced GSA and Madera GSA) Total = ~3,800 ac Irrigated = ~3,400 ac 55
56 97% of Sierra Vista MWC s 2015 ETAW is from irrigated agriculture Irrigated Agriculture = 8,550 acre-feet Rural residential = 200 acre-feet Total = 8,750 acre-feet Current average consumptive use (ETAW) (ETAW) = 2.53 acre-feet/ac 56
57 Average Groundwater Balance (2015 Land Use) 12,000 Average Annual Volume, (Acre-feet) 10,000 8,000 6,000 4,000 2,000 Average Annual Extraction = 11,400 AF Average Annual Recharge = 4,900 AF Current shortfall: ~ 6,500 af/year 0 Groundwater Extraction Groundwater Recharge DRAFT PRELIMINARY ANALYSIS AND RESULTS TO BE REFINED AS GROUNDWATER SUSTAINABILITY PLAN DEVELOPMENT PROCEEDS 57
58 What is being Planned by Sierra Vista to close this deficit by 2040? Establish groundwater pumping allocation Water projects (surface water access) Winter flooding of crops (Management Practices) Build groundwater recharge facilities Exchange of groundwater recharge credits within SVMWC Rotational fallowing Purchase of imported surface water 58
59 As a landowner in the Sierra Vista MWC, how much can I pump? Average groundwater pumping in SVMWC = ~ 3 af/acre Safe yield in SVMWC = ~ 1.3 af/ac Overdraft = ~ 1.7 af/ac Overdraft will continue until water supply projects and management actions make up the difference 59
60 What does this mean to me as a landowner in the Sierra Vista MWC? Cooperation within SVWMC is imperative in order to maintain an equitable water balance Landowners may be asked to enter into agreements with SVWMC in order to comply with potential allocations as a result of any MOU within basin Water cost will go up as water supply projects are built Winter flooding of crops will allow you credits to pump more groundwater 60
61 Summary and Engagement 61
62 Chowchilla Subbasin Summary Chowchilla subbasin PRELIMINARY overdraft estimates Historic: ~ 55,200 AF/yr (-38,600 to -71,800 AF/yr) Current: ~ 102,000 AF/yr (-71,300 to -132,500 AF/yr) Overdraft volumes vary by GSA Solutions vary by GSA 62
63 Engaging with GSAs Currently Scheduled GSA meetings Chowchilla Water District December 12, :30 pm Triangle T Water District December 13, 2018 Madera County GSA January 8, 2018 Merced County GSA as needed For more information and input
64 Discussion 64