Energy Vision: Looking Forward
|
|
|
- Brandon Stewart
- 5 years ago
- Views:
Transcription


1 Energy Vision: Looking Forward Anda Ray SVP, Energy, Environment and External Relations Forum: Climate Change, Research and Resources & Reliability University of Nebraska July 13, 2016

2 - Born in a Blackout Founded in 1973 as an independent, non-profit center for public interest energy and environmental research New York City, The Great Northeast Blackout,


3 Three Dimensions of EPRI s Value Thought Leadership Industry Expertise Collaborative Model Independent Nonprofit Collaborative 3


4 Our Members 450+ participants in more than 30 countries EPRI members generate approximately 90% of the electricity in the United States International funding of 25% of EPRI s research, development and demonstrations 4


5 Electricity Sector Yesterday s Power System Residential Bulk Power System Distribution System Commercial One Way Power Flow Industrial 5


6 Electricity 2.0 Local Resources & The Integrated Grid Generation Becomes More Flexible Consumers Become Energy Producers Two-way Flow T & D Becomes More Controllable and Resilient Loads Become More Interactive and Dynamic 6


7 Energy and Capacity 24 by 7 Electricity Supply and Demand Voltage Quality Startup Power Grid Supplied Power 7


 breakdown based on PJM")

8 Energy (Mwh) and Capacity (MW) The Cost of Grid Connected Services $14 Generation Capacity & Services $70 $56 Generation Energy $110 $37 $30 Fixed T&D Distribution Capacity $51 $59 8 $3 $10 Avg. Customer Monthly Charge Variable Transmission T&D Capacity-based Costs Generation (Energy/Fixed Cost) breakdown based on PJM market analysis (2011) T&D (Fixed/Variable) cost breakdown based on current SCE Implied Cost Estimates (source: E3) Energy-based Costs

9 Electricity and Energy 3.0 Connected The Internet of Things - Services and Devices Convenience, Comfort, Choice, Control Cost-Effectively 9

10 195 Nations Adopt First Universal Climate Agreement At COP21 Talks In Paris December 12, 2015 (left to right) UN climate chief Christiana Figueres; UN Secretary-General Ban ki-moon; French Foreign Minister and president of the COP21 meetings Laurent Fabius; French President Francois Hollande, 10
 & Measures 2.")


11 Essential Elements of the Paris Climate Agreements Should not Shall 1. Each Country/Party submits Nationally Determined Contributions (NDC) & Measures 2. Common but differentiated responsibilities and respective capabilities (Best Effort) 3. Update NDCs at common 5-year intervals toward 2050 goals 4. Establish a central project crediting mechanism (Kyoto Protocol) 5. Establish a Transparency and Accountability framework 6. 5-year Stocktaking progress on mitigation, adaptation and finance 7. Reduce Climate vulnerability and increase Climate resiliency 8. Establish a mechanism for loss and damage assessment (Warsaw Int l mechanism) 9. Developed countries committed to $100 billion/year by 2020 (public & private funds) 11


12 Energy and Emissions ENERGY: Smarter Global Demand and Use of Energy EMISSIONS: Global Focus on Economy-wide Emission Reduction Increased Energy Demand, Increased Electricity Demand, ELECTRICITY: grows faster than total energy Global Focus: Smarter Energy with Significantly Reduced Emissions 12


13 EPRI Scenario Outcomes: Global Points of View Energy and Environment Priorities Efficiency and Renewables Increase Customer Choice and Expectations Grow Connection Across the Economy Increases Innovation and Surprises Will Come 13

14 Energy Vision of the Future - Integrated Energy Network WHY? 14


15 Integrated Energy Network - Three Evolving Infrastructures Using Cleaner Energy and Electrification Integrated Energy Network Producing Cleaner Energy Integrating Energy Resources A Network of Infrastructures that connects customers with clean energy production and use 15

16 A Look Ahead - I. Producing Cleaner Energy Using Cleaner Energy Reducing emissions from the production of electricity and other forms of energy Producing Cleaner Energy Integrating Energy Resources 16


17 Transition to Cleaner Electricity Generation ~2030 Renewables Distributed Energy Resources Ultra Supercritical Renewable Growth will be Global Pace and Scale of Nuclear, Coal and Natural Gas will vary from Region to Region Natural Gas Nuclear 17


 Coal and Gas Carbon")


18 Pathway to Cleaner Electricity/Energy Generation ~2050 Generation IV Nuclear (co-production electricity, hydrogen steam) Large-Scale Storage Advanced Power Cycles (e.g., Supercritical CO 2 Cycle) Coal and Gas Carbon Capture and Sequestration Technology innovation in the next decade will be key to ensure all options for cleaner energy production are available in the long term High Altitude/Power Wind Gen III Photovoltaic (PV) 18
19 A Look Ahead II. Using Cleaner Energy Using Cleaner Energy Electrification Enables other Sectors of the Economy to Decarbonize Producing Cleaner Energy Integrating Energy Resources 19
20 Billions Tons CO 2 eq. U.S. Economy-wide Emissions Example Scenario CH 4, N 2 O, and F-gases Non-Electric Sector CO 2 Electric Sector CO % Economywide Emission Reduction Source: US-REGEN data; Energy Modeling Forum 24 20
21 Clean Electricity Enables Economy-wide Emission Reduction Direct Emissions Global Economy-wide Emission Indirect CO 2 Emissions Electricity and Heat Generation 25% Energy 1.4% * AFOLU 24% Buildings 6.4% Transport 14% 49 Gt CO 2 eq (2010) Industry 11% Transport 0.3% Buildings 12% Industry 21% Other Energy 9.6% * AFOLU 9.6% Cleaner electricity: Reduces indirect emission and direct emissions Enables production of other clean energy to further emissions 21 Source: Contribution of Working Group III to the Fifth Assessment Report of IPCC, Pg. 9. * Agriculture, Forestry and Other Land Use (AFOLU)


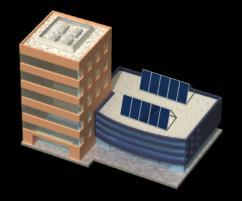
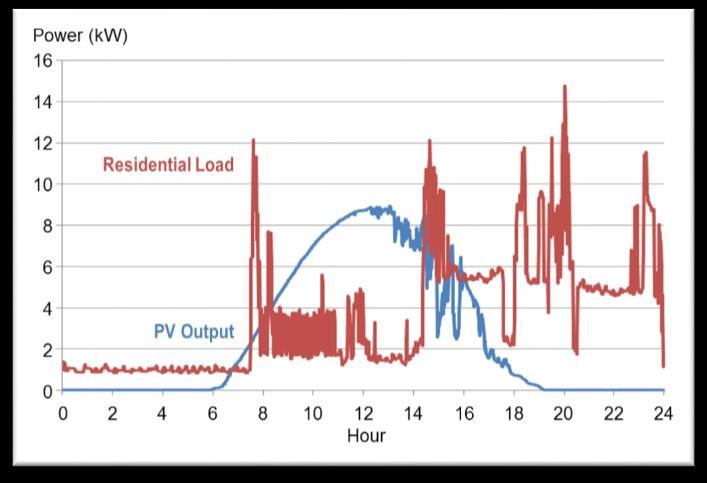
22 Using Cleaner Energy One Example of Efficiency and Electrification to Reduce Emission Single-Family Home Energy Efficiency Improvements Heat Pump Replaces Gas Furnace PHEV/EV Replaces Mid-Size Car 22


23 Transition to Using Cleaner Energy ~2030 Electric Vehicles Advanced Energy Communities Industrial Processes Rail Electrification Heat Pumps 23


24 Pathway of Cleaner Energy Use ~2050 Hydrogen Stations Hydrogen Transportation Electrification Teleheating Bioenergy Indoor Agriculture Advanced Manufacturing 24
25 Quad Btus EXAMPLE: Assume U.S. 70% Emission Reduction by 2050 Example Scenario Final Energy Other Oil Gas Elec 4757 TWh 43% Increase in Electricity 43% Increase use in Compared Electric to Reference Consumption Case Compared to Oil Gas Elec 6804 TWh Reference Low-Carbon Reference Reference Low-Carbon Billion tons CO CO 2 Emissions (From Final Energy and Electric Generation) CO 2 Oil CO 2 CO 2 Gas Elec 70% 70% Decrease Decrease in in Economywide Economywide CO CO 2 Emissions 2 Emissions Compared Compared to to Reference Reference Case Case Efficiency and Electrification Key to Emission Reduction 25


26 Annual CO2 Emissions, lbs The Gift that Keeps on Giving Electrification 14,000 12,000 10,000 8,000 EXAMPLE: Carbon Footprint: Heat Pump Heating 6,000 4,000 92% eff. Gas Furnace 2, Carbon Intensity of Delivered Electricity, lbs/kwh 26
27 A Look Ahead - III. Integrating Energy Resources Using Cleaner Energy The Integration of Electrons, Molecules and Bytes Producing Cleaner Energy Integrating Energy Resources 27


28 Courtesy of AEP Courtesy of Ecobee Courtesy of Chevron Courtesy of Eurelectric Courtesy of GE Enabling a Transition: Integrating Cleaner Energy Transmission Flexible Resources Smart Distribution 28


29 Integrating Energy Resources Electricity, Gas, Water, Telecommunications, Customer Local Energy Networks Providing Cost Effective Choice and Control with Increased Convenience and Comfort 29


30 Integrated Electric Grid: Enables Electricity and Transportation Interface National Charging Infrastructure Deployment >$1B US of utility-owned/operated infrastructure Utility web portal data access and analytics, billing interface Electricity Grid-to-Vehicle Interface Time-of-Use rates and Demand Response signals EV batteries: grid optimization High Power Fast Charging Infrastructure 150 kw / 350 kw leads to ~1.5 MW / 3.5 MW per gas station Value of the Grid: Electricity to Cleaner Transportation 30


31 Increasing Interface: Electricity, Gas and Water Infrastructure Natural Gas and Electricity Pipeline and gas compression/electric generation station Electric/gas markets Power to gas (H 2 ) and gas to power (fuel cell) Water and Electricity and Energy Water for electricity and electricity for water transportation Electricity for water treatment, e.g., desalination Electrotechnology for reducing water use, e.g., microwave drying Value of the Grid: Electricity to Cleaner Gas and Integrated Water Infrastructure 31


32 Integrated Grid Enables Local Energy Grid Heating Combined Heat and Power Teleheating Heat Pump Efficient and Connected Buildings Building Automation Systems Smart Lighting Smart Appliances HVAC EV Charging Stations Smart Water Use Connected Appliances Energy Use & Production Grid supplied electricity/steam/gas Storage Battery Thermal Storage Power Conditioning Building Envelopes Water Heating Local Network to produce electricity/steam/gas Increasingly Clean Energy will be Produced and Used Locally 32


33 Vision of a Low Carbon Future Consumers Driving Change Integration of All Energy Sources Enabled by the Integrated Electric Grid and Common Communication Protocols Electrification Enables Other Economy Sectors to Decarbonize 33

34 Together Shaping the Future of Electricity 34