Jamie Shipley Senior Advisor Ontario Region Research and Information Transfer
|
|
|
- Arabella Ross
- 5 years ago
- Views:
Transcription


1 Jamie Shipley Senior Advisor Ontario Region Research and Information Transfer

2 CMHC s EQuilibrium Initiative EQuilibrium is a national residential designbuild- demonstration initiative to challenge builders and developers across Canada to act as environmental stewards by: Designing low-impact affordable, healthy, highly energy and resource efficient housing

3 EQuilibrium TM Housing Principles Core Principles Health Energy Resources Environment Affordability SOCIÉTÉ CANADIENNE CANADA MORTGAGE D HYPOTHÈQUES AND HOUSING CORPORATION ET DE LOGEMENT


4 CMHC s EQuilibrium TM Sustainable Housing Demonstration Initiative Vision Uses readily available technologies Aims to reduce the homeowner s need for energy Can be applied to a variety of housing models Build interest and capacity Solar hot water collectors Slab hot water radiant heat distribution system Photovoltaic roofing tiles

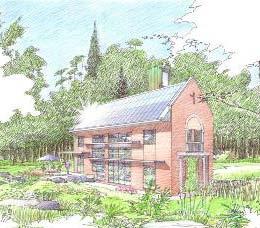
5 Features of an EQuilibrium TM House Connected to the utility grid Can access additional energy Can sell energy production surplus Inspiration the Minto ecohome Ottawa, ON

6 Benefits Homeowner benefits: Lower utility bills Healthier space Avalon Discovery 3 Red Deer, AB Reliable power Greener choice for the environment A better future

7 Benefits Builder benefits: Establish a reputation Meet the needs of Canadians

8 Benefits Community benefits: Reduction of infrastructure Reduction of costs Healthy & liveable communities Land, water and habitat conservation Protection of existing ecosystems


9 CMHC EQuilibrium TM Demonstration Projects
10 Targeted Performance Proposed by the Teams Total Annual Energy Profile Total Annual Energy Profile 300 Energy (kwh/m 2 ) Interior Lighting Other Appliances Major Appliances Water Heating Space Heating 0 National Average National Average R-2000 EQuilibrium R-2000 House EQuilibrium Home
11 Targeted Performance Proposed by the Teams Estimated Average for the 15 Homes Building envelope EnerGuide* rating 86 Total energy modified EnerGuide* rating 99 Ceiling insulation level R65/ RSI 11 Wall insulation level R52/ RSI 9 Target air tightness 0.75 air changes/h@50pa Floor area 172m 2 (1850pi 2 ) *EnerGuide is an energy rating system for houses developed for Natural Resources Canada where a score of 100 = net zero energy house
12 What is Net-Zero Energy Housing? A home that generates an equal amount of energy as it consumes on an annual basics. Computer modeled Hot2000 Retscreen New software coming.


13 Strategy for Net Zero 1. Conserve Energy 1. Improve building envelope Recover Energy Ventilation & water Generate Energy Passive solar gain Active solar gain Ground source Wind Air Leakage Test
14 Lessons Learned


15 Messages from the builders.. It can get expensive Net Zero Energy Ready Conservation is key Building envelope must be good. Passive solar is free Keep it simple

16 The ÉcoTerraTM design team calculated the annual gross space heating load to be 77 GJ (21,400 kwh) using HOT2000. Usable passive solar gains are expected to meet 44% of the heating load, and internal gains 17.4%. The space heating system is therefore expected to only have to deliver 29.6 GJ/yr (8,200 kwh/yr), a reduction of 13,200 kwh.
17 Lessons from Riverdale Green Features Impact on Cost Energy Bill 85% Better insulation, windows, heating systems, $18K appliances, passive solar design Solar panels for hot water and indoor heat 95% + $36K Solar panels for electricity 100% + $54K TOTAL $106K Source: slide 24,
18 Lessons from Riverdale $106,000 in costs to reduce home energy bills by 100% (out of reach for most homeowners) BUT only $18,000 in costs to reduce home energy bills by 85% (the final 15% is what costs so much) Source: slide 24,


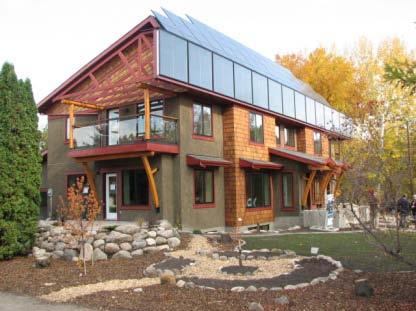
19 Riverdale and market demand Mill Creek Net Zero Home Edmonton, AB


20 What have we found? EQ houses are performing well, not perfectly, but well Householders use more electricity than predicted by developers and energy modellers PV output meets predictions in summer but is less than predicted in winter
21 What have we found? Snow exists Complicated systems can lead to oversights Simple monitoring does not allow for complex analysis
22 Are we there yet? We have a full year of monitoring on one house, and almost complete data on two more Have we reached the elusive net-zero goal?

23 Avalon Discovery 3
24 Energy usage by different Canadian houses 250 Note: Avalon and Factor 9 are net energy usage (energy used energy generated) 200 Annual kwh/m² Mean Canadian single family R-2000 sample (1995) Dumont house Factor 9 (with solar thermal) Avalon (with solar thermal but not PV) Avalon (PV included)
25 PV output: predicted vs measured Predictions generally made using RETScreen Many assumptions in that process Measured PV output is generally close in summer but lower in the darker six months Shading, snow effects are contributing factors

26 ÉcoTerra TM

27 Avalon Discovery 3 (July 2009 June 2010)

28 Riverdale West

29 Riverdale

30 During the past 31 days the house consumed 1810 kwh and produced only 152 kwh. OUCH!
31 Saturday = 2 KWh


32 January 20, 2011
33

34 January 27, 2011

35
36

37 January 31, 2011
38
39 350 KWh x $ 0.82 = $287
40
41 Compare PV output of Avalon and CHESS Predicted outputs correlated with their installed capacity: Avalon annual PV energy predicted to be ,563 kwh (calculations by different contractors) from an 8.2 kw system or kwh/kw CHESS annual PV production predicted to be 8300 kwh for a 6.7 kw system or 1240 kwh/kw, which is more or less the same as Avalon when you take out approximations and rounding NRCan predicts 1265 kwh/kw for a Red Deer location and ideal slope


42 Avalon Discovery 3 March 21 st shadow patterns


43 Shading study seems accurate for Avalon

44 CHESS system has no shading
45 PV output: Predicted vs measured (cont.) From January 2010 through mid-july: Avalon with an 8.2 kw system produced about 5600 kwh CHESS with a 6.7 kw system produced about 6000 kwh Predictive programs could not deal with the subtleties of shading
46 Actual electrical consumption larger than predicted Predictions were biased low to meet net zero targets and to avoid more expensive PV capacity Homeowners are not necessarily being as energy efficient as predicted Monitoring equipment loads will also be a factor in some cases
47 Modelling Electrical Consumption Internal use: 1.0 kwh/day 365 Lighting: 3.0 kwh/day (1,095 kwh/year) Appliances: 9.0 kwh/day (3,285 kwh/year) Other: 8.0 kwh/day (2,920 kwh/year) External use: All: 4.0 kwh/day (1,460 kwh/year) Includes clothes dyer (140 litres) External & garage lighting, openers, well pumps Total: 24.0 kwh/day (8,760 kwh/year)
48 Modelling Appliances Refrigerator: 440 litres (15.5 ft3) kwh/year Stove: 4 burners; 60 litres oven kwh/year Clothes washer: tub 60 litres kwh/year Freezer: 283 litres (10 ft3) kwh/year Dishwasher: 150 litres volume kwh/year Total: 3,285 kwh/year EnerGuide Appliance Directory published by Natural Resources Canada
49 Base load reductions for Other uses Electricity use for other uses includes microwave ovens, small appliances, TVs, stereos, computers, and all other plug loads. (8.0KWh/day) The design team may reduce these to a minimum of 3.0 kwh/day, providing a technical justification for doing so.


50 Electrical consumption for lights and appliances Predicted Measured Extrapolated from data
51 Complex systems can lead to errors or oversights If it isn t easy, errors are more common Electrician shut down PV output in Now House while installing sensors and forgot to turn it back on. Several weeks of production were lost. Solar thermal systems do not appear to be providing as much energy as predicted Even solar DHW is often far below predicted production Storage tank mix-ups have affected energy usage in at least two houses

52 Riverdale

53 Minto
54 Simple monitoring CMHC chose to do simple, monthly monitoring in the EQ houses Lower cost to install and analyze Lower burden on homeowner (less equipment in view) Low to no energy usage by monitoring system to affect the energy balance Fewer electronic glitches
55 Simple monitoring (cont.) This simplicity has its drawbacks Consultant visiting the site may miss a month here or there Harder to account for performance deviations in complicated equipment Lacks instantaneity of electronicallydispatched data
56 Airtightness targets All EQ houses were predicted to be very airtight E.g. in a range that runs from Passivhaus (0.6 Pa) to R-2000 (1.5 Pa) Actual tests show that some have met targets and some houses have more air leakage than anticipated All those tested so far are quite airtight

57 Airtightness test data Predicted airtightness range for EQ houses Pa
58 What s Next Air quality testing results. More detailed energy monitoring results/conclusions EQuilibrium insights into specific aspects of the homes. EQuilibrium Communities Thank You