Issues in Biomass Thermal An Overview
|
|
|
- Charles Moody
- 5 years ago
- Views:
Transcription

1 Issues in Biomass Thermal An Overview Eric Kingsley Innovative Natural Resource Solutions LLC With additional materials and presented by Dr. William Strauss FutureMetrics, LLC Prepared for the US Endowment for Forests & Communities / USDA Forest Service Wood to Energy Across the Northern Tier and Beyond January 12, 2012 Manchester, New Hampshire

2 Why should we care about renewable energy? 2

3 United States Energy Policy 3
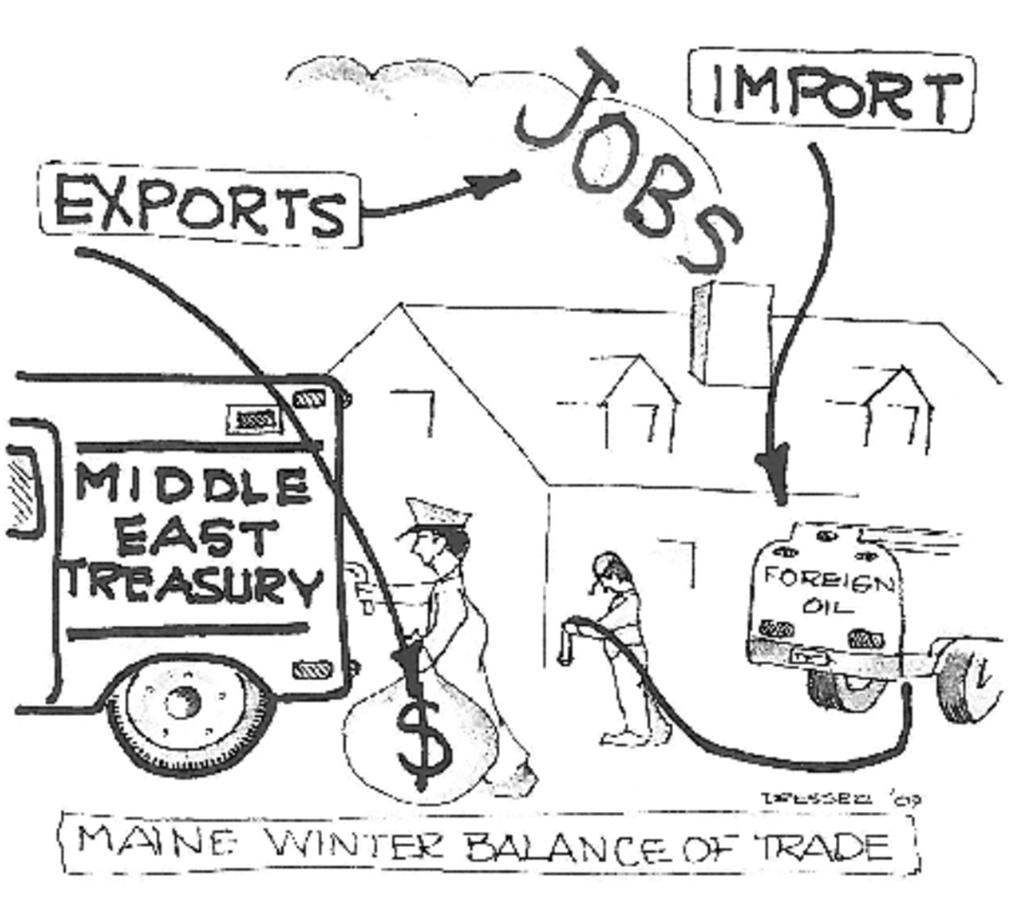
4 At current heating oil prices, the NE states export more than 20 BILLION dollars per year* Number of Households that use Heating Oil Average Gallons Used per Year by all Users Average Total Expenditure Per Year (#2 at $3.65/gal) Amount that Does not Stay in the State (EXPORTED) Connecticut 873, ,225,000 $ 2,628,821,250 $ 2,050,481,000 Maine 418, ,200,000 $ 1,373,130,000 $ 1,071,041,000 Massachusetts 1,110, ,750,000 $ 3,342,487,500 $ 2,607,140,000 New Hampshire 409, ,100,000 $ 1,343,565,000 $ 1,047,981,000 New York 3,275,000 2,947,500,000 $ 10,758,375,000 8,391,533,000 Pennsylvania 1,837,000 1,377,750,000 $ 5,028,787,500 3,922,454,000 Rhode Island 208, ,400,000 $ 607,360, ,741,000 Vermont 201, ,900,000 $ 660,285,000 $ 515,022,000 Total 8,331,000 7,052,825,000 $ 25,742,811,250 $ 20,079,393,000 Source: US Energy Information Administration, 2010, US Census, analysis by FutureMetrics *The US EIA data shows that 78% of every dollar spent on heating oil leaves the region and most of those dollars leave the country. 4
5 At current heating oil prices, about ONE MILLION jobs are destroyed as money is drained from those states economies and sent to other places. #2 Distillate Fuel use in Residential, Commercial, and Industrial (not Transportation) Average Gallons per Year Money Exported from Regional Economy at $3.65/gal Permanent Job Destruction Connecticut 720,225,000 ($2,050,480,575) -98,300 Maine 376,200,000 ($1,071,041,400) -64,189 Massachusetts 915,750,000 ($2,607,140,250) -133,194 New Hampshire 368,100,000 ($1,047,980,700) -58,773 New York 2,947,500,000 ($8,391,532,500) -415,023 Pennsylvania 1,377,750,000 ($3,922,454,250) -198,084 Rhode Island 166,400,000 ($473,740,800) -23,575 Vermont 180,900,000 ($515,022,300) -30,219 7,052,825,000 ($20,079,392,775) -1,021,357 analysis by FutureMetrics 5
6 6
7 Biomass Thermal Using wood to meet space heat and process heat needs a highly efficient use of wood fuels Long established practice in forest products industry; is cordwood and chips now moving beyond (pellets, densified wood, torrefaction) Residential, commercial, institutional, industrial National Fuels for Schools Program New business models emerging An area with major growth potential Real issues with emissions, particularly PM Fuel specifications / delivery requirements often more restrictive than biomass electric (no secondary screening)
8 Biomass Thermal Fuels Tend to be modest volumes Price takers, not market makers Can utilize infrastructure built to serve others (e.g. pulp mills or biomass electric) Can have specialized delivery requirements Self-unloading trucks, high fuel spec No single source for biomass fuel information developing industry Can be forest-derived, sawmill residue, urban wood, processed fuel (e.g., pellets), etc.

9
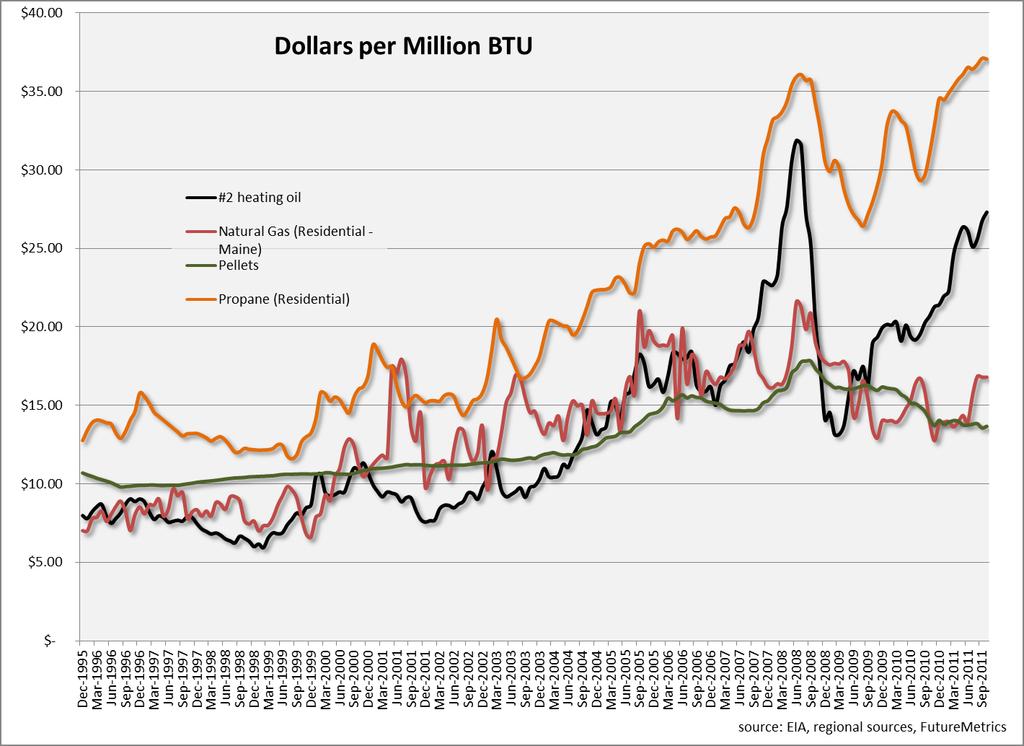
10 Biomass Thermal Beats Oil On a BTU basis, biomass thermal competes well with oil (and propane and even reesidential natural gas!) The following charts show wood pellets as a cost-effective alternative to traditional fuels; the savings can be even greater for chips Often the barrier to biomass thermal use is capital the expense associated with putting in a new boiler or other heating system
11

12
13 $14.00 Wood Pellets Provide Cost Savings Compared to Home Heating Oil Cost Savings per MMBTU $12.00 $10.00 $8.00 $6.00 $4.00 $2.00 $- $(2.00)
14 Modern Wood Pellet Boilers are CLEAN and completely automatic 14


15 To put this into perspective, let s compare using one cord of wood in a fireplace and one cord of wood s worth of energy from wood pellets in a modern pellet boiler. 375 pounds Particulate emissions (SMOKE!) 0.28 pound 15
16 Biomass Thermal Geography The following maps show Percent of homes using oil as a primary heating source Homes with oil or propane as primary heat per square mile (for bulk delivery economics)

17 Percent of Homes Using Oil as a Primary Heat Source

18 Homes with Oil or Propane as Primary Heat Source Units per Square Mile
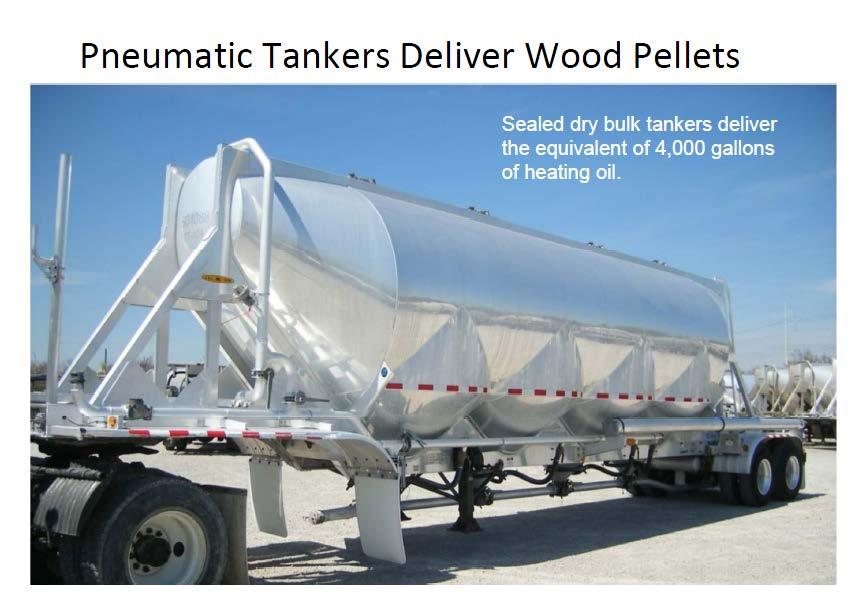
19 Pellets are Simple Way to Access and Use Biomass Fuel Heating options include boilers (whole home) and stoves (supplemental heat) Moving from residential to commercial and larger applications Provides a refined fuel with modest consumer involvement Potential for bulk delivery (or bagged for small scale consumers)
20 Stoves in Use (Cumulative) United States, ,000, , , , , , , , , ,000 - pre
21 Using very conservative estimates for the quantity of sustainable biomass, if we assume that each state provides biomass for its own needs, the table below shows the conversion rates. Maine is highest proportionally with 32.33% of its homes and businesses converting. New York is highest in absolute numbers with 756,000 homes and businesses converting. Occupied Households Number of Businesses Total Number of Households and Businesses Total Biomass Production per Year (green tons) Total Number Converting in each State if there is NO Interstate Transport of Pellets (based on 8 tons per user per year average) Connecticut 1,323, ,651 1,717, , % 28,400 Maine 542, , ,679 3,640, % 227,500 Massachusetts 2,449, ,537 3,179, , % 38,000 New Hampshire 501, , , , % 43,400 New York 7,907,420 2,358,783 10,266,203 12,096, % 756,000 Pennsylvania 4,877,735 1,455,028 6,332,763 6,694, % 418,400 Rhode Island 405, , , , % 10,400 Vermont 251,000 74, ,873 1,434, % 89,600 18,256,155 5,445,811 23,701,966 25,786,000 1,611,700 analysis by FutureMetrics 22
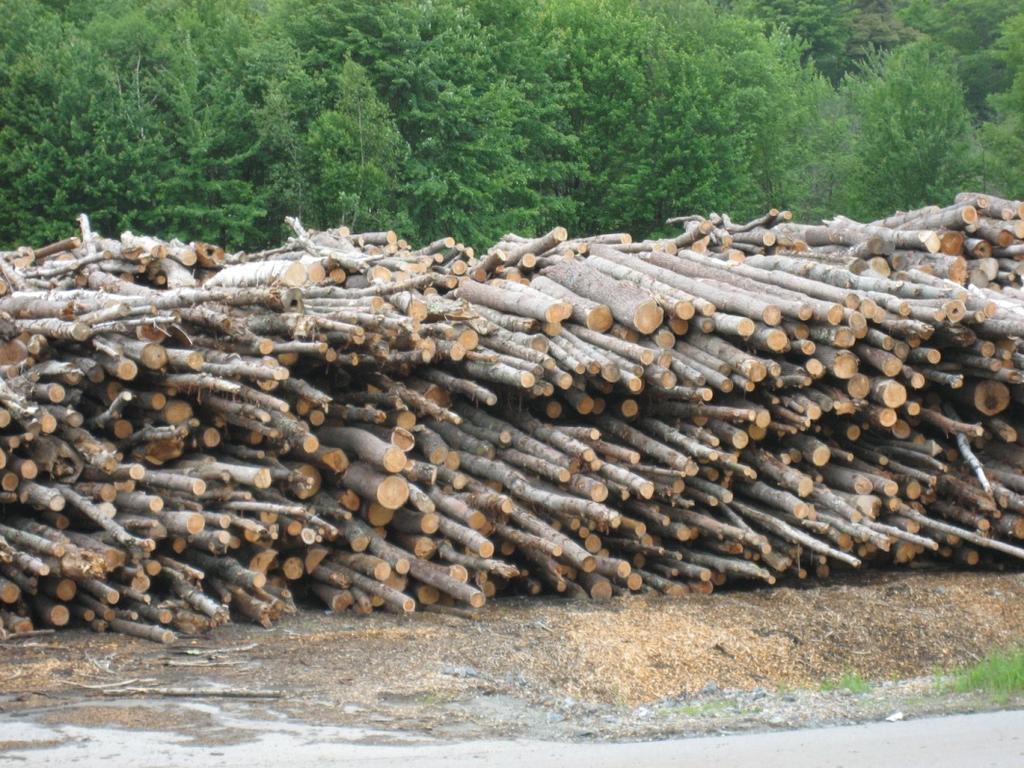
22 The biomass for fuel harvest already is more than 3 million tons per year in Maine 23
23 Maine Pulpwood Harvest is Declining 24

24 New Solutions Coming to Market This Energy Box from Maine Energy Systems can House Multiple Boilers and Bulk Pellet Storage, Providing a New Product for Schools, Mid-Size Commercial, etc.
25

26 Pellet Handling at Jackson Lab (Bar Harbor, Maine) Largest Single User of Wood Pellets in the United States
27 Biomass for electric and thermal is an important part of the New England forest economy
 Pulp")
28 Wood Pellet Biomass Biomass (idle) Pulp Mill OSB
29 Wood Use in Maine, New Hampshire, New York and Vermont ,000,000 9,000,000 8,000,000 G r e e n T o n s 7,000,000 6,000,000 5,000,000 4,000,000 3,000,000 2,000,000 ME NH VT NY 1,000,000 0 Biomass Pellets Pulp Sawmills

30 Energy Wood Use in Maine, New Hampshire, New York and Vermont ,410,000 Biomass 1,000,000 9,470,000 Wood Pellets Firewood Green Tons
31 16000 Energy Wood Use/Production in Maine, New Hampshire, New York and Vermont biomass wood pellets firewood Total
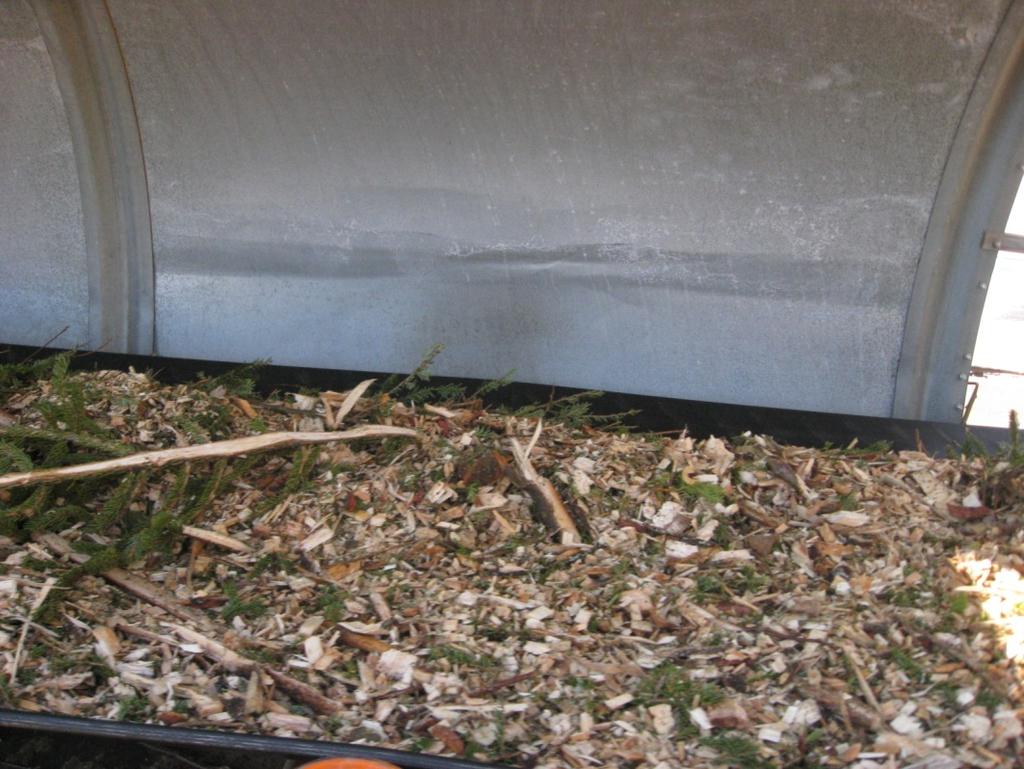
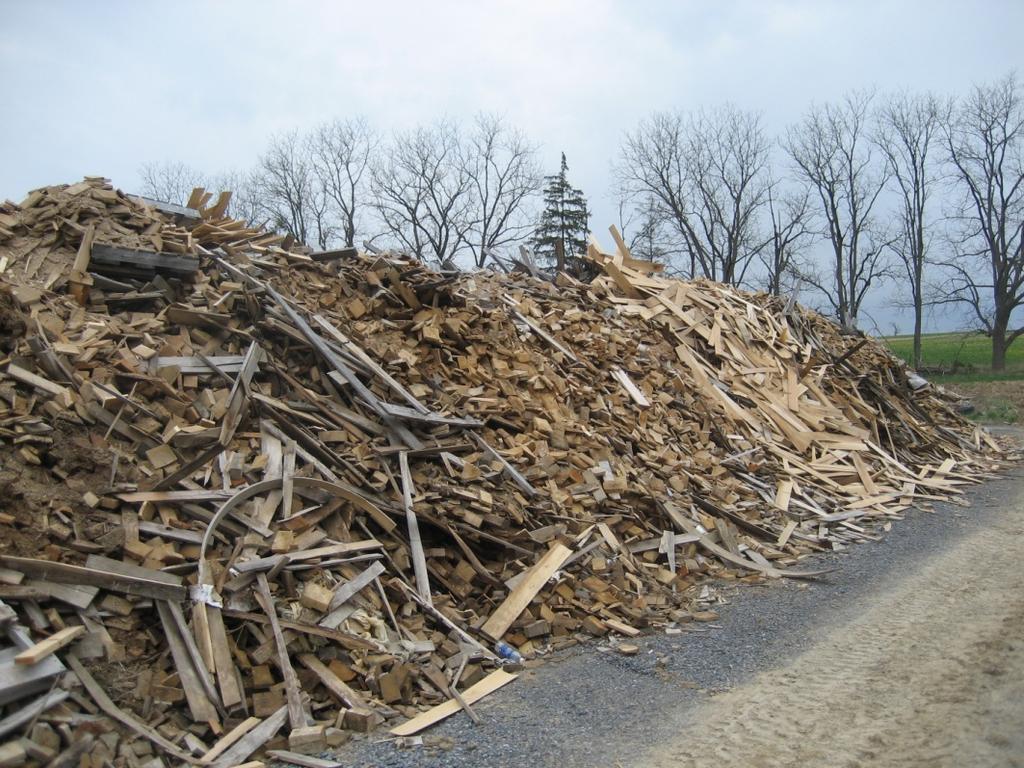
32 Biomass Chips are an Important Source of Fuel for Thermal Applications

33 Biomass Facilities in Vermont A Success Story for Community-Scale Projects
34 A case study Sweden 35
35 The smoothed trend in GDP per capita is virtually identical. 36

36 And as an added benefit. 37
37 What is the Future for Renewable Energy? Europe is more than a decade ahead. Note the role of biomass in the European renewable energy portfolio. Solar and wind are less than 10% while biomass makes up 67% in the most recent year s data. Total Renewable Energy Production in Europe in 1000's of tons of oil equivalent (TOE) Year Solar energy 0.4% 0.4% 0.4% 0.5% 0.5% 0.6% 0.6% 0.7% 0.8% 0.9% 1.2% 1.6% Biomass 60.7% 60.5% 60.1% 59.2% 62.3% 64.1% 63.8% 65.4% 66.0% 66.8% 66.6% 66.8% Geothermal Energy 4.5% 4.7% 4.8% 4.5% 4.8% 5.0% 4.8% 4.6% 4.5% 4.3% 4.0% 3.9% Hydro power 31.3% 30.9% 30.8% 31.5% 27.2% 24.8% 24.5% 22.4% 21.4% 19.8% 19.6% 18.7% Wind power 1.0% 1.3% 1.9% 2.3% 3.1% 3.6% 4.5% 5.2% 5.7% 6.7% 7.2% 7.6% source: Eurostat Energy Statistics,
38