Natural Gas Pressure on the Status Quo and Energy Efficiency
|
|
|
- Alisha Flowers
- 5 years ago
- Views:
Transcription
1 Natural Gas Pressure on the Status Quo and Energy Efficiency Workshop for Michigan PSC April 3, 2007 Richard Sedano and Wayne Shirley 50 State Street, Suite 3 Montpelier, Vermont USA Tel: Fax: The Regulatory Assistance Project 110 B Water Street Hallowell, Maine USA Tel: Fax:
2 Introduction Regulatory Assistance Project RAP is a non-profit organization, formed in 1992, that provides workshops and education assistance to state government officials on electric utility regulation. RAP is funded by the Energy Foundation, US EPA & US DOE. Richard Sedano was Commissioner of the Vermont Department of Public Service, Wayne Shirley was Chair of the New Mexico Public Utilities Commission
3 The Regulatory Assistance Project RAP Mission: RAP is committed to fostering regulatory policies for the electric industry that encourage economic efficiency, protect environmental quality, assure system reliability, and allocate system benefits fairly to all customers. 3
4 Natural Gas Trends Pressure on Demand Still the marginal new generation fuel On the margin ~half the time for Michigan market End use demand strong despite efficiency boost Pressure on Supply Production declining More contention for gas from other countries Pressure on Prices Risk management task evolving 4
5 Energy Efficiency More Important Reduce Demand Pressure (Reduces Prices) Barriers to cost-effective energy efficiency Regional effort needed for significant results Connection to electric sector very clear Generation competing with gas end uses Climate change strategy and compliance Attrition may slow or stop NARUC Resolutions 5
6 Natural Gas Energy Efficiency Not as important as electricity efficiency for purpose of reducing gas demand and lowering pressure on prices. Is very important as a starting point for improving efficiency resource policies, especially decoupling because state regulators very focused and concerned. 6
7 Gas Efficiency Programs Furnace replacement rebates. $250 rebates on $ furnace. Probably not big enough. Water heating. Building shells. Attics. Heat pumps. Process improvements for industry. 7
8 Electric / Gas End Use Competition Some states require all fuels (fuel neutral) analysis (CT, VT, WI) Has been very difficult except for joint gas/electric utilities Especially regarding fuel switching Decoupling helps some. TRC analysis looks at avoided equipment costs as well as fuel. 8
9 Full Fuel Cycle Costs Energy efficiency from extraction to end use and all steps in between (not just site) Gas looks very good in residential and heating applications. 90% efficient. Electricity generation about 30% efficient for all fossil fuels. Natural gas generator efficiency: 40%+. Coal generator efficiency: high 30%+ 9
10 Utility Incentives & Energy Efficiency Michigan PSC Informational Workshop April 3, 2007 Presented by Wayne Shirley The Regulatory Assistance Project 50 State Street, Suite 3 Montpelier, Vermont USA Tel: Fax: Penny Lane Cedar Crest, New Mexico USA Tel: E-Fax: B Water St. Hallowell, Maine USA Tel: Fax:
11 Lost Revenue/Expense Recovery Decoupling utility profits from sales volume Providing positive incentives for meeting efficiency goals Approaches to Address Utility Incentives for Energy Efficiency 11
12 Net Lost Revenue Recovery Adjustment that tracks the implementation of energy efficiency and uses statistical means to determine net lost revenues Recovery of net lost revenue can be contingent on achieving certain energy efficiency program goals Alternatively, recovery of program expenses 12
13 Lost Revenue/Expense Approaches Kentucky Nevada 13
14 Lost Revenue/Expense Approaches: Kentucky Allows lost revenue recovery for both electric and gas DSM programs. Recovery mechanisms are determined on a case-by-case basis Utilities can recover Full costs of commission-approved demand-side management programs and Revenues lost Incentives designed to provide financial rewards to the utility for implementing cost-effective demand-side management programs Not in active use for all eligible utilities 14
15 Lost Revenue/Expense Recovery Approaches: Nevada Utility required to track and separate costs For Commission approved action plan programs, utility may recover labor, overhead, materials, incentives paid to customers, advertising, marketing and evaluation 15
16 Traditional Regulation: Provides Strong Disincentives for Energy Efficiency Utility revenues and profits are linked to unit sales (kw, kwh, therms, etc.) Loss of sales due to successful implementation of energy efficiency will lower utility profitability The effect may be quite powerful 16
17 Assumptions for A Sample Utility Assumptions Operating Expenses $160,000,000 Rate Base $200,000,000 Tax Rate 35.00% Weighted Cost Rate Dollar Amount Cost of Capital % of Total Cost Rate Pre-tax After-Tax Pre-Tax After-Tax Debt 55.00% 8.00% 4.40% 2.86% $8,800,000 $5,720,000 Equity 45.00% 11.00% 4.95% 7.62% $9,900,000 $15,230,769 Total % 10.48% Revenue Requirement Operating Expenses $160,000,000 Debt $5,720,000 Equity $15,230,769 Total $180,950,769 Allowed Return on Equity $9,900,000 17
18 How Changes in Sales Affect Earnings % Change in Sales 5.00% 4.00% 3.00% 2.00% 1.00% 0.00% -1.00% -2.00% -3.00% -4.00% -5.00% Revenue Change Pre-tax After-tax $9,047,538 $5,880,900 $7,238,031 $4,704,720 $5,428,523 $3,528,540 $3,619,015 $2,352,360 $1,809,508 $1,176,180 $0 $0 -$1,809,508 -$1,176,180 -$3,619,015 -$2,352,360 -$5,428,523 -$3,528,540 -$7,238,031 -$4,704,720 -$9,047,538 -$5,880,900 Impact on Earnings Net Earnings % Change Actual ROE $15,780, % 17.53% $14,604, % 16.23% $13,428, % 14.92% $12,252, % 13.61% $11,076, % 12.31% $9,900, % 11.00% $8,723, % 9.69% $7,547, % 8.39% $6,371, % 7.08% $5,195, % 5.77% $4,019, % 4.47% 18
19 A Change in Approach Is Needed Throughput incentive is at odds with a requirement to invest in cost-effective energy efficiency Policies should, instead, align utilities profit motives with acquisition of all cost-effective energy efficiency Decoupling & profit incentives, coupled with strong regulatory and legislative policy support and industry leadership are a part of the solution 19
20 New Mexico: Example of Clear Policy Direction It serves the public interest to support public utility investments in cost-effective energy efficiency and load management by removing any regulatory disincentives that may exist and allowing recovery of costs for reasonable and prudently incurred expenses of energy efficiency and load management programs The commission shall identify any disincentives or barriers that may exist for public utility expenditures on energy efficiency and load management and, if found, ensure that they are eliminated in order that public utilities are financially neutral in their preference for acquiring demand or supply-side utility resources New Mexico Statutes, Chapter
21 Revenue-Profit Decoupling: What is it? Breaks the mathematical link between sales volumes and profits Objective is to make profits levels immune to changes in sales volumes This is a revenue issue This is not a pricing issue Volumetric pricing approaches need not be changed Not intended to decouple customers bills from consumption (another topic for another day) 21
22 History of Decoupling: California California 1990s to Present Decoupling functioned well in early 90s Move to retail competition precipitated its end in 1996 on theory that market forces and consumer choice would handle efficiency Reinstated following the energy crisis of Continues to work well 22
23 History of Decoupling: Washington Washington (Puget Sound Energy) adopted decoupling in 1990 Variable power costs recovered via a true-up based on actual experience (same as traditional regulation) Fixed costs recovered based on a revenue-per-customer calculation Marginal fixed costs were much lower than average fixed costs Purchased power costs were higher than expected Result: over recovery of fixed costs & large increases in power costs Lead to negative consumer reaction But, root cause of problem was underlying cost structure, not decoupling Recent effort to restore decoupling with Puget foundered over cost of capital issue 23
24 History of Decoupling: Maine Central Maine Power adopted decoupling in early 1990s Used an annual adjustment mechanism Economy suffered steep economic downturn that reduced sales several percent Result was large, unexpected increases in prices Again, root cause was underlying cost structure, not decoupling per se 24
25 History of Decoupling: Lessons Learned Annual adjustments may result in large price changes Consider limiting overall size of prices changes over time Consider use of exit ramps or required reviews if prices changes exceed some threshold Consider sharing arrangements for prices changes above some threshold 25
26 Revenue Decoupling: The Basic Concept Most effective method to decouple sales & profits Basic Revenue-Profit Decoupling: Utility base revenue requirement determined with traditional rate case Each future period has a calculable allowed revenue requirement Differences between the allowed revenues and actual revenues are tracked on an average use per customer or other basis The difference (positive or negative) is flowed back to customers in a small adjustment to unit rates 26
27 Decoupling Examples: Maryland Gas Utilities North Carolina Gas Utilities California 3 IOUs (Electric & Gas) Oregon Northwest Natural Gas New Jersey (NJNG) Utah (Questar) Idaho (Idaho Power) Washington (Avista & Cascade) 27
28 Decoupling: Maryland Baltimore Gas & Electric Decoupling mechanism for residential and general service gas customers Straight revenue-per-customer method Based on prior rate case test year for base revenue per customer Monthly adjustment mechanism similar to traditional fuel and purchase power adjustments MADRI Model Rate Rider starting point 28
29 Maryland: How BG&E Decoupling Works Allowed Revenues = Test Year Average Use per Customer X No. of Customers X Delivery Price Adjustment to Delivery Price = Allowed Revenues - Actual Revenues Estimated Sales Any difference between actual and estimated sales is reconciled in a future month Calculated separately for each class Calculation of the billing adjustment are filed monthly with the Public Service Commission 29
30 Decoupling: North Carolina An Interesting Read North Carolina s three major gas utilities have decoupling mechanism Expressed importance of highly volumetric rate structures and lower fixed customer charges Rejected some arguments against decoupling Good overall discussion of policy framework for decoupling 30
31 North Carolina: Approaches Rejected Rejected higher fixed charge approach as unpopular with customers Rejected Attorney General s argument that proposal would penalize customers for conserving 31
32 North Carolina: Customers & Shareholders Different usage patterns and tariffs of industrial customers provide good cause to exclude class from mechanism Approved as an experimental tariff limited to no more than 3 years Required utility contribution toward conservation programs (e.g. $500,000 per year for Piedmont) Required utility to work with the Attorney General and the Public staff to develop appropriate and effective conservation programs to assist its residential and commercial customers 32
33 Decoupling: North Carolina Rationale for Decoupling Recognized conservation has potential for financial harm to the utility and its shareholders Cited number of benefits: Improved opportunities for conservation of energy resources, savings for customers, downward pressure on wholesale gas prices, helping utility recovery of margin and a reasonable return Decoupling better aligns interests of Company and customers with respect to conservation Commission on Shareholder Risk: In a period of declining per-customer usage, a mechanism that decouples recover of margin from usage, without requiring the utility to file frequent rate cases or increase unpopular fixed charges, clearly reduces shareholder risk. 33
34 Which Brings Us To: A Policy Tale of Two Utilities Rising revenue-per-customer utilities: Experience rising earnings between rate cases Typical of many electric utilities Declining revenue-per-customer utilities: Experience declining earnings between rate cases Typical of many gas utilities Under reasonable assumptions, not symmetric between rising and declining cases Usually driven by differences in the average consumption between new and old customers Policy question: Should decoupling be profit neutral relative to future such profit expectations? 34
35 What Happens to ROE Under Traditional Regulation? Actual ROE vs. Allowed ROE 20.00% 15.00% 10.00% Allowed ROE Increasing Sales Case Declining Sales Case ROE 5.00% 0.00% -5.00% % Growth Rates Sales Volume +3%/-3% Customers 2% Operating Expenses 2% % % Year 35
36 California Decoupling Basics Part of an aggressive and comprehensive policy framework designed to deploy cost-effective energy efficiency Covers SDG&E/SocCalGas, PG&E and SCE Tracks difference between allowed revenues and actual revenues Trued up each year to that year s authorized revenues Revenue requirements are adjusted each year for inflation Each utility has individual mechanisms for determining annual revenue requirements 36
37 California Case Specifics: Company Plan Features Southern California Edison Citing: Poor financial health of company Changed circumstances since such adjustments were rejected (20 years ago) Commission approved non-test year revenue requirement adjustments Implemented revenue balancing account for over- / under-collections of revenue adjustment San Diego Gas & Electric and SoCalGas Each year s revenue requirement is determined by the previous year s base margin adjusted by CPI Minimum and maximum authorized adjustments (in 3%-4% range) Balancing account for adjustment collections Sharing mechanism 37
38 California: SDG&E/SoCalGas Shareholder & Customer Sharing Earnings Band Over 300 Shareholders Ratepayers 100% 0% 75% 25% 35% 65% 45% 55% 55% 45% 65% 35% 75% 25% Suspension 38
39 Pacific Gas & Electric Separate Distribution and Generation mechanisms: DRAM (Distribution revenue adjustment mechanism) and UGBA (Utility Generation Balancing Account) revenue adjustment mechanisms Allowed revenues: annual CPI-based attrition adjustments for , with following minimums and maximums: Year Min 2.00% 2.25% 3.00% Max 3.00% 3.25% 4.00% 39
40 Decoupling: Oregon Northwest Natural Gas Defers and subsequently amortizes 90 percent of the margin differentials in the residential and commercial customer groups Average customer margin-per-therm calculation Calculated Monthly Places weather risk on utility 40
41 Speaking of weather What about weather risk? Myth: Decoupling shifts weather risk from utility to customer Reality: Utility and customer take (or avoid) weather risk together Simplest form of decoupling insulates utility and customers from weather risk Elimination of weather risk has cost of capital implications 41
42 MADRI Model Rule Used BG&E Rate Rider as starting point Model Rule is product of collaborative stakeholder process Available at: Tracks on demand and energy basis 42
43 Arizona Connecticut Massachusetts New Hampshire Nevada Vermont Positive Incentives 43
44 Positive Incentives Arizona Required funding levels ~$10M+ & low income assistance Utility keeps up to 10% of net economic benefits Connecticut Utilities receive performance management fees tied to performance goals based on lifetime energy savings and demand savings (2004: ~$5.3M) Incentives earned for outcomes from % of pre-determined goals (2006 budget $2.9M) Massachusetts Shareholder incentive of five percent of funding for 75%-110% of design level performance Regulatory finding: Incentives must be large enough to promote good program management, but small enough to leave almost all of the energy efficiency funds to directly serve customers 44
45 Positive Incentives Minnesota Utilities receive a percentage of total net benefits (avoided costs minus program costs) when performance levels are met or exceeded New Hampshire Cost-effectiveness incentive of 4% of budget times cost-effectiveness ratio (actual to planned costeffectiveness) minimum ratio of 1.0 Energy Savings incentive of 4% of budget times ratio of actual to saved energy savings - minimum 65% of planned energy savings 45
46 Positive Incentives Nevada DSM bonus rate of return 5% higher than returns for supply investments Critical Facilities Incentive for reliability, diversity of supply- and demand-side resources, development of renewable resources, fulfilling statutory mandates and/or retail price stability, can be enhanced return on equity, CWIP treatment or creation of regulatory asset account Vermont Efficiency Vermont receives performance incentives for meeting or exceeding specific goals in contract with Vermont s Public Service Board (PSB) Incentive categories: Program Results Incentives (electricity savings & resource benefits) Market Effects Incentives (significant market transformation) Activity Milestones Incentive (exemplary performance for rapid start-up and/or infrastructure development ) 46
47 Learn More Energy Efficiency Policy Toolkit Profits & Progress Through Least-cost Planning Profits and Progress Through Distributed Resources Performance-based Regulation For Distribution Utilities Performance-Based Regulation in a Restructured Electricity Industry 47
48 Plan References CA MD OR NJ: VT: ervice%20tariff/brdr_3.doc www2.njresources.com/news/trans/newsrept.asp?year=
49 Decoupling & Incentives Questions? 49
50 50 State Street, Suite 3 Montpelier, Vermont USA Tel: Fax: Cost Recovery Monitoring and Verification Programs Workshop for Michigan PSC April 3, 2007 Richard Sedano The Regulatory Assistance Project 110 B Water Street Hallowell, Maine USA Tel: Fax:
51 Energy Efficiency Program Cost Recovery Expectation for any just and reasonable cost prudently incurred Methods Rate case approved cost of service Tariff rider adjusts for allowed spending changes System benefit charge (dedicated surcharge) 51
52 Cost Recovery Considerations Timely recovery avoids negative attitude Program Stability Core programs create business infrastructure and consumer expectations Budget Stability Consider a minimum funding level Enable Opportunity Investments Process to approve increases takes advantage of modular nature of energy efficiency 52
53 Cost Recovery Connection to Energy Savings Energy Efficiency in Resource Planning requires savings performance Cost recovery can be tied to performance As generation efficiency has been by some PUCs Or performance can just drive incentive rewards Good to have energy savings (or emissions avoided) as the focus rather than dollars spent 53
54 Expense or Capitalize? Full rate effect early No carrying cost Unlike capital alternatives Lower rate effect early Carrying cost adds Like capital alternatives Answer will affect outcome of the RIM Test 54
55 Monitoring & Verification Calculating energy and capacity savings Emission savings Portfolio standard credit (and offsets?) Consistency (a therm is a therm) Consistent PUC Protocols Process, definitions International Performance Measurement and Verification Protocol (IPMVP) a good start 55
56 M&V Considerations Use of good statistical samples for sites and expansion of sample analysis results to the program population Use of inexpensive and readily available site energy consumption and program tracking data Regression analysis of energy use/savings from multiple sites Analysis of attribution (free ridership, spillover, program effects) - net to gross ratios 56
57 A general approach to M&V Determining gross program energy savings A sample of project savings are determined Statistical analyses of large volumes of energy billing data Quality assurance reviews of existing documentation Convert to net energy savings using a range of possible considerations (e.g., free rider, persistence corrections) Emission factors are derived and applied to net savings in order to determine avoided emissions 57
58 M&V Challenges Applying deemed savings Benefits from improved methods, climate-driven Market transformation programs Measuring market changes, not savings Budget M&V costs 3-5% of program budget An investment worth making 58
59 Vermont Equipment Replacement Rebates Hot Air Furnace 90% to 92% AFUE $ Hot Air Furnace 92.1%+ AFUE $ Hot Water Boiler 87%+ AFUE 650 ccf/yr for Heat $ Steam Boiler 82%+ AFUE 700 ccf/yr for Heat $ Water Heater 40/50 gal..61+ EF $ Tankless WH.80+ EF $ Multiple boiler/furnace systems and non-conventional designs will be evaluated on a caseby-case basis. ms.html#equipment (information on tax credits and compatibility with electric EE also) 59
60 Commercial Replace and Retrofit Service and Rebates Free walk-through audit to identify potentially cost-effective energy efficiency measures. Engineering assistance to evaluate potentially cost-effective energy efficiency measures from audit. Possible financial incentives to install cost-effective measures, including high efficiency equipment and controls. Energy efficient equipment info. Engineering assistance to quantify savings and cost-effectiveness of an equipment replacement project. Assistance in locating and selecting qualified consulting engineers. Possible assistance in financing the cost of an engineering analysis. Unit heaters Furnaces Hot Water Boilers Steam Boilers Modulating Burners Pool Heaters Domestic Hot Water Heaters Venturi Steam Traps Kitchen Exhaust Hoods Air to Air Heat Recovery Equipment Waste Heat Recovery Equipment Heat Exchangers 60
61 Competition Natural Gas competes with unregulated fuels Energy Efficiency is a cost that the competition does not have Energy Efficiency is a service that the competition does not offer 61
62 Are Utility Energy Efficiency Programs Anti-Competitive? Some are concerned that utility programs make it harder for ESCOs to make a market for their services Yet there remains significant unmet potential Utilities can use contractors to match skills with tasks and expand the local market through their ubiquity, web presence, etc. 62
63 Whole Building Opportunities The best energy efficiency service is available to low income homes receiving weatherization service Measures consider how the whole building works Suggests merits of electric and gas program coordination where possible to increase benefits/cost 63
64 Regulatory Structure Statutes: General least cost or specific EE Rulemaking: clarity of process (AR, NM) asp?docket=06%2d004%2dr&docnumval=83 (Order #12) Part of Resource Adequacy (IRP): context Periodic Program Approval Annual Reporting Transparency (collaborative, advisory) 64
65 National Action Plan for Energy Efficiency Recommendations: Recognize energy efficiency as a high priority energy resource Make a strong, long-term commitment to implement cost-effective energy efficiency as a resource Broadly communicate the benefits of and opportunities for energy efficiency Promote sufficient, timely, and stable program funding to deliver energy efficiency where cost-effective. Modify policies to align utility incentives with the delivery of cost-effective energy efficiency and modify ratemaking practices to promote energy efficiency investments. 65
66 Back up slides on Natural Gas and Energy Efficiency Workshop for Michigan PSC April 3, State Street, Suite 3 Montpelier, Vermont USA Tel: Fax: The Regulatory Assistance Project 110 B Water Street Hallowell, Maine USA Tel: Fax:
67 Why think about Natural Gas? 67

68 Natural Gas Use in US Economy 68

69 Natural Gas Supply GOM=Gulf of Mexico 69

70 Domestic Production Declines 70
71 Declines Despite Increased Drilling 71

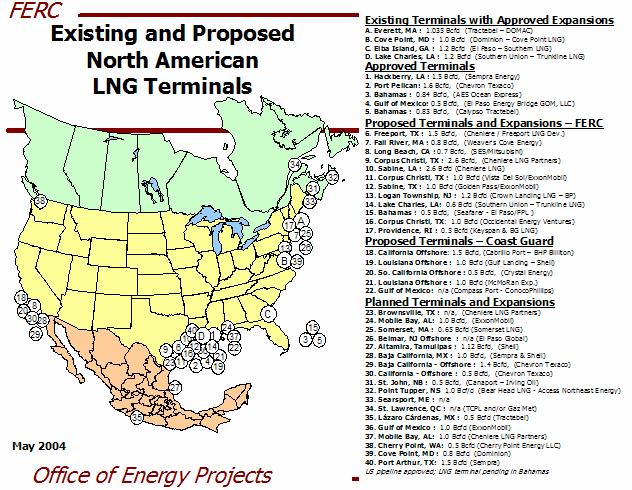
72 LNG Imports 72
73

74
75 LNG World Contracts Traditionally financed with long tem fixed price contracts before infrastructure built or movement of commodity begins. Not the way NG market works in US. Looks like we can build LNG terminals in the US market-based way. Uncertain whether compressing stations and tankers will built without support of long term fixed contracts. 75

76 Demand for Natural Gas 76

77 Current US Regional Demand for Natural Gas

78 Industrial Demand in US 78

79 Demand by End Use 79
80 Residential End Uses 80
81 Energy Efficiency Can Also Reduce Natural Gas Pricing EEA May 2004 National EE only Midwest EE only Historic NatGas Price ($/MMcf) Source: EEA 2004 and ACEEE 2005
82 50% 45% 40% 35% 30% 25% 20% 15% 10% 5% 0% Summary of Recent EE Studies Technical Economic Electric Efficiency Studies Gas Efficiency Studies Achievable New York - Elec Oregon - Elec Puget - Elec Southwest - Elec Vermont - Elec U.S. - Elec New Jersey - Elec Connecticut - Elec Georgia - Elec Northwest - Elec Wisconsin - Elec Average - Elec California - Gas Oregon - Gas Puget - Gas Utah - Gas U.S. - Gas New Jersey - Gas Georgia - Gas ConEd Service Area - Gas Wisconsin - Gas Average - Gas Region 82 California - Elec Mass. - Elec Percent Savings

83 Hubs and Markets 83

84 Hubs and Commodity Pricing 84

85 National Data: Gas and Electricity 85

86

87 Source: Cambridge Energy Research Assocs. 2003

88 2005 Annual Energy Outlook 88

89 2006 Annual Energy Outlook 89
90 NARUC 1989 Resolution in Support of Incentives for Electric Utility Least-Cost Planning RESOLVED,, That the Executive Committee of the National Association of Regulatory Utility Commissioners (NARUC) assembled in its 1989 Summer Committee Meeting in San Francisco, urges its member state commissions to: 1)consider the loss of earnings potential connected with the use of demand-side resources; and 2)adopt appropriate ratemaking mechanisms to encourage utilities to help their customers improve end-use efficiency cost-effectively effectively; ; and 3)otherwise ensure that the successful implementation of a utility's least-cost plan is its most profitable course of action Sponsored by the Committee on Energy Conservation, Adopted July 27,
91 NARUC: 2003 Resolution on EE Support and Incentives RESOLVED, That (NARUC) supports the July 2003, call of the Department of Energy which encourages State and Federal Regulatory Commissions to revisit the level of support and incentives for existing gas and electric utility programs designed to promote and aggressively implement cost-effective conservation, energy efficiency, weatherization, and demand response in both gas and electricity markets. Sponsored by the Committee on Energy Resources and the Environment Adopted by the NARUC Board of Directors July 30,
92 NARUC: 2004 Resolution on Gas and Electric Energy Efficiency RESOLVED, That the Board of Directors of the NARUC encourages State commissions and other policy makers to support the expansion of natural gas energy efficiency programs and electric energy efficiency iency programs, including those designed to promote consumer education, weatherization, and the use of high-efficiency appliances, where economic, and to address regulatory incentives to address inefficient use of gas and electricity; and be it further RESOLVED, That the Board of Directors of the NARUC, encourages State S and Federal policy makers to: (i) review and upgrade the energy efficiency standards for buildings ings and appliances, where economic, to ensure these standards remain valid under potentially higher energy prices, and (ii) promote the use of high-efficiency consumer products, where economic, including advanced building materials, Energy Star appliances, and energy smart metering and information control devices. Sponsored by the NARUC Natural Gas Task Force, Committee on Gas, Committee on Consumer Affairs, Committee on Electricity, and Committee on Energy Resources and the Environment Adopted by the NARUC Board of Directors July 14,
93 NARUC 2006 Resolution on National Action Plan for Energy Efficiency RESOLVED, That the Board of Directors of the National Association of Regulatory Utility Commissioners (NARUC), convened in its 2006 Summer Meeting in San Francisco, California, reaffirms its support for the Association s July 2004 "Resolution on Gas and Electric Energy Efficiency"; and be it further RESOLVED, That the Board of Directors commends the commitments made on July 31, 2006 at the opening session of these meetings by a number of State commissions and other stakeholders to take specific actions to move their States aggressively toward increased energy efficiency; and be it further 93
94 NARUC 2006 Resolution on the National Action Plan for Energy Efficiency RESOLVED, That the Board of Directors: endorses the principal objectives and recommendations of the National Action Plan on Energy Efficiency, and commends to its member commissions a State-specific, and where appropriate, regional review of the elements and potential applicability of the energy efficiency policy recommendations outlined in the Plan, in an effort to identify potential improvements in energy efficiency policy nationwide. Sponsored by the Executive Committee and the Committees on Consumer Affairs, Electricity, Energy Resources and the Environment, and Gas Adopted by the NARUC Board of Directors August 2,