International Journal of Innovative Research in Science, Engineering and Technology. (An ISO 3297: 2007 Certified Organization)
|
|
|
- Geraldine Pope
- 5 years ago
- Views:
Transcription
1 An Investigation on the Quality of Groundwater and Its Suitability to Agriculture in and Around Badvel Taluka of Kadapa District, Andhra Pradesh, India: A GIS Approach D. Janardhana Rao 1, Suresh Pulapaka 3, P.L Keshava Kiran Kumar 4, B. Hari Babu 2 Research Scholar, Department of Environmental Sciences, Acharya Nagarjuna University, Guntur, India 1 Assistant Professor, Department of Chemistry, Acharya Nagarjuna University, Guntur, India 2* Department of Chemistry, SCNR Govt. Degree College, Proddatur, Andhra Pradesh, India 3 Research Scholar, Department of Geology, Yogi Vemana University, Kadapa, India 4 ABSTRACT: Study was carried out to evaluate the major cation Chemistry, the factors controlling water composition, and suitability of water for irrigation. The problems of water quality have become more important than the quantity, as the environmental problems are getting more serious in several parts of the world. A number of factors like geology, soil, effluents, sewage disposal and other environmental conditions in which the water happens to stay or move and interact with, influences greatly on the groundwater quality of an area. The spatial maps show that the concentration of the chemical constituent in ground water varies spatially and temporarily. Sodium is the most dominant cation with Cl - and HCO 3 - are the dominant anions.sar values indicated thatboth pre and post monsoons watersamples are excellent (S1) for irrigation,while electrical conductivity values classified these ground water, respectively under high saline water consist (C3) category.water quality data are utilized in the present study for the analysis of groundwater chemistry of year 2014, Pre-monsoon(July) and 2014, post-monsoon(december) seasons. Water quality data used in the analysis include Electrical Conductivity (EC), Total Alkalinity (TA), Total Hardness (TH), Calcium, Magnesium, Sodium, Potassium, Sodium Adsorption Ratio (SAR) Sodium and Residual Sodium Carbonate (RSC). KEYWORDS: Water quality, Agriculture, SAR, TDS, GIS, Remote sensing. I. INTRODUCTION Groundwater is an important source of drinking water for many people around the world. The resource in several places becomes contaminated from natural agents or by numerous human activities. There is a tremendous amount of pressure in protecting the water resources available in the country. The disposal of wastewater into the surface water bodies leads to serious problems and affects the people in health aspects. Especially in the urban areas, the pollution of domestic effluent discharges into the nearby surface water bodies created problems for the public. There are many ways of safe disposal of wastewater. But improper management of wastewater generation in the urban areas find its own way of getting into the surface water. Hence, the effluent discharge affects the surface water bodies. Water quality data are utilized in the present study to analyse the groundwater chemistry for the year 2014 during pre-monsoon (July) and post monsoon (December) seasons. Hydro chemical evaluation of groundwater systems is usually based on the availability of a large amount of information concerning groundwater chemistry [6,7]Hydro geochemical data are used in the analysis, including Electrical Conductivity (EC),TotalDissolved Solids (TDS), Total Hardness (TH), Sodium percentage, ResidualSodium Carbonate (RSC) andsodium Adsorption Ratio (SAR). Copyright to IJIRSET DOI: /IJIRSET
. It covers a total geographical area of 1906.80 sq. km (Figure 1).")
2 II. STUDY AREA The study area, Badvel taluka of Kadapa District, Andhra Pradesh, India, has been selected for this study, it is located at "N and 15 12'39.93"N latitudes and " E and 78 56'15.952"E longitudes (Figure:1). It covers a total geographical area of sq. km (Figure 1). The area is bounded on the North West byprakasam and Kurnool districtin the West, in the South Chittoordistrict, and in the North East, East by Kurnool District. The District is located in one of the Jordon bird researchcentres of the Western Ghats. This region receives rainfall at the time of shifting climatic wind belts, but it is in rain shadow track at the time of the southwest monsoon. Fig. 1: Selected study area with stations III. MATERIALS AND METHODOLOGY The investigation was designed to investigate the conditions of groundwater contamination in the study areas. The hydro geochemistry study was undertaken by randomly collecting 60 groundwater samples from dug and bore well covering Badvel taluka during the moths of July and December Samples were drawn with a pre cleaned plastic polyethylene bottle. Prior to sampling, all the sampling containers were washed and rinsed thoroughly with the groundwater. Water quality parameters such as ph and electrical conductivity (EC) were analysed immediately. Other parameters wereanalysed later in the laboratories of Yogi Vemana University, Kadapa. Total dissolved solids (TDS) were computed by multiplying the electrical conductivity (Ec) by a factor (0.64). The surface water samples collected at sixty different stations withinbadvel Taluka,in a 2 L pre-cleaned polyethylene bottles during period of July and Decemberin 2014.Two times(pre and post monsoon) continuous monitoring is involved by comprehensive physicochemical analyse is encompassing estimation of major cations (Ca 2+, Mg 2+, Na +, K + ), besides general parameters (ph, EC, Ttotal alkalinity and Total hardness) Sodium percentage, Residual Sodium Carbonate (RSC) and Sodium Adsorption Ratio (SAR). GIS-modelling: For creating the spatial distribution maps, GIS has emerged as a powerful tool. GIS can be used for storing, displaying, and analysing spatial data. By using this data, decision making in several areas including Copyright to IJIRSET DOI: /IJIRSET
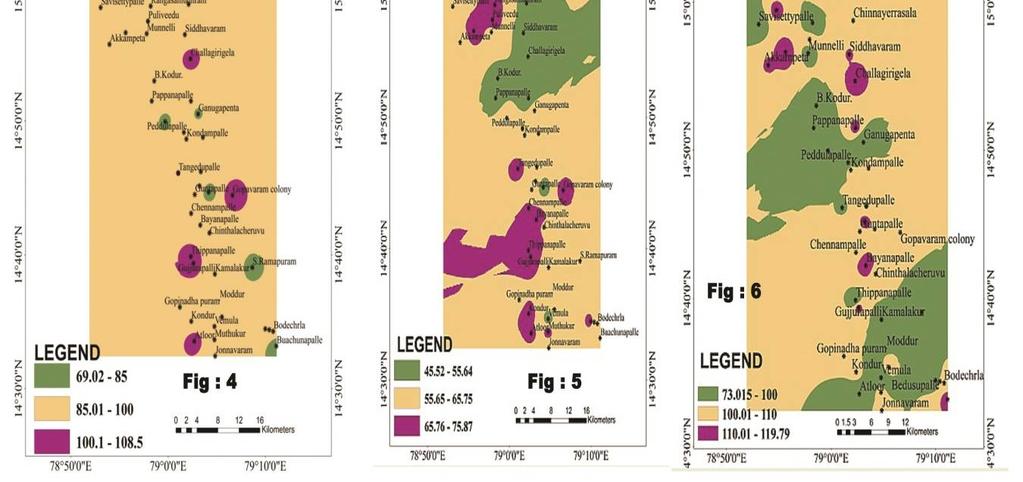
3 environmental and engineering field (Stafford 1991; Good child 1993; Burrough and McDonnell 1998a; Lo and Yeung 2003fueld) field can be done. The spatial distribution maps were prepared to show the variation in concentrations of the various chemical parameters using inverse distance weighted (IDW) raster interpolation technique of the spatial analyst module in ArcGIS 9.1. The general formula used in the IDW interpolation method was Ž (S O ) = N i=iƛiz (S i ) where Ž (SO) is the value we are trying to predict for S0, N is the number of measured sample points surrounding the prediction location that will be used in the prediction, and ƛi is the weights assigned to each measured point that we are used here. These weights will decrease with distance; Z (Si) is the observed value at the location Si. When we compare several interpolation techniques, IDW with a squared distance term gives the more consistent results (Burrough and McDonnel 1998a, b; Mathes and Rasmussen 2006) in this study, spatial distribution maps were generated for the selected water quality parameters, namely Ec, TH, Ca2 +, Mg2 +,Na +, K +,SAR, Na% and RSC(Figure-2 to Figure-11). IV. RESULTS AND DISCUSSION The seasonal variations of physico-chemical characteristics of the groundwater in the study area in Badvel Taluk of Kadapa District in 2014 are discussed below and presented in Figure 2 to 11.In the present study, assessment of groundwater potability based on physico-chemical analysis and evaluation of groundwater quality indices. The quality standards for drinking water have been specifiedby the Potability studies (as per BIS) and World Health Organization (WHO) in It has given the permissible and desirable limits of various elements in groundwater. 1) Electrical Conductivity (EC):Conductivity is the measure of capacity of a substance to conduct the electric current. The Ec values in the present study vary from 876 µ/cm at(s-32) to 2238 µ/mhosat (S-20)) during pre-monsoon and 814 µ/mhos(s-49) to 2180 µ/mhosrecorded at (S-51) in post-monsoon period (Table-3). During pre-monsoon and Postmonsoon periods, result shows 100% of samples fall under permissible category, the none of the samples fall under good category. During post monsoon period, higher concentration of (> 2220) salts was recorded south-western part, southeast, andcentral part of the study area. 2). TotalAlkalinity:Total Alkalinity is a measure of the ability of water to neutralize acids. The alkalinity varies from 110 to 260 (mg/l) in pre-monsoon and 132 to 258 (mg/l) during post monsoon period. The alkalinity values in the present study vary from 110 mg/l at (S-32) and 260mg/L at (S-20) during pre-monsoon and 132 mg/l (S-49) to 258mg/L, recorded at (S-51) in post-monsoon period (Table 3).All samples were recorded below the standard limit (600 mg/l) as prescribed by BIS in pre monsoon and post monsoon. Water with high alkalinity is said to be hard. Large amount of alkalinity imparts a bitter taste, harmful for irrigation as it damages soil and hence reduces crop yields (Sunder and Saseetharan 2008). 3) Total Hardness (TH): Generally water with a hardness of less than 50 ppm is rated as a soft water. The hardness below 500 ppm is recommended for drinking purpose. But for agricultural purpose, more than 1000 ppm of hardness is also accepted (Rao, 1975).The Total Hardness value of pre monsoon in 2014 shows concentration from 378 mg/l, at (S-13), to 607 mg/l, at (S-19) and 295 mg/l, at (S-25) to 575 mg/l, at (S-52) during post monsoon (Table.1). During pre and post monsoon seasons of 2014, 100 per cent of samples were recorded under very hard category in the study area. During post monsoon season about 100 per cent of samples fall under very hard category. In 2014, there was no appreciable variation between the pre and post monsoon period water quality. Almost all areas of pre and post monsoon periods fall under the low ion concentration of<600 mg/l category. 4). Calcium: Calcium may dissolve readily from carbonaterocks and lime stones or be leached from soils. But calcium is an essential nutritional element for human being and aids in the maintaining the structure of plant cells and soils. The concentration of calcium in the present study area ranges from varied 61 mg/lat (S-13) to115mg/l,at (S- 40),duringpre- monsoon and 49 mg/l,at (S-25)to112 mg/l at (S-52) during post monsoon. In this study area 59 stations were exceeded the permissible limits during pre and post monsoons.(according tobis,maximumpermissiblelimitsare200mg/lingroundwater). Copyright to IJIRSET DOI: /IJIRSET
4 5).Magnesium The concentration of magnesium in the present study area rangesfrom43 mg/lat (S-36) to83 mg/lwas recorded at (S-53) during pre-monsoonand41 mg/lat (S-1)to80 mg/l was recorded at (S-20),during post monsoon. Inpremonsoon,5sampleand in post monsoon 2 samples were exceeded the permissible limits(according tobis, maximum permissible limits are100mg/l). 6) Sodium (Na 2+ ): Sodium and potassium are naturally occurring elements in groundwater. These two elements are directly added into groundwater from industrial and domestic wastes and contribute salinity of water. The value of sodium for the groundwater samples is recorded in the range is varied from 68 mg/lat (S-32) to 142 mg/l at (S-20), during pre-monsoon season where as in the post-monsoon season it ranges between 61 mg/l was recorded at (S-49) to132 mg/lwas recorded at (S-35) (Table.1).None of samples were above the standard limit in pre monsoon andpost monsoon seasons. From this study, it is confirmed that the value of sodium for the groundwater sample is well within the permissible limit (200 mg/l) as suggested by WHO. High concentration of sodium ion in drinking water may cause heart/cardiac problems. 7). Potassium (K + ): Sodium and potassium are the most important minerals occurring naturally. The potassium values for the groundwater samples in the study area varied from (4 mg/l) was recorded at (S-12), to 12 mg/lat (S-4)during pre-monsoon season where as in the post-monsoon season it ranges between 4 mg/lat (S-16), to 12 mg/lat (S-26) (Table3).All samples were below the standard limit in pre monsoon and nil samples were recorded above the standard limit in post monsoon, as standard limit (12mg/L) prescribed by WHO. On comparison with the WHO standard value, it is found that the potassium values for all the groundwater samples are well within the maximum permissible limit in both monsoons (12 ppm). 8). Sodium Adsorption Ratio (SAR): The Sodium Adsorption Ratio (SAR) was estimated based on the given formula for the each sample location of the study area. The suitability of the open well and bore well samples were evaluated by determining the SAR value and these were categorized into different irrigation classes based on salinity and alkalinity hazards. Based on these values, isoclines were drawn to understand the spatial pattern of SAR ratio in the study area. Sodium hazard of water classification was proposed by (Richards, 1954). The following equation is employed to obtain SAR values + Na SAR = Ca + Mg/2 100 (Where, all ionic concentrations are expressed in milli equivalents per litre.) There were no much variations in SAR concentration between two seasons of In 2014, pre monsoon period SAR value varied 3.21 Meq/L at (S-32) to(6.66meq/l recorded at (S-13),were observed in pre monsoon and 2.85Meq/L at (S-49) to 6.33 Meq/L recorded at (S-32) during post monsoon. In both monsoons the values are within the permissible limits(10meq/l)category. This result indicates that a maximum area suitable for irrigation (Table 5). In 2014, SAR shows no appreciable difference between pre monsoon and post monsoon periods. Therefore SAR results shows that most of the study area falls under the excellent to good water quality category and found to be suitable for irrigation purpose. If the SAR ratio of the water samples in the study area is less than 10, it is excellent for irrigation purposes. The SAR value for each water sample was calculated using the following equation (Richards 1954).According to classification given in Table-1, both Pre and Post monsoons showed mean SAR value below 10 (Meq/L), indicating that ground waters are excellent (S1) for irrigation. 9)Residual Sodium Carbonate: The sodium hazard also increases, if the water contains a high concentration of bicarbonate ion. As the soil solution becomes more concentrated, there is a tendency for calcium and magnesium to precipitate as carbonates thus, increasing the relative proportion of sodium as a consequence. RSC can be calculated using the equation below employing data of alkalinity, calcium and magnesium. RSC = (Alkalinity*0.0333)-(Ca 2+ + mg 2+ ) Copyright to IJIRSET DOI: /IJIRSET
5 (Where concentration of Ca 2+ and Mg 2+ are in meq/l and alkalinity values in mg/l). In 2014, in pre monsoon period RSC value varied -1.44Meq/Lat (S-7), to 1.78 Meq/L at(s-38) during post monsoon Meq/Lat (S-16) to 2.16 Meq/Lat (S-12)value recorded at during post monsoon2014 (Table.1). 10. CSSRI Classification for Irrigation Suitability. As per CSSRI classification, out of sixty stations, all the stations are found to be good in quality the for the purpose of irrigation. In general, these waters were of Ca-Na-Mg type with the dominance of HCo - 3 and CO3 in case of good quality waters. The poor water quality belonged to categories of A1, B2, B3, C1, C2 and C3 which are either having accumulation of salts (high Ec) or high Sodium Absorption Ration (SAR) or Residual Sodium Carbonate (RSC). Under the category of Saline Waters, There are thirty eight stations were come under Marginally Saline (B1) category there is no within Saline (B2) category and in high SAR Saline (B3) Category. While classify the water with respect to Alkali category, No station is identified under Marginally alkali (CI) category and three stations are in Alkali (C2) category. Four stations are observed in Highly Alkali (C3) category. The thematic map shows the representation of classification of different waters with respect to CSSRI for irrigation suitability. XI. CONCLUSION Sixty groundwater samples were collected from different parts of Badvel taluka and analysed for, EC, Total hardness, Total Alkalinity, Ca 2+, Mg 2+, Na +, and K +, using standard procedures. The values of all the groundwater samples are compared with the standard permissible value. Total Hardness are not exceeding the permissible limit in most of the groundwater samples. The EC value during pre-monsoon season of 2014 varies from 876 to 2238 and in post monsoon season the difference ranges between 814 and According to classification of drinking water on the basis of TDS values, all the groundwater samples are found to be non-saline. The results of total dissolved solids of both the seasons fall under the fresh water and slightly saline categories. Total hardness of both the seasons fall under very hard category. Hardness in 2014, there was no appreciable variation between the pre and post monsoon period water quality. Almost all areas of pre and post monsoon periods fall under the low ion concentration of < 500 mg/l category. In premonsoon, 5 sample and in post monsoon 2 samples were exceeded the permissible limits (According tobis,maximum permissible limits are200mg/l except in study area). In all the stations calcium were recorded within the permissible limits during pre and post monsoon, None of samples were above the standard limit in pre monsoon and post monsoon seasons, from this study, it is confirmed that the value of sodium for the groundwater sample is well within the permissible limit (200 mg/l) suggested by WHO. The results of sodium percentage of both the seasons fall 28 samples under permissible and 36 samples under doubtful during pre-monsoon and 32 stations permissible 24samples were recorded under doubtful. In 2014, SAR shows no appreciable difference between pre monsoon and post monsoon periods. The output of SAR shows 100 per cent of the samples fall under excellent to good category (<10) (Meq/L) under permissible category. The irrigation water quality was(classified based on USSL Fig.11) indicating that in 2014 out of 60 samples, 100 % (in pre monsoon) and out of 100 per cent (in post monsoon) of the water samples belong to good category while other samples fall under moderate to poor water category. The study was carried out in entire Badvel Taluk. GIS technologies can provide appropriate platform for convergent analysis of large volume of multi-disciplinary data and decision making for ground water studies can be effectively done. The GIS bare zoning of groundwater quality map may be used as a guideline for predicting the groundwater quality to new areas. The present study provides a guideline for solving water quality problem in Badvel Taluk.From the obtained results, it is suggested to monitor the groundwater quality and to assess periodically in this study area to prevent the further contamination. REFERENCES [1] Kumar, Vijaya, J. Narayana, E.T. Puttaiah and K Harish Babu (2005). Assessment of Surface and Sub Surface Water of Bhadhra River Basin near Bhadravathi Town, Karnataka, J. Ecotoxicol. Environ. Monit. 15 (3): [2] Pedley S. and Howard G. (1997). The public health implication of groundwater microbiology. Q. J. Eng. Geol. 30 (2), 179. [3] Stafford DB (1991) Civil engineering application of remote sensing and geographic information system. Copyright to IJIRSET DOI: /IJIRSET
6 ASCE, New York. [4] Burrough PA, McDonnel RA (1998) Principles of geographical information systems for land resources Assessment. Oxford University Press, New York [5] Bureau of Indian Standards (BIS) (1998) Drinking water specifications (revised 2003), IS:10500 [6] Rao, G.S. &Rao, G.N., 2010, Study of groundwater quality in greater Visakhapatnam city, Andhra Pradesh (India), J. Environ. Sci. Eng., 52 (2), [7] WHO: Guidelines of Drinking Water Quality in Health Criteria and Other Supporting Information. 1984, Vol. 2, p [8] T.R Tiwari, Indian J Environ Health. 2001, 43(1), 176. [9] B. Nirmala; B.V. Suresh; P.A. Suchetan; M. Shetprakash, Int. Res. J. Environment Sci.,2012, 1(4), [10] Sundar ML, Saseetharan MK (2008) Ground water quality in Coimbatore, Tamil Nadu along Noyyal River. J Environ SciEng 50(3): [11] M. T. Hossien, Hydrochemical evaluation of groundwater in the Blue Nile Basin, eastern Sudan, using conventional and multivariate techniques, Hydrogeology Journal, Vol. 12, pp , 2004.] [12]Srivastava N, Harit GH, Srivastava R (2009) A study of physicochemical characteristics of lakes around Jaipur. India J. Environ Biol 30(5): [13].Wilcox LV (1995) Classification and use of irrigation waters. US Department of Agriculture, Washington DC. [14].Richards LA (U.S. Salinity Laboratory) (1954) Diagnosis and improvement of saline and alkaline soils, U.S. Department of Agriculture Hand Book Copyright to IJIRSET DOI: /IJIRSET


7 Copyright to IJIRSET DOI: /IJIRSET


8 Copyright to IJIRSET DOI: /IJIRSET
9 S.No Stations Ec TA TH Ca Mg Na K SAR Na% RSC µ/mhos mg/l mg/l mg/l mg/l mg/l mg/l Meq/L Meq/L Meq/L 1 S S S S S S S S S S S S S S S S S S S S S S S S S S S S S S S S S S S S S S S Copyright to IJIRSET DOI: /IJIRSET
10 40 S S.No Stations Ec TA TH Ca Mg Na K SAR Na% RSC mhos/cm mg/l mg/l mg/l mg/l mg/l mg/l Meq/L Meq/L Meq/L 41 S S S S S S S S S S S S S S S S S S S S Copyright to IJIRSET DOI: /IJIRSET