Delivering on the Paris 1.5 C and 2 C commitments
|
|
|
- Oscar Houston
- 5 years ago
- Views:
Transcription

1 Delivering on the Paris 1.5 C and 2 C commitments web: kevinanderson.info Kevin Anderson Professor of Energy & Climate Change
2 Backdrop to Paris
3 Backdrop to Paris The mitigation message has changed little in the last twenty five years Annual emissions ~60% higher than at time of the first report in 1990
4 Backdrop to Paris: the latest IPCC reports in terms of temperature (2 C) rise by 2100, it s carbon budgets that matter, not long-term (2050) targets i.e. the more we emit today the less we can emit tomorrow with fundemental political repercussions
5 Thinking of this graphically
6 80 70 CO Carbon 2 emissions dioxide emissions (GtCO 2 /yr)
 is the area under the curve 0 1990 2000 2010 2020 2030 2040 2050")
7 80 CO Carbon 2 emissions dioxide emissions (GtCO 2 /yr) The carbon budget (e.g. for 2 C) is the area under the curve
 70 60 50 40 30 20 10 The carbon")

8 80 CO Carbon 2 emissions dioxide emissions (GtCO 2 /yr) The carbon budget (e.g. for 2 C) is the area under the curve The Carbon Budget
9 CO Carbon 2 emissions dioxide emissions (GtCO 2 /yr) If we delay stringent mitigation today We emit additional CO 2 A A


 B 0 1990 2000 2010 2020")
10 80 CO Carbon 2 emissions dioxide emissions (GtCO 2 /yr) A which must be compensated later B (if possible!) B

11 80 70 CO Carbon 2 emissions dioxide emissions (GtCO 2 /yr) A with much higher rates of mitigation B
12 Returning to the Paris Agreement
13 Paris Agreement


14 Paris Agreement An important diplomatic triumph

15 Paris Agreement An important diplomatic triumph hold the increase in global average temperature to well below 2 C above pre-industrial levels and pursue efforts to limit the temperature increase to 1.5 C to undertake rapid reductions in accordance with best science on the basis of equity, and efforts to eradicate poverty.
16 Issues with the Paris Agreement no reference to fossil fuels or decarbonisation aviation and shipping exempt from any action voluntary pledges (INDCs) equate to 3 to 4 C no major review of INDCs until ~2023; i.e.~300 billion tonnes of CO 2 from now fundamental reliance on highly speculative negative emission technologies
17 80 Carbon dioxide from fossil fuel & cement (GtCO2yr-1) Before Paris 4 C to 6 C GCP new data YEAR
18 80 70 Carbon dioxide from fossil fuel & cement (GtCO2yr-1) Pledges (INDCs) ~3 C to 4 C GCP new data YEAR
19 80 70 Carbon dioxide from fossil fuel & cement (GtCO2yr-1) Pledges (INDCs) ~3 C to 4 C 2 C GCP new data YEAR

20 80 70 Carbon dioxide from fossil fuel & cement (GtCO2yr-1) What does this mean for our energy system? GCP new data YEAR
 60 50 40 30 20 10 Deep Cuts in Energy")

21 80 70 Carbon dioxide from fossil fuel & cement (GtCO2yr-1) Deep Cuts in Energy Demand Pledges (INDCs) ~3 C to 4 C Supply & demand 2 C GCP new data YEAR
22 80 70 Carbon dioxide from fossil fuel & cement (GtCO2yr-1) well below 2 C & pursue 1.5 C on the basis of equity GCP new data YEAR
23 Returning to IPCC s Carbon budgets In 3 to 13 years we ll use all the 1.5 C energy-co 2 budget Pledges not reviewed in depth till 2023 from a budget perspective Is it now too late for 1.5 C?
24 and for 2 C? 66% chance of 2 C is lost 50% demands a war-like footing on mitigation - now 33% demands mitigation beyond anything discussed in Paris
25 What s this mean for poorer & richer nations?
26 Poorer/industrialising nations: 1. Collectively peak their emissions by Then rapidly increase mitigation to ~10% p.a. by Fully decarbonise their energy systems by ~2050
27 then, for 2 C, wealthy nations require: At least 10% reduction in emissions year on year from now, i.e: 50% reduction by ~2020 (c.f. 1990) 75% ~ % ~2030 Zero carbon energy by ~2035 Cf. EU s submission to Paris 40% by 2030


28 How can this fit with the Paris euphoria?

29 by pulling a rabbit from the magician s hat
30 by pulling a rabbit from the magician s hat Negative emissions technologies (NETs) i.e. suck CO 2 directly from the atmosphere by 2030 & beyond
31 by pulling a rabbit from the magician s hat Negative emissions technologies (NETs) BECCS biomass energy with carbon capture & storage: Grow trees/plants they absorb CO 2 through photosynthesis burn trees in powerstations capture the CO 2 from the chimney ~liquefy the CO 2 & pump it underground store for many 1000s of years
32 by pulling a rabbit from the magician s hat Negative emissions technologies (NETs) BECCS biomass energy with carbon capture & storage: Never worked at scale huge technical & economic unknowns major efficiency penalty limited biomass availability (fuel or food?) large biodiversity impacts
33 by pulling a rabbit from the magician s hat BECCS level of inclusion in government means : - planting 1 to 3x the area of India - year after year; decade after decade - store 100s of billions of tonnes of CO 2 - securely underground for 1000s of years


34 or the equivalent of adding another biosphere! + absorbs ½ of anthropogenic annual CO 2 i.e. oceans & plants absorbs ~20GtCO 2 /yr. BECCS is set to absorb 10 to 20GtCO 2 /yr i.e. up to another planet s worth of biospere
35 So Paris, some Academics & Politicians rather than focus on urgent & deep mitigation now with challenging political & economic repercussions prefer to rely on non-existent negative emission technologies to suck huge quantities of CO 2 from the air in the future
36 So if 2 C is too challenging, 4 C? what about 3 to


37 Global impacts: 4 C Hottest days +8 C +6 C C


38 Global impacts: 4 C Food crops 40% reduction in maize & wheat yields in low latitudes. 30% decrease in rice yields
39 There is a widespread view that 4 C is Incompatible with an organised global community Beyond adaptation Devastating to eco-systems Highly unlikely to be stable ( tipping points ) consequently 4 C should be avoided at all costs
40 Returning to 2 C is it still a viable goal?
41 Hypothesis: yes just Technology: Supply: decadal timeframe Demand: near term options Equity: immediate & near-term
42 Technology: saviour of the status quo?

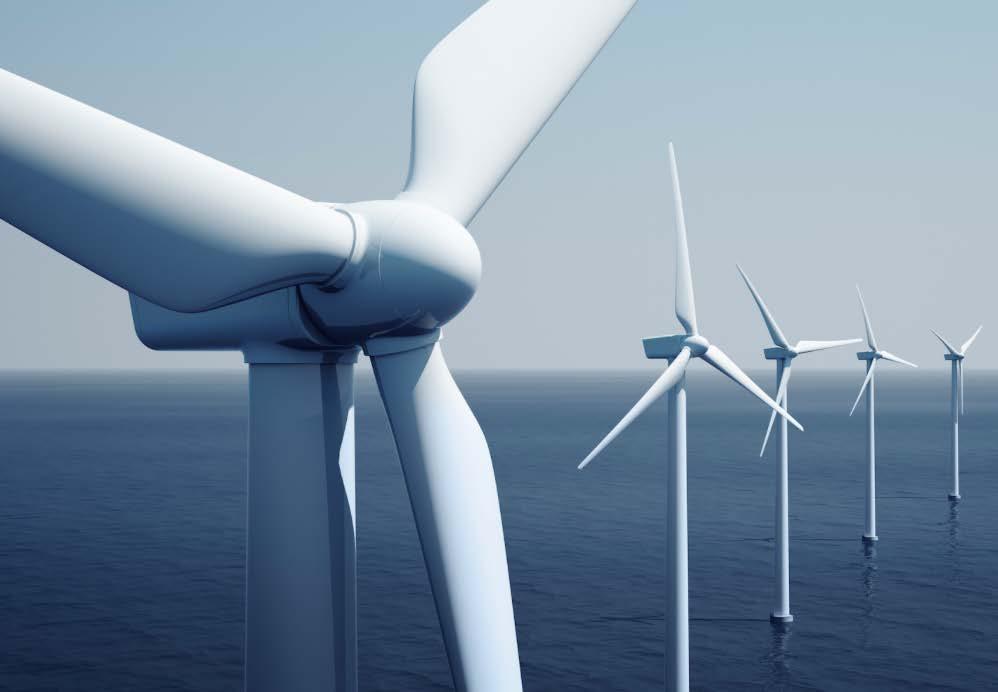

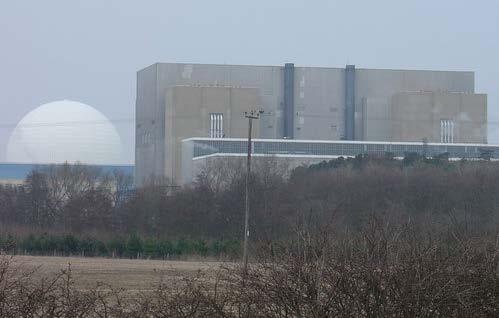
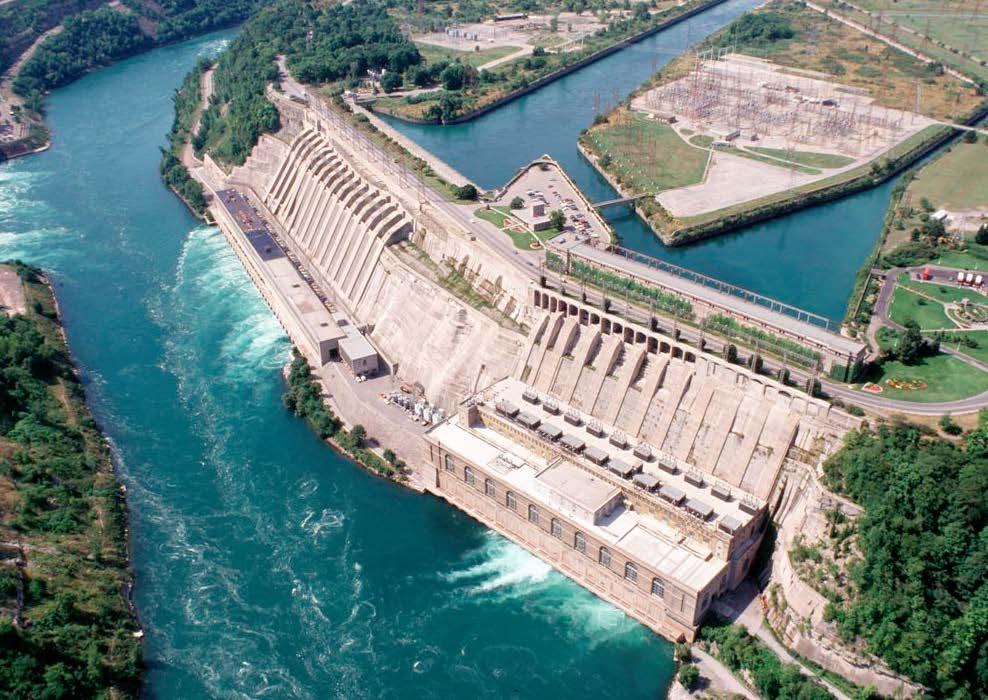
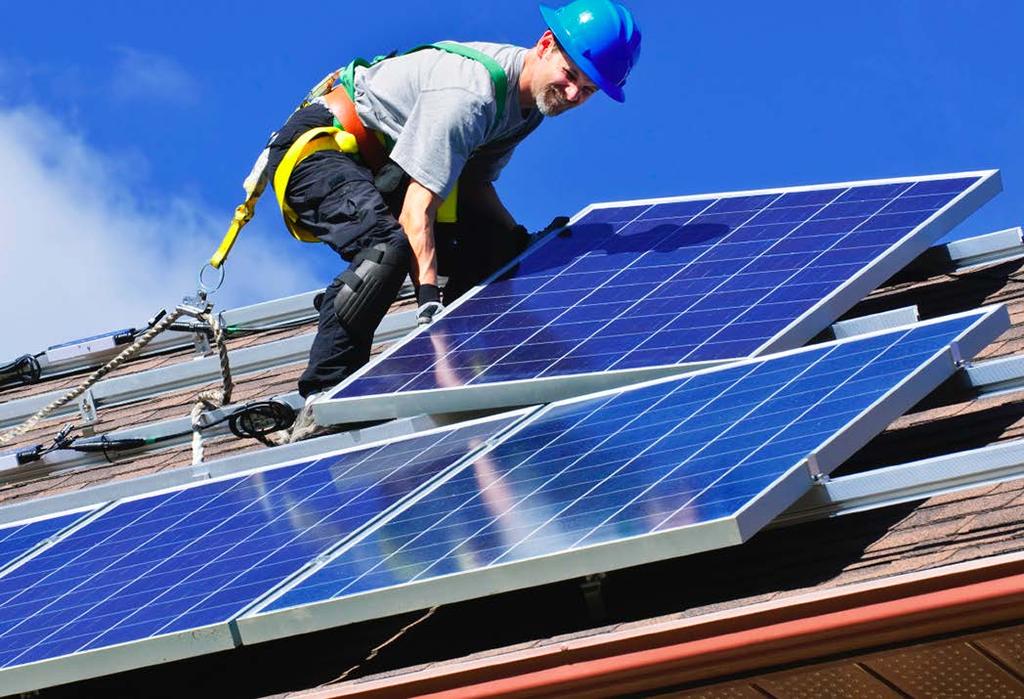
43 SUPPLY: low-co 2 electricity Tidal Wave Biomass (CCS?)
44 SUPPLY: low-co 2 energy But, electricity is typically 20% of final energy demand So also need a massive programme of electrification
45 DEMAND: opportunities for near-term mitigation The example of private cars: EU & US ~12-15% of emissions ~270 petrol/diesel models <100gCO2/km at no price premium 2/3 of car travel is by vehicles 8yrs old or younger
46 DEMAND: opportunities for near-term mitigation Set a stringent CO 2 Standard then even existing models of petrol/diesel cars - With no additional capital cost - Reduced operating cost - Identical infrastructure - Same employment & companies could deliver 50% to 70% reduction in ~10yrs NB: walking, cycling, public transport, electrification & less travel are all important
47 DEMAND: opportunities for near-term mitigation More generally Establish stringent efficiency standards Tighten year on year Providing long-term & dynamic market signal Industrialised/wealthy nations: - power-down energy demand by 40 to 70% in around 10 years (NB: accompanying policies to address issues of rebound are essential)
48 Beyond technology But: Technology (supply & demand) alone cannot deliver on the Paris budgets Rapid & deep changes in what we do, how we do it & how often we do is now critical
49 Equity: CO 2 asymmetry & mitigation
50 EQUITY: extreme emission asymmetry ~50% of global CO 2 comes from ~10% of the population Top 1% of US emitters (~3.4 million people) have CO 2 footprints 2500x higher than bottom 1% globally (~70 million)
51 EQUITY: extreme emission asymmetry if the top 10% of global emitters were to reduce their carbon footprint to the level of a typical EU citizen Global CO 2 emissions would be cut ~33%


52 So, who is in this key 10% group?

53 So, who is in this key 10% group?

54 So, who is in this key 10% group?
55 EQUITY: frames a new agenda for mitigation Most of the 7 billion have little scope to reduce emissions There is huge asymmetry in responsibility Rapid & near-term reduction in CO 2 from top 10% of emitters Real opportunity for leading by example And thereby catalysing system-change
56 A Radical Plan for 2 C two phases 1. Deep reductions in energy demand from now to ~2030 by the high emitters 2. Marshall-style build programme of zero carbon energy supply with 100% penetration by 2050
57 Sweden Targets: 50% chance of 2 C Optimistic budget (336MtCO 2 ) 70% reduction of CO 2 by 2025 (c.f. 2016) 95% 2035 i.e. around 12% p.a. starting now Cautious budget (168MtCO 2 ) >90% by 2025 ~99% by 2035 i.e. around 25% p.a. starting now NB: much tighter still for well below 2 C & tighter again for 1.5 C
58 Tack så mycket web: kevinanderson.info Kevin Anderson Professor of Energy & Climate Change