Distribution Reservoir Management: Evaluating & Maintaining Water Quality in Reservoirs & Tanks
|
|
|
- Horatio Simon
- 5 years ago
- Views:
Transcription

1 Distribution Reservoir Management: Evaluating & Maintaining Water Quality in Reservoirs & Tanks Cheryl Capron Seattle Public Utilities PNWS-AWWA Conference May 2013
2 Resources
 Great Lakes Upper Mississippi River")

3 Recommended Standards For Water Works (10 States Standards) Great Lakes Upper Mississippi River Board of State & Provincial Public Health & Environmental Managers Chapter 7, Finished Water Storage
4 Ten States Standards Chapter 7 Protection from contamination & trespassers Drains Stored water age Overflow Access Vents Silt Stops

5 WDOH On-line Resources Washington Water System Design Manual Chapter 9, Reservoir Design & Volume Section 9.6, Reservoir Appurtenant Design Sanitary Protection of Reservoirs /DrinkingWater/WaterSystemDesignandPlanning/Syst emdesign.aspx

6
7 Oregon & Idaho Idaho incorporates 10 States Standards as a reference Oregon Construction Standards OAR (6) Finished Water Storage DrinkingWater/Rules/Documents/ pdf Your regulators
8 Looking For Trouble
9 Assess Potential for Problems Does the reservoir have a common inlet/outlet? Does it have an internal circulation system? How old is it? Does it meet the current Ten States Standards?
10 Assess Potential for Problems Where is this tank in relation to its source? To its service area? What is the hydraulic relationship to other tanks in the zone? Is this tank filled by gravity or pumping? Is there an altitude valve? How is it used?
11 Hydraulic Relationships
12 Poor Turnover Too much storage, at far end of zone from pump Most of the pump discharge goes directly to zone Drawdown is back towards pump; the same slug of water can flow back & forth into the reservoir
13 Good Turnover Storage in center of pressure zone Most of pump discharge goes directly to reservoir Most of draw-down goes to zone away from pump
14 Hydraulic Relationships Two tanks in the zone, with an altitude valve on the tank closest to the pump station. The tank with altitude valve turns over less often, because the valve stays closed until the other tank fills and the pump shuts off.
15 Circulation and Turnover How low can you go? How often? The lower you can draw down, the faster you can turn it over Minimum pressure & emergency storage requirements Freezing weather cycles may be different Optimizing pump and energy use could mean longer run-times & less turnover in the tank, because the pump, not the tank, meets the demand


16 Water Characteristics What s in your water? I have: Unfiltered surface water Algae & critters Sphaerocystis Higher DBPs in areas downstream of floatingcovered reservoirs Daphnia


17 Water Characteristics Sediments from unlined cast iron pipe settle out in storage Before & after cleaning (4 year cycle)
18 How Do You Find Problems?
")
19 Water Quality Monitoring Cl2 residual Water temperature T&O samples TCR monitoring Non-routine coliform samples HPC (heterotrophic plate count)


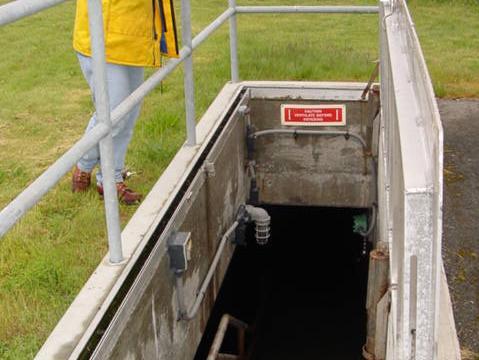
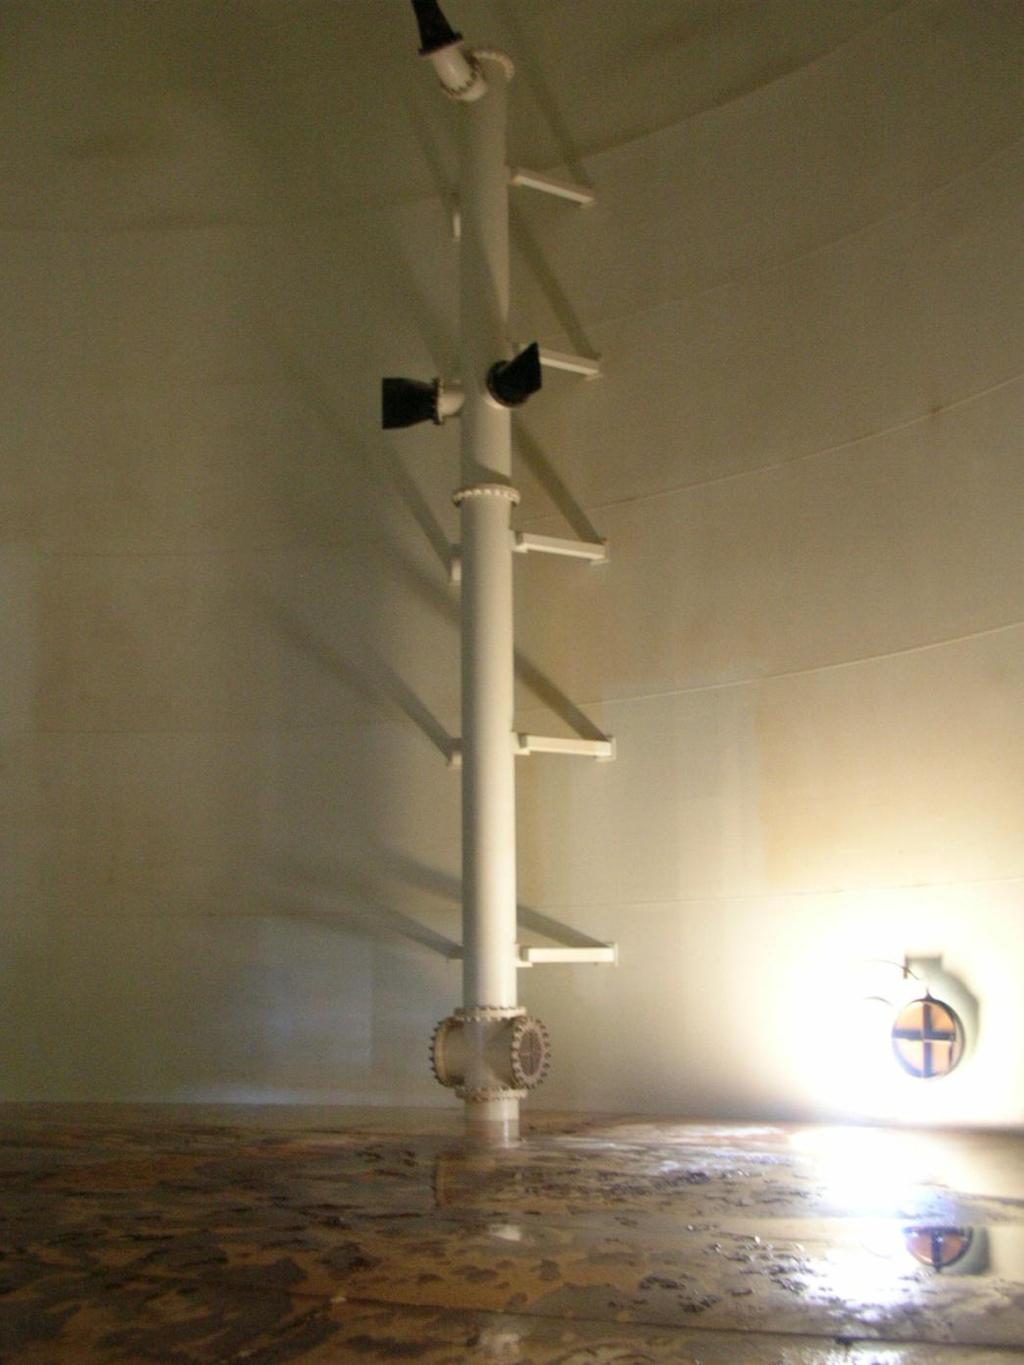
20 Know the Sample Point The hole in the wall is the end of the sample tap, 3 off the floor in a 40 high standpipe.

21 Multiple Level Sample Lines Multiple taps give you a better picture of the entire tank Knowing the sample point can help explain results that may not make sense at first


22 Multiple Tap Sample Cabinet Transducer on left Multiple sample taps Sodium hypochlorite can be injected into tank through sample valves


23 Chlorine Residual - Grab Sample It s quick - no fancy equipment or analysis Basic data establishes a normal range Indicates what effect changes have had
24 mg/l Display Your Data Grab Sample Cl2 Residual Charlestown Standpipe New PS & circ system on line SP replaced Aug-87 May-90 Jan-93 Oct-95 Jul-98 Apr-01 Jan-04 Cl2 Res
25 Water Temperature Monitoring As temps rise, Cl2 residual drops The warmer the water, the higher the chances are for microbial activity Tank temperatures that are warmer than normal or watermain temperatures may be a sign of poor turnover or stratification

26 How Often Do You Taste Your Product?


27 If You Can Taste The Difference You can do an informal analysis on your water. Just keep notes so you know how it s changing from one time to the next.
28 Taste & Odor Samples Changes in taste and odor signal other changes in water quality Comparing the taste of the water in the tank with the taste of the source water will help you figure out if an event is system-wide or developing in the tank Don t taste raw water samples until they ve been chlorinated!
29 TCR Monitoring Analyze data you already have Plot Cl2 residual on a system map Plot positive TC samples on a system map How were you using your pumps then? How did you cycle your tanks then? Were there any low pressure and/or high flow events? Did the tank influence the system, or is it the other way around?
30 Informational Coliform Samples Not required by your TCR monitoring plan Results do not have to be reported

31 HPC Samples HPC indicates other microbial activity. Elevated HPCs in samples with good Cl2 residual are cause for concern. A tank with HPCs like this is way overdue for cleaning (This example is a raw water sample.)

32 Go Outside! Physical Integrity Corrosion, leaks Security Verify no breaches Photo courtesy of Steve Deem, WDOH Sanitary Water quality Prevent contamination
33 Visual Inspections Quarterly at ground level Sample taps & tubing Evidence of nests Loose or missing screens Holes in screens Mice can get through a ¾ size gap Screen mesh size Air gaps Annually on top of elevated tanks Hatches Penetrations Roof drains Vent screens

34 Animals in the tank are the most likely source of contamination. Repair loose or missing vent & overflow screens Securely patch holes in screens Look for nests

35 Bird feces and other contaminants on the roof can be washed into the tank. Clean off roof & unplug drains Repair leaking hatch covers & seals Patch holes corroded in roof


36 Vent Screens Courtesy of Steve Deem, WDOH


37 Reservoir Vents and Hatches Courtesy of Steve Deem, WDOH


38 Reservoir Hatches Courtesy of Steve Deem, WDOH


39 Roof penetration Reservoir Roofs Clean & Clear Courtesy of Steve Deem, WDOH


40 Bird Carcass Near Roof Penetration Courtesy of Steve Deem, WDOH


41 What s It Look Like Inside? Is This Normal? Are Those Salamanders? Courtesy of Steve Deem, WDOH

42 Open The Hatch Before The Sanitary Survey Botryococcus a type of algae


43 Overflow & Drain Air Gaps Courtesy of Steve Deem, WDOH
44 Troubleshooting Using Water Temperature & Chlorine Residual Data
45 Richmond Highlands Tanks Each tank has its own inlet/outlet line Both tanks are connected to the same feeder line Each tank has sample points Sample stand A2 is across the street
46 mg/l Celsius Cl2 Residual vs. Water Temp Richmond Highlands Tank South Oct Mar Jul-98 6-Dec-99 RHTS Cl2 RHTS Temp
47 Celsius Water Temperatures Richmond Highlands Tanks vs Sample Stand A Oct-95 Mar-97 Jul-98 Dec-99 RHT North RHT South A2
48 mg/l Chlorine Residuals Richmond Highlands Tanks vs Sample Stand A Oct-95 May-96 Dec-96 Jun-97 Jan-98 Jul-98 Feb-99 Aug-99 RHT North RHT South A2
49 Possible Causes South tank is larger, with less turnover Something is inside the south tank and is creating chlorine demand Inconsistency in sample collection The north tank is shaded by the south tank, and therefore cooler
50 What Next? Cl2 residual on a different tap on the south tank was the same as in the north tank During tank cleaning at the end of 1998, we found the end of the sample piping in the south tank was near the overflow & usually out of the water We lowered the collection point by 15 Since then, north & south Cl2 are very close
51 Case Study High HPCs in Multiple Tanks
 2 tanks 0.2-0.3 mg/l 3 tanks >0.")
52 Samples Month-end samples from five tanks had HPCs ranging from 70 to >5700 (0 is normal) 2 tanks mg/l 3 tanks >0.5 mg/l Tank water temps were 14C - 15C
53 First Steps Re-sampled to confirm unusual results and eliminate sampling or lab error Confirmed there were no errors in collection or analysis
54 First Steps Assessed operating conditions Cl2 was 0.7 mg/l in mid-month samples Watermain temps were 15C-16C Tanks were cycling well No significant changes in operation since midmonth samples were collected Distribution system HPCs were normal
55 Preliminary Analysis Tank & watermain temps are consistent, indicating tanks are being well-cycled confirmed by SCADA data & presence of Cl2 residual Occurrence in multiple tanks over a wide area & over several pressure zones points to a problem with the supply, not with the individual tanks
56 Preliminary Conclusions With no change in treatment dosages at the source, or in system operations, lower tank Cl2 residual is probably the result of higher Cl2 demand. What would cause higher Cl2 demand? Lower velocities or longer residence time in tanks are providing favorable conditions for microbial activity.
57 Analyze Supply Operations What do these tanks have in common? All were receiving unfiltered water from from same source. Tanks were fed either directly from source pipelines, or via reservoirs with no booster Cl2. Other tanks in these areas downstream of booster Cl2 had no HPCs.

58 Additional Lab Analysis HPCs in 4 of the 5 re-samples had declined dramatically; the 5th sample had a significant increase. Routine source water sampling indicated a high zooplankton population.
59 Conclusions The elevated HPCs in the tanks were most likely associated with the high amount of zooplankton in the source water. The source is unfiltered. Parts of the zooplankton remained intact, & traveled through the system. HPCs may have indicated re-growth. Where available, booster Cl2 controlled it.
60 Conclusions The event was nearly finished moving through the system at the time re-samples were collected. The re-sample with higher HPCs was from the tank farthest from the source.
61 Follow-up Actions Continue to monitor zooplankton in source and HPCs in tanks. Manually boost Cl2 in tanks if HPCs do not decline. Revise system operations to route water through existing booster Cl2 points.
62 Follow-up 2 weeks later, the last tank with HPCs had none 4 weeks later, HPC in that tank was 457 Next step - sample from all 3 taps to eliminate problem with tap and determine how widespread it is in tank If necessary: Disinfect tank &/or sample taps Drain & clean
63 Steps to Improvement


64 Don t just watch things happen!

65 Rooftop every year Ground-level every 1-3 months Fix the little problems before they get big

66 Operational Move the water Cycle deeply & frequently Maintain Cl2 residual Boost at tank Boost at source
67 Examples of Structural Changes
68 Charlestown SP Before Replacement

69 Charlestown SP After Replacement & New PS

70 Tideflex Mixing Systems
71 Mechanical Recirculation Mixing System NaOCL Inlet Outlet
72 Questions? Phone (206)