Overview of the Social Impact Monitoring and Vulnerability Assessment (SIMVA) : Introduction, Approach, Indicators
|
|
|
- Erika Dorsey
- 5 years ago
- Views:
Transcription
 Symposium Ho Chi Minh City, Viet Nam 1-2 July")
1 Overview of the Social Impact Monitoring and Vulnerability Assessment (SIMVA) : Introduction, Approach, Indicators The 2 nd MRC-Ecosystem Study Commission for International Rivers (ESCIR) Symposium Ho Chi Minh City, Viet Nam 1-2 July 2015

2 Background SIMVA is a part of the overall MRC environmental monitoring systems. It is to provide regular information on the status and trends of the social conditions of the people in the Basin as well as on social vulnerability linked to changes in water resources. SIMVA activity has been introduced since 2004: Phase 1: was an extensive literature reviews Phase 2: was a preliminary or pilot survey to determine the validity of indicators and research tools Phase 3: was a baseline survey for the LMB corridor, applying the methodology developed in Phase2.
3 Cycle of SIMVA activity
 The 3S confluence in Cambodia as a tributary sub-zone")
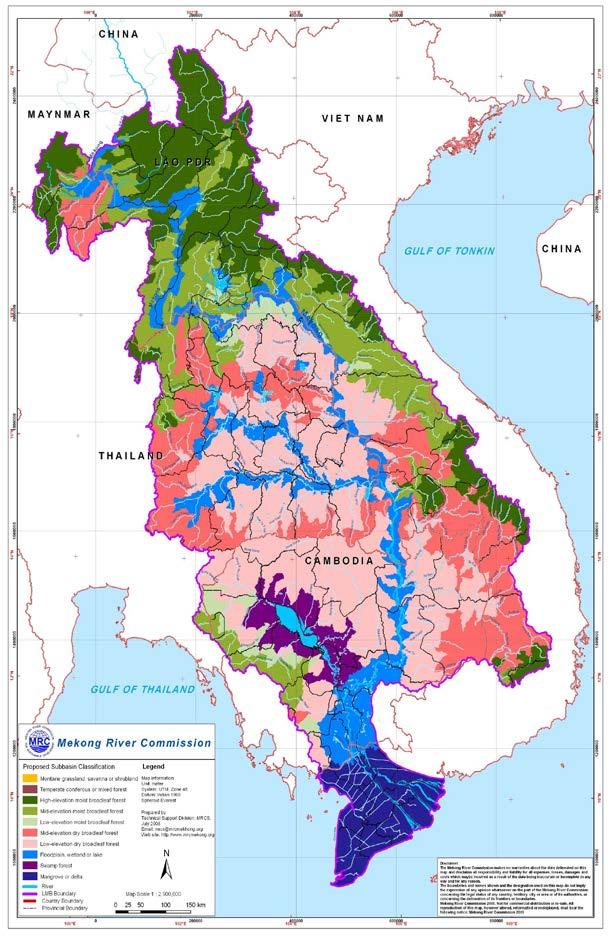
4 Scope of monitoring and assessment The study area is covered in 5 Socio-ecological zones and 13 sub-zones. 15 Km of the buffer on each side of the Mekong mainstream All those areas inundated by peak flood of 2002 Major wetlands (Songkhram & Tonle Sap) The 3S confluence in Cambodia as a tributary sub-zone Examples: SIMVA 2011 Baseline : 2,720 sample household survey, 136 sample villages. SIMVA 2014: Shocks and Trends : 5, 632 sample household survey, 352 sample villages, 25 focus group discussions.
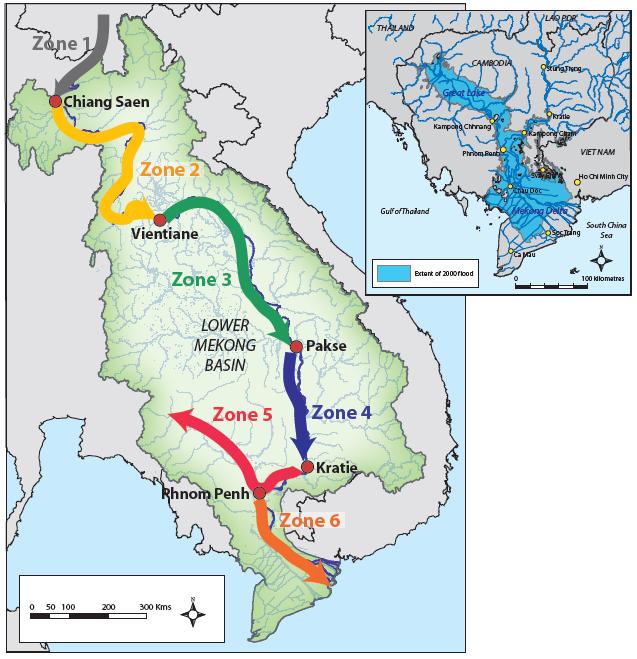
5 5 Allocation of sample size to zones and sub-zones Hydro-ecological zone Zone 1 Zone 2 Description: IBFM Description: SIMVA Social survey sub-zones Lancang, China Lancang, China n.a. From Chinese border to Vientiane (Upstream) From Chinese border to Vientiane (Upstream) Zone 2 - Lao - Mainstream Zone 2 B - Subzone Upper Thailand Zone 2 C - Subzone Lower Thailand Zone 3 From Vientiane to Pakse From Vientiane to Lao- Cambodian border Zone 3 A - Subzone Lao - Mainstream Zone 3 B - Subzone Thailand - Mainstream Zone 3 C - Subzone Thailand - Songkhram Zone 4 From Pakse to Kratie From Lao-Cambodian border to Cambodian-Vietnamese border Zone 4 B - Subzone Cambodia - 3S Zone 4 A - Subzone Cambodia - Khone Falls to Kratie Zone 4 C - Subzone Cambodia - Kratie to Vietnam border Zone 5 From Kratie to Phnom Penh (upstream), incl. Tonle Sap From Phnom Penh up to and including Tonle Sap lake Zone 5 A - Subzone Cambodia - Tonle Sap river Zone 5 B - Subzone Cambodia - Tonle Sap lake Zone 6 From Phnom Penh to South China Sea (the Delta) From Cambodian-Vietnamese border to sea (the Delta) Zone 6 A - Subzone Vietnam - Mekong Delta - freshwater Zone 6 B - Subzone Vietnam - Mekong Delta - saline
6 Approach/Method
7
8 Sampling Selection Procedure for SIMVA Household Survey 8 Regional Countries Zones Sub-Zones Villages Households Equal allocation of sample size to each country Proportionate allocation of sample size from the country to each zone Proportionate allocation of sample size from zone to each sub-zone Probability proportional to Size (PPS) sampling Systematic Sampling Selection (SSS)
9 Example: Data collection tools and methods (Baseline Survey 2011) Primary data collection Household survey 2,720 samples (from 136 villages, 20 households per village) using villages (clusters) randomly selected with probability proportional to size (PPS). Systematic sampling based on household lists for 20 households selection Secondary data collection Vulnerability indicators (fertility rate, household size, dependency ratio, child malnutrition, infant mortality rate, poverty rate, employment in agriculture, education ) Using Landscan global population data GIS analysis and mapping
10 Example: Study design for the SIMVA 2014: Shocks and Trends Data collection tools and methods Village Profiles Covering 352 sample villages. Household Survey Covering up to 5,632 sample households. (16 households/village) Qualitative Study of Trends over the past 10 years Covering 28 villages (proposed) near MRC monitoring locations - could be included as sample villages for the survey. 3 key informants in each village. Questionnaire based Include basic socio-economic information at community level, including available services and infrastructure. Focus on impacts from floods, droughts and extreme weather Include question about adaptation to weather related changes. Include information on socioeconomic variables Focus on impacts from floods, droughts and extreme weather Include questions on coping strategies and adaptation - household level. Include Village Profiles for study villages. Participatory method with Focus Groups. Community event timelines for past 10 years. All types of important events can be included, but focus on water related events. 10 year trajectories of community events on a community well being scale. Matrix of Event, Impact, Cause, Coping Strategy.

11 Time dimensions of the 3 SIMVA data collection tools 10 year trends Qualitative Participatory Study producing village event timelines for the past 10 years Present and past 3 years and 12 months - village level Village Profiles - socio-economic conditions and water resource utilization and flooding at present and over the past 3 years and the last 12 months Present and past 3 years and 12 months - households Household Survey - socio-economic conditions and water resource utilization and flooding situation over the past 3 years and the last 12 months
12 SIMVA Overall Indicators: Vulnerability context Dependence on Fish Dependence on Other Aquatic Animals (OAAs) Dependence on irrigation and riverbank cultivation Resilience Shocks and trends Climate change related social vulnerabilities
13 Example: List of Indicators for the SIMVA 2014: Shocks and Trends Shocks and trends (and climate change related social vulnerability) 1. % of HHs whose primary domestic water resources run dry for more than x weeks in the dry season 2. % HHs reporting water shortage that resulted in crop damage in last 12 months 3. % of HHs reporting water excess that resulted in crop damage in last 12 months 4. % of population dependent on climate-dependent resources (agriculture, fisheries, aquaculture) 5. % of population with low resilience, but high dependence on climate related resources
14 6. % of loss of rice due to floods, droughts, and/or other forms of weather extreme 7. % of livestock loss due to floods, drought and/or other forms of weather extreme 8. Value of livestock lost due to floods and drought & other forms of weather extreme 9. Average values of property losses due to floods, droughts, & other forms of weather extreme 10. Most frequently used coping strategies for floods, droughts & other forms of weather extreme 11. % of HHs experience water related health problems in last 12 months such as access to clean drinking water, access to sanitation etc.
15 Dependence on fish 12. % of adult whose main occupation is fishing 13. % of HHs whose most important occupation is fishing 14. % of HHs whose 2 nd most important occupation is fishing 15. % of HHs with members who fished in last 12 months 16. % of HHs using mainstream/tonle Sap in last 12 months for fishing 17. Fish consumption in last 24 hours (kg per person)
16 Dependence on OAAs 18. % of HHs that collect OAAs in last 12 months 19. % of HHs collecting OAAs from source that depend on Mekong flooding/irrigation in last 12 months 20. OAA/P consumption in last 24 hours (kg per person) Dependence on irrigation and riverbank cultivation 21. Average riverbank or island cultivated land size of HH 22. % of HHs dependent on water extracted from the Mekong for irrigation in last 12 months 23. % of HHs rice produced under irrigation 24. % of HHs with riverbank cultivation 25. % of total riverbank or island cultivated productivity sold in the last 12 months
17 Resilience 26. % of HHs with non-aquatic sources of income 27. % of adult HH members working outside the village 28. % of HHs engaged in aquaculture 29. % saying they have alternative livelihood options
18 Thank you.