Interpreting Multidimensional Poverty Results. Mauricio Apablaza based on Sabina Alkire slides.
|
|
|
- Anastasia Simon
- 5 years ago
- Views:
Transcription

1 Interpreting Multidimensional Poverty Results Mauricio Apablaza based on Sabina Alkire slides.
2 Motivation
3 Policy Interest Why? 1. Intuitive easy to understand 2. Birds-eye view - can be unpacked a. by region, ethnicity, rural/urban, etc b. by indicator, to show composition c. by intensity to show inequality among poor 3. Adds Value: a. focuses on the multiply deprived b. shows joint distribution of deprivation. 4. Incentives to reach the poorest of the poor 5. Flexible: you choose indicators/cutoffs/values 6. Robust to wide range of weights and cutoffs 7. Academically Rigorous
4 Choose the purpose Choose the Unit Last week
5 otherwise...
6 then Choose the purpose Choose the Unit Choose the dimensions Choose of indicators Choose deprivation cut-off of each dimension Choose of weights Choose poverty cut-off (Poverty line) And finally...

7 then STATA
8 Understanding
9 MD Poverty Statistics: What do you need to understand? k = poverty cutoff M 0 (sometimes called MPI) H = Headcount Ratio A = Intensity h j = Censored Headcount (each indicator) j = Percent Contribution (each indicator) Vulnerability and Severe MPI All of the above, by subgroup
10 Multidimensional Data Matrix of well-being scores for 4 persons in 4 dimensions Who is deprived in what? Income Years of Education Housing Index Malnourished No Ana y = Yes Joao Yes Maria No Antonio z = No
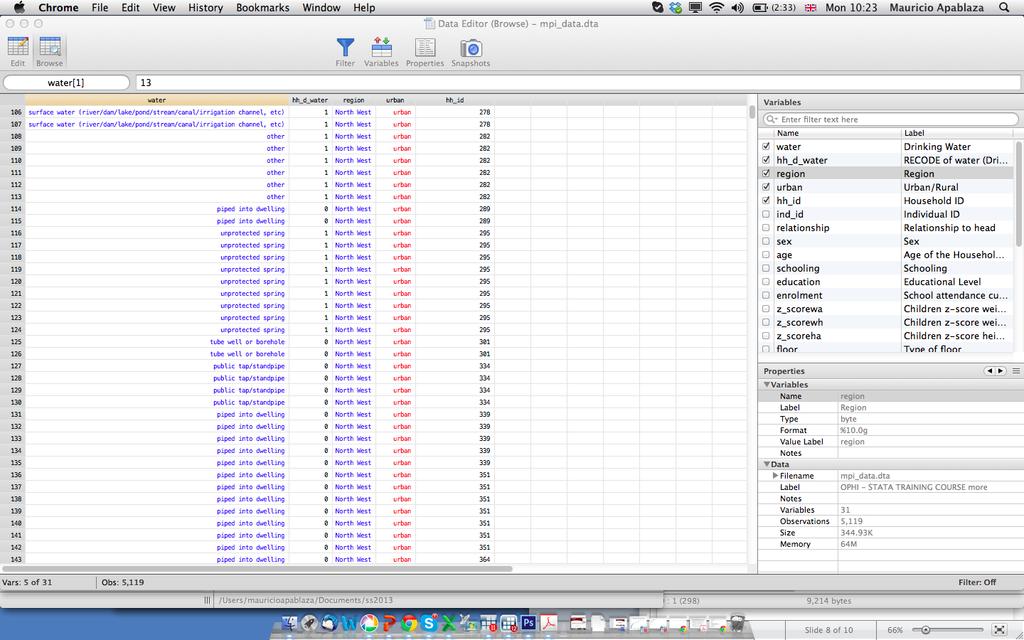
11 . tab water [aw=weight], miss!! Drinking Water Freq. Percent Cum.! ! piped into dwelling ! piped to yard/plot ! public tap/standpipe 1, ! tube well or borehole 1, ! dug well/protected well ! dug well/unprotected well ! protected spring ! unprotected spring ! rainwater ! tanker truck ! cart with small tank ! surface water (river/dam/lake/pond/stre ! bottled water ! other ! ! Total 5, !
12 Achievement Matrix Matrix of well-being scores for 4 persons in 4 dimensions Who is deprived in what? Income Years of Education Housing Index Malnourished No Ana y = Yes Joao Yes Maria No Antonio z = No
13 Deprivation Matrix Replace entries: 1 if deprived, 0 if not deprived Income Years of Education Housing Index Malnourished Ana g 0 = Joao Maria Antonio z = No
14 . tab water hh_d_water [aw=weight], miss!! RECODE of water! (Drinking Water)! Drinking Water 0 1 Total! ! piped into dwelling ! piped to yard/plot ! public tap/standpipe 1, , ! tube well or borehole 1, , ! dug well/protected we ! dug well/unprotected ! protected spring ! unprotected spring ! rainwater ! tanker truck ! cart with small tank ! surface water (river/ ! bottled water ! other ! ! Total 4, , ,119!!!
15
16 Deprivation Matrix Replace entries: 1 if deprived, 0 if not deprived Income Years of Education Housing Index Malnourished Ana g 0 = Joao Maria Antonio z = No
17
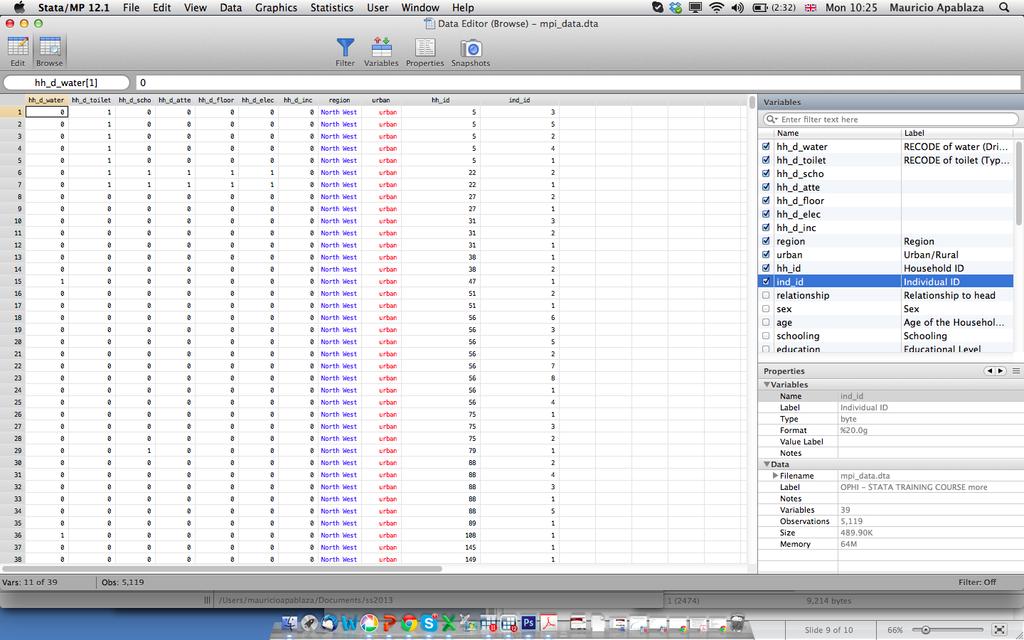
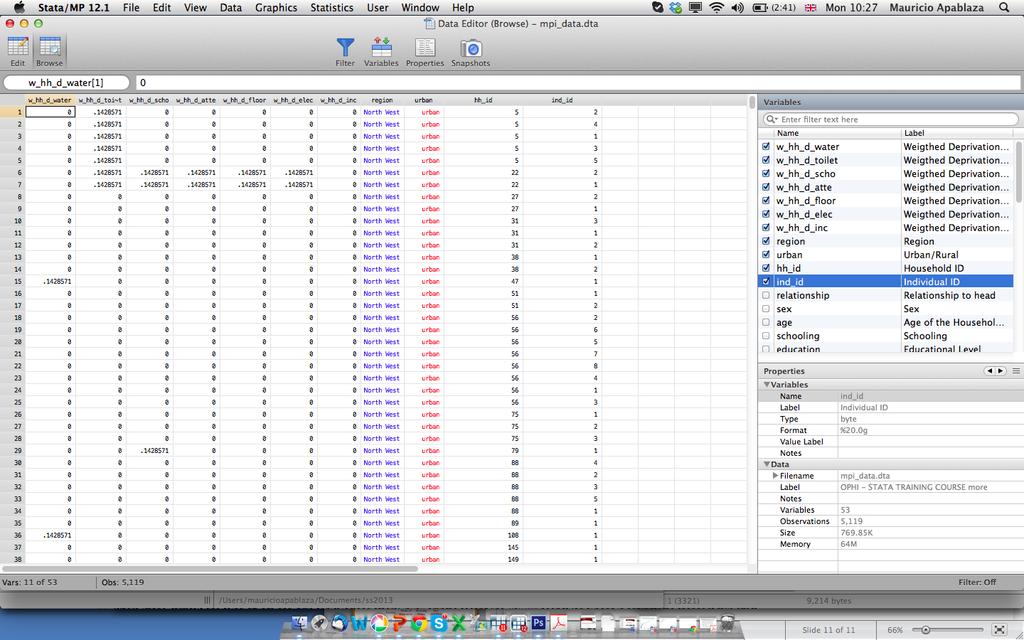
18 Weighted Deprivation Matrix Replace entries: 1 if deprived, 0 if not deprived Income Years of Education Housing Index Malnourished Ana W_g 0 = Joao Maria Antonio z = No
19
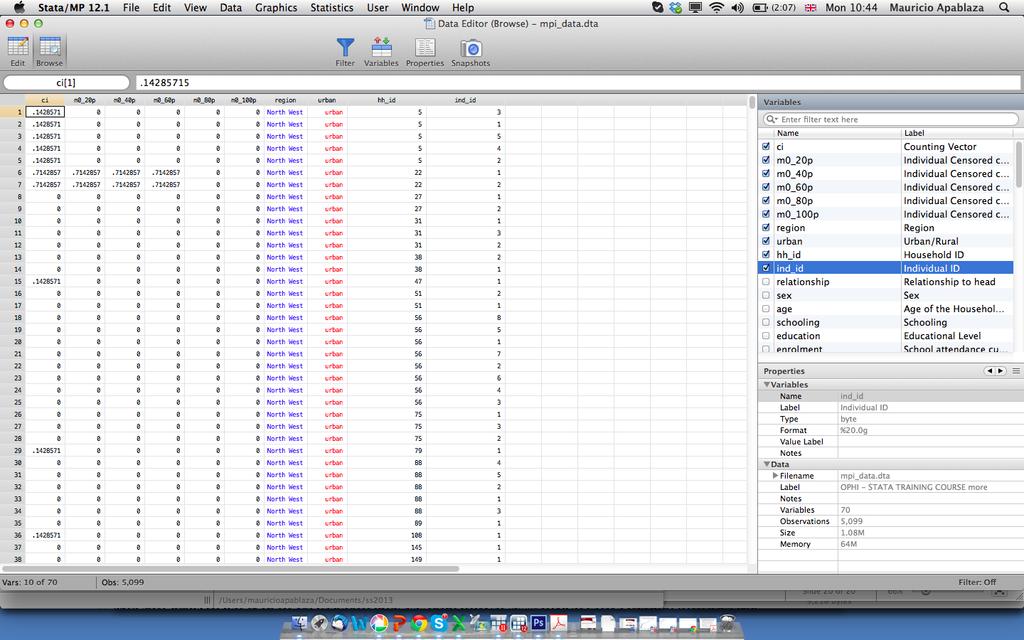
20 Counting Vector Income Years of Education Housing Index Malnourished C_vector Ana W_g 0 = Joao Maria Antonio
21
22 Identification (Headcount) W_g 0 = Income Years of Educatio n Housing Index Malnourishe d c k_30 k_60 k_ % 25% 25%
23
24 Intensity (Censored C_Vector among the Poor) W_g 0 = Income Years of Educatio n Housing Index Malnourishe d c a_30 a_60 a_ % 100% 100%
25
26 Adjusted Headcount Ratio (Censored C_Vector ) W_g 0 = Income Years of Educatio n Housing Index Malnourishe d c m0_30 m0_60 m0_
27
28 Censored Headcount k=30% W_g 0 = Income Years of Educatio n Housing Index Malnourishe d c m0_
29 Censored Headcount k=30% W_g 0 (k)= Income Years of Educatio n Housing Index Malnourishe d c m0_
30 Censored Headcount k=30% W_g 0 (k)= Income Years of Educatio n Housing Index Malnourishe d c m0_
31 Censored Headcount k=30% W_g 0 (k)= Income Years of Educatio n Housing Index Malnourishe d c m0_ CH: 2/4 1/4 1/4 2/
32 Censored Headcount k=30% W_g 0 (k)= Income Years of Educatio n Housing Index Malnourishe d c m0_ CH: CH*w: 2/4 1/4 1/4 2/4 2/4*0.25 1/4*0.25 1/4*0.25 2/4*
33 Censored Headcount k=30% W_g 0 (k)= Income Years of Educatio n Housing Index Malnourishe d c m0_ CH: CH*w: 2/4 1/4 1/4 2/4 2/4*0.25 1/4*0.25 1/4*0.25 2/4*
34 Contribution each Dimension k=30% CH: Income Years of Educatio n Housing Index Malnourishe d c m0_30 2/4 1/4 1/4 2/ CH*w: 2/4*0.25 1/4*0.25 1/4*0.25 2/4* Contrib. 2/4*0.25 1/4*0.25 1/4*0.25 2/4* Σ 100%
35 Interpret


36 Interpretation
37 Global Multidimensional Poverty Index 2013 UNDP Human Development Report 2013 & Alkire Conconi and Roche 2013 Develop a deprivation profile for each person, using a set of indicators, cutoffs and weights. Example:.
38 Global Multidimensional Poverty Index 2013 UNDP Human Development Report 2013 & Alkire Conconi and Roche 2013 Identify someone as poor if he or she is deprived in 33% or more of the weighted indicators. Poverty cutoff k = 33% Grace s Deprivation Score 33%

39 Global Multidimensional Poverty Index 2013 UNDP Human Development Report 2013 & Alkire Conconi and Roche 2013 Identify someone as poor if he or she is deprived in 33% or more of the weighted indicators. Poverty cutoff k = 33% Grace s Deprivation Score 33%
40 MPI is Alkire & Foster s M 0 The M 0 is the product of two components: Formula: M 0 = H A Example: Interpretation of M 0 : the percentage of deprivations poor people experience, as a share of the possible deprivations that would be experienced if all people were deprived in all dimensions.
41 Partial Indices H and A- The M 0 is the product of two components: Formula: M 0 = H A 1) Incidence ~ the percentage of people who are poor, or the headcount ratio H. 2) Intensity ~ the average deprivation score, or percentage of dimensions in which poor people are deprived A. Grace s Deprivation Score 39%
42 MPI Censored Deprivation Matrix g 0 (k) MPI = H*A =.442 k=3.3 Indicators c(k) c(k)/d g 0 ( k) = H = headcount ratio = ¾ = 75% A = intensity = ( )/3=0.59 = 59% MPI = HA =.442
43 Nepal s MPI MPI H 64.7% A 54% 43

44 Average Intensity of Poverty (A) 75% 70% 65% 60% 55% 50% 45% 40% 35% What MPI shows National level Nepal 2006 Nepal 2006, 64.7, % 0% 10% 20% 30% 40% 50% 60% 70% 80% 90% 100% Incidence - Percentage of MPI Poor People (H)

45 75% 70% MPI in Nepal Average Intensity of Poverty (A) 65% 60% 55% 50% 45% 40% 35% Nepal 2011 Nepal % 0% 10% 20% 30% 40% 50% 60% 70% 80% 90% 100% Incidence - Percentage of MPI Poor People (H)
46 Nepal s MPI MPI H 64.7% 44.2% A 54% 49% 46
47 2013 MPI in South Asia MPI H A Maldives DHS Sri Lanka WHS Bhutan MICS Nepal DHS Pakistan DHS 2006/ India DHS 2005/ BangladeshDHS
48 Censored Headcount: the % of people who are poor and deprived in each indicator Nepal Censored Headcounts
49 MPI Censored Deprivation Matrix g 0 (k) Censored Heacounts: Go Vertical! No Weights! Indicators c(k) c(k)/d g 0 ( k) = = h j Hint: The Censored Headcount can never exceed H. Why?
50 Enter Weights. Percent Contributions by Dimension 1 0% 10% 20% 30% 40% 50% 60% 70% 80% 90% 100%
51 g 0 MPI Censored Deprivation Matrix g 0 (k) % Contribution: Go Horizontal! Use Weights (as %)! Indicators c(k) c(k)/d % Contr = (h j * w j )/M 0 M 0 = ( k) = h j 0.25 (0.25 x.167)/0.442= 9.4% Hint: The % Contr of all 10 indicators add up to 100%
52 Asset ownership 90 Cooking 80 fuel Flooring Drinking water Improved sanitation Electricity Child school attendance Years of Schooling Child Mortality Nutrition Regional MPI values % Contr. To Poverty
 shows")
53 Decomposition By Region (or social group) shows inequalities

54 54 Changes in Censored Headcounts
55 Changes in Censored H by region (Nepal) Annualized Absolute Change in proportion who is poor and deprived in Nutrition Child Mortality Years of Schooling Attendance Cooking Fuel Sanitation Water Electricity Floor Assets

56 Comparing countries Ethiopia 2000 Nigeria 2003 Ghana 2003

57 Comparing countries Multidimensional poverty Country MPI H A Range 0 to 1 % Population Average % of weighted deprivations Lao People's Democratic Republic Yemen India
58 Comparing countries Country Range 0 to 1 Multidimensional poverty MPI H A % Population Average % of weighted deprivations Number Population of vulnerable MPI poor to poverty (who people experience % intensity of Year deprivations) of the survey b Populatio severe po (with intensit than 50 Thousands % Population % Populat Lao People's Democratic Republic , Yemen , India , Always think about the PEOPLE
 Population in severe poverty (with intensity higher than 50%) Range 0 to 1 % Population Average % of weighted deprivations % Population % Population Lao People's")
59 Comparing countries Country Multidimensional poverty MPI H A Population vulnerable to poverty (who experience % intensity of deprivations) Population in severe poverty (with intensity higher than 50%) Range 0 to 1 % Population Average % of weighted deprivations % Population % Population Lao People's Democratic Republic Yemen India TOTAL POOR Lao %
60 Policy Interest Why? 1. Intuitive easy to understand 2. Birds-eye view - can be unpacked a. by region, ethnicity, rural/urban, etc b. by indicator, to show composition c. by intensity to show inequality among poor 3. Adds Value: a. focuses on the multiply deprived b. shows joint distribution of deprivation. 4. Incentives to reach the poorest of the poor 5. Flexible: you choose indicators/cutoffs/values 6. Robust to wide range of weights and cutoffs 7. Academically Rigorous
61 Interpret to Communicate
62 The input of researchers Figure out what issues are timely and relevant. Read the newspapers Follow policy dialogues & get to know people Keep asking why my measurement matters to a poor person. See your work from a users perspective Craft factoids Design metaphors Experiment: not everything works.

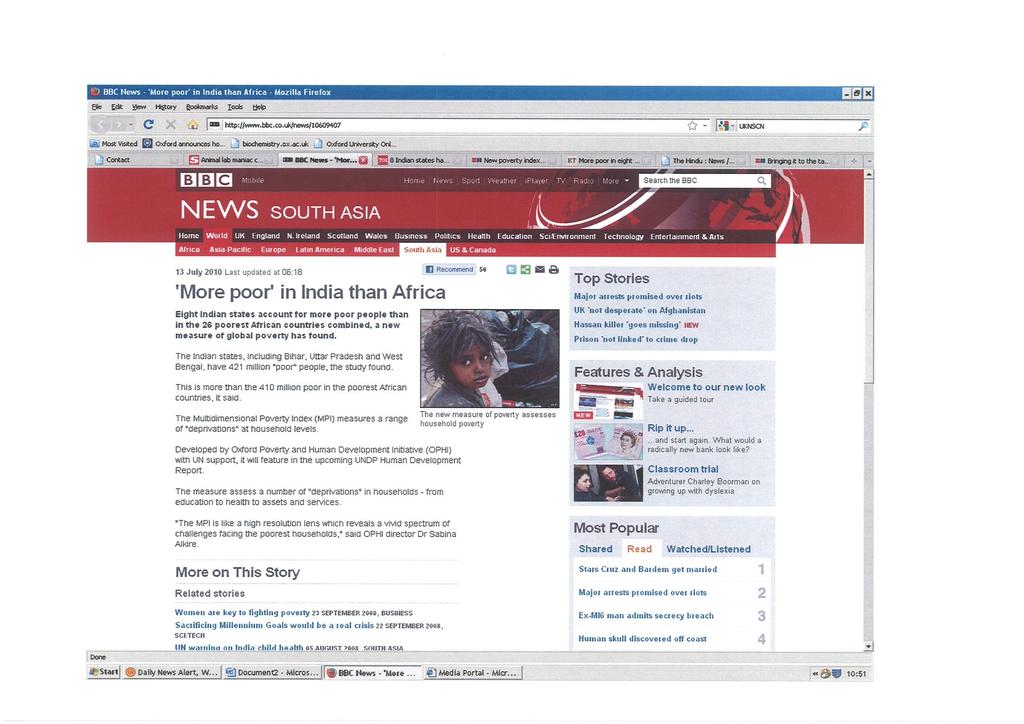
63 Finding factoids E.g. The Poorest of the Poor E.g. India vs Africa E.g. MPI in Middle Income Countries E.g. GDP per capita vs MPI How do I wake them up?

64 Slide title


65 Finding factoids Start from an idea or a controversy: MDGs wrongly count countries not people. Growth => higher GDP per capita but may not decrease multidimensional poverty. Or a question: There are more $1.25/day poor in MICS. Is it true for MPI poverty?


66 Play with your data. Finding factoids Become very Curious about your results Find comparisons that are striking or unexpected Make sure factoids are 100% accurate and academically defensible.

67 75% Pakistan vs Niger 70% Average Intensity of Poverty (A) 65% 60% 55% 50% 45% 40% Pakistan Let s compare Pakistan with Niger, our poorest country. Niger 35% In Niger, 93% of people are poor, and they are on average deprived in 69.4% of deprivations. No relation, right? 30% 0% 10% 20% 30% 40% 50% 60% 70% 80% 90% 100% Percentage of People Considered Poor (H) 67

68 75% Pakistan vs Niger 70% 65% Niger Average Intensity of Poverty (A) 60% 55% 50% 45% 40% 35% Pakistan Let s look more closely Niger is home to 13.4 million MPI poor. Intensity=69%. 30% 68 0% 10% 20% 30% 40% 50% 60% 70% 80% 90% 100% Percentage of People Considered Poor (H)
69 75% Pakistan the Bad News. Average Intensity of Poverty (A) 70% 65% 60% 55% 50% 45% 40% 35% 30% 69 Pakistan is home to 82.7 million MPI poor people million of these people are each deprived in 70% or more of the MPI dimensions. Pakistan has a community like Niger inside of it. Pakistan Niger is home to 13.4 million MPI poor. Intensity = 69%. Niger 0% 10% 20% 30% 40% 50% 60% 70% 80% 90% 100% Percentage of People Considered Poor (H)

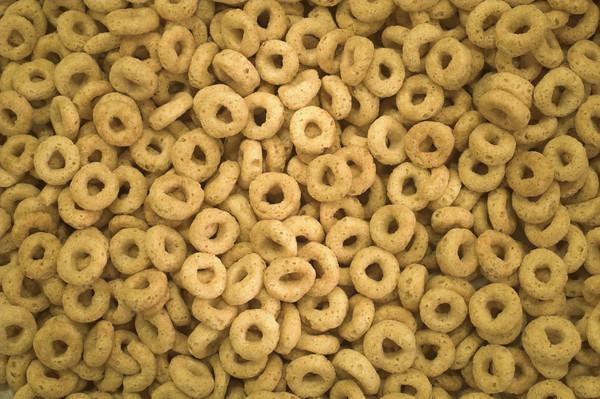
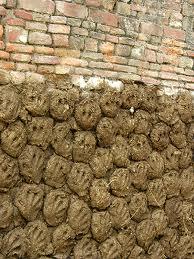
70 Design Metaphors Fact: They are less passionate about measurement. Fact: They are less worried by details Fact: A catching image is remembered & repeated. The MPI is like a High Resolution Lens
71
72
73
74 Headcount tells us which people are poor. Design Metaphors


75 Headcount tells us which people are poor. Design Metaphors MPI also shows how people are poor.
76 The MPI Design Metaphors


77 Design Metaphors The MPI can be unfolded and folded in different ways. so you see how it s made and how it can be changed.

78 Using Info graphs

79 Using maps
80 Examples:
81 100% Global MPI Headcount WHY????: Comparison with $1.25/day headcounts 90% 80% 70% 60% 50% 40% 30% 20% 10% 0% Niger Ethiopia Mali Burundi Burkina Faso Liberia Guinea Somalia Mozambique Sierra Leone Senegal DR Congo Benin Uganda Rwanda Timor-Leste Madagascar Malawi Tanzania Zambia Chad Mauritania Cote d'ivoire Gambia Bangladesh Haiti Togo Nigeria India Cameroon Yemen Pakistan Kenya Lao Cambodia Nepal Republic of Congo Namibia Zimbabwe Lesotho Sao Tome and Principe Honduras Ghana Vanuatu Djibouti Nicaragua Bhutan Guatemala Indonesia Bolivia Swaziland Tajikistan Mongolia Peru Iraq Philippines South Africa Paraguay China Morocco Suriname Guyana Estonia Turkey Egypt Trinidad and Tobago Belize Syrian Arab Republic Colombia Sri Lanka Azerbaijan Maldives Kyrgyzstan Dominican Republic Hungary Croatia Viet Nam Mexico Czech Republic Argentina Tunisia Brazil Jordan Uzbekistan Ecuador Ukraine Macedonia Moldova Uruguay Thailand Latvia Montenegro Palestinian Territories Albania Russian Federation Serbia Bosnia and Herzegovina Georgia Kazakhstan United Arab Emirates Armenia Belarus Slovenia Slovakia Intensity 69.4% & More Intensity % Intensity % Intensity % $1.25 a day 81
82 Total Population in 104 MPI countries South Asia 29.8% Sub- Saharan Africa 14.3% East Asia and Pacific 34.6% MPI poor people by region Europe and Central Asia 7.5% Arab States 4.2% Latin America and Caribbean 9.5% Europe and Central Asia 0.7% Sub-Saharan Africa 28.90% Half of the world s MPI people live in South Asia, and 29% in Sub- Saharan Africa South Asia 51.3% Arab States 2.12% Latin America & Caribbean East Asia & 2.2% Pacific 14.9% Only poor How did we make these?????
83 Composition of Poverty: Contributions by indicator To see the contribution of each indicator, we multiply the censored headcount by the weight of that indicator. To see the percentage contribution, divide the composition of poverty (above) by the value of MPI for that group (the height). 83
84 Composition of Poverty % Contribution 100% 90% 80% 70% 60% 50% 40% 30% 20% 10% 0% hindu muslim chris3an sikh other Schooling AIendance Mortality NutriLon Electricity SanitaLon Water Housing Cooking Fuel Assets 84
85 0.35 Composition of Poverty Contribution hindu muslim chris3an sikh other Schooling AIendance Mortality NutriLon Electricity SanitaLon Water Housing Cooking Fuel Assets 85
86 Composition of Poverty Contribution_pop hindu 80.4% muslim 14.1% chris3an 2.3% sikh 1.7% other Schooling AIendance Mortality NutriLon Electricity SanitaLon Water Housing Cooking Fuel Assets 86