DO EPOXY-COATED BARS PROVIDE COST-EFFECTIVE CORROSION PROTECTION? FHWA Highways for Life David McDonald, Ph.D., P.E.
|
|
|
- Herbert Parks
- 5 years ago
- Views:
Transcription
1 DO EPOXY-COATED BARS PROVIDE COST-EFFECTIVE CORROSION PROTECTION? FHWA Highways for Life David McDonald, Ph.D., P.E., April 9, 2010
2 INTRODUCTION
3 Epoxy Bar Use Introduced in nd most common strategy to prevent reinforcement corrosion After increased cover USA, Canada, Middle East, Japan, and India 700,000,000 ft 2 of decks 65,000 bridges in the US alone ~600,000 ton/yr 10-15% of all rebar


4 Woodrow Wilson Bridge, Virginia/Maryland I-35 Minneapolis, Minnesota Bridge of Honor, Ohio Biloxi Bay Bridge, Mississippi
5 FIELD PERFORMANCE


6 Research and Performance Over 200 research papers
 of cover.")
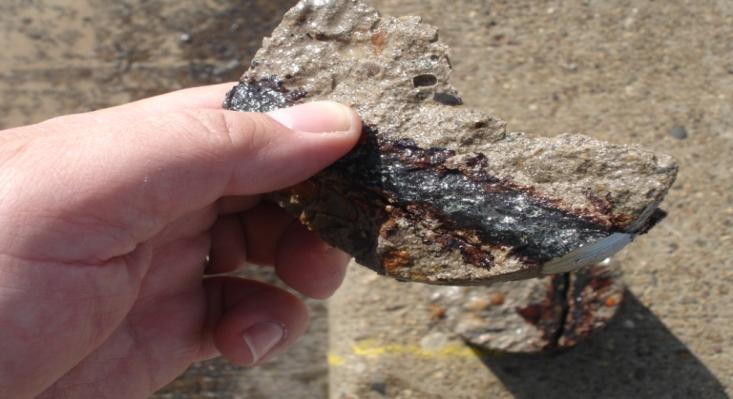
7 Poor concrete and poor bars 1986, spalls observed in Florida Typically 1 x 1 ft spalls in tidal zone Poor concrete and poor bars Bars left beside ocean Highly salt contaminated concrete Only 25 mm (1 in.) of cover. Poor quality concrete


8 Minnesota Department of Four bridges 1973 to 1978 Overall condition good to very good, with no or modest levels of corrosion activity. Corrosion constrained joints over piers Amount of delamination in all decks is very low Transportation 2008

9 New York State Department of Transportation 2009 Used extensive statistical analysis of all state bridge inspection data Pool of 17,000 structures structural decks with epoxy-coated rebars perform significantly better than those with uncoated rebars, especially in the later years.


10 2009 West Virginia Study Lawler and Krauss Detailed study of six bridges built Deck area: 62,000 sq ft After years Total delamination: 22.7 sq ft Chloride levels above threshold Black Bar performance Repaired in 1993 with overlays


11 Bridge 2930, West Virginia Epoxy-coated bars Black Bars
12 Effect of coating thickness 100% 80% 60% 40% 20% 0% Thickness (mil)

13 DESIGN LIFE PREDICTION
14 Life modeling Environment Materials Repair Design
15 Cumulative damage Tuuti Model Spalling Crack development Initiation Period Allowable damage before repair Time
16 INITIATION PERIOD
17 Cumulative damage Tuuti Model Initiation Period Time
18 Fick s Model 2 nd law of diffusion C = concentration, D = diffusion coefficient, t = time, x = distance 2 2 x C D t C Dt x erf C C C t x C s s 2 ), ( 0

19 Chloride exposure State tons/lane mile times /year Max Min Avg Max Min Avg Illinois New Jersey Pennsylvania Utah Wisconsin

20 Concrete permeability Pore structure chemistry of the cement and additives water-cement ratio types and quantities of aggregates. For w/c of 0.42 Lawler and Krauss ~ 0.15 in 2 /yr, Life-365 ~ 0.43 in 2 /yr [16].

21 Most models do not consider the effect of cracks Effect of cracks

22 Corrosion threshold Typical 1.2 lb/yd 3 Azad 1.0 to 2.1 lb/yd 3 chloride ion by weight of concrete.
23 Effect of variability Parameter Assumption 1 Assumption 2 Cover (in.) Permeability (in.in/year) Surface chloride (lb/cu yd) Assumed threshold (lb/cu yd) Calculated time to corrosion initiation (years) 11 42
24 Cumulative damage Tuuti Model Spalling Crack development Initiation Period Time
25 Propagation period Dependant on: temperature oxygen availability cathode areas concrete resistivity Black bars standard 5-year Epoxy-coated bars Standard 20 years significantly influenced by the availability of cathodic areas very conservative
26 Cumulative damage Tuuti Model Spalling Crack development Initiation Period Allowable damage before repair Time
27 Repair timing Amount of deterioration Funding and labor Condition of the superstructure Volume of traffic Rate of physical deterioration 18 structures in Kansas damage 1.0 to 29.8 percent of the deck surface

28 Durability of Repairs Need to develop durability databases Significantly influence models 10 year period for patch repairs 20 years for an overlay

29 Cumulative damage Tuuti Model Time
30 LIFE CYCLE ANALYSIS

31 LIFE CYCLE COST ANALYSES Not a straightforward procedure. economic principles bridge repair techniques, costs, and effectiveness good costing database most likely alternatives good knowledge of how a bridge behaves over the long term. Poor decisions can result if the user applies the wrong assumptions.
32 Cost of repair Significant portion of the total cost comes from incidental costs mobilization traffic control repairs and improvements to other parts of the bridge Kansas Averaged $12/sf minimum of $3/sf maximum of $26/sf

33 Discount Rate Office of Management and Budget (OMB) 2010: 2.8% for a 30 year program 1982: 7.9% Low discount rates favor materials with high durability requiring little or no maintenance Present value of a $100 repair in 60 years, the present values will be $19 or $1, respectively
34 Which one to choose?
35 INITIAL COSTS


36 Black Performance Epoxy Galvanized ASTM A1035 Epoxy Stainless clad Stainless SS316 Performance vs. Cost years
37 CONCLUSIONS
38 Selection Factors Experience 700,000 bridges already in existence in North America. Initial cost. Corrosion can go away at a premium Epoxy-coated bars have already provided 40 year design life in 1970s concrete for minimal cost
39 Dealing with uncertainty Everything is vague to a degree you do not realize till you have tried to make it precise Any product can be made cost effective, dependent on the assumptions. Black reinforcing bars become cost effective if the discount rate is high.
40 Conclusions Designers and specifiers should consider the experience gained from 65,000 structures containing epoxy-coated bars over the past 37 years. Epoxy-coated bars have already demonstrated almost a 40-year design life in 1970s concrete Epoxy-coated bars provide cost-effective corrosion protection.