Contact person Date Reference Page Tobias Eriksson P (2) Energy Technology
|
|
|
- Lionel Gilbert
- 5 years ago
- Views:
Transcription
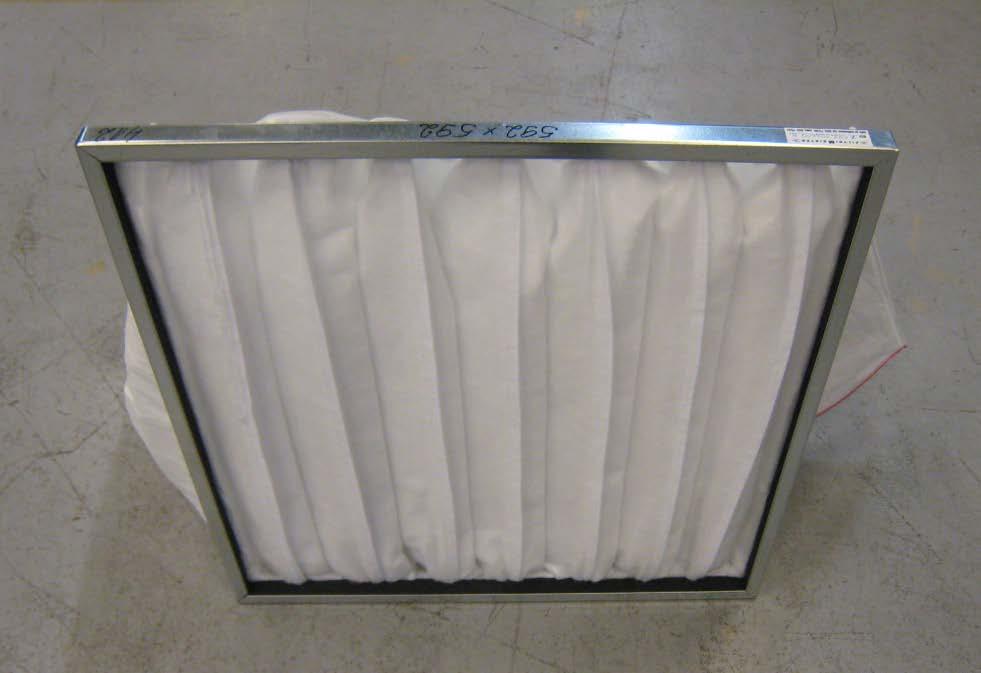
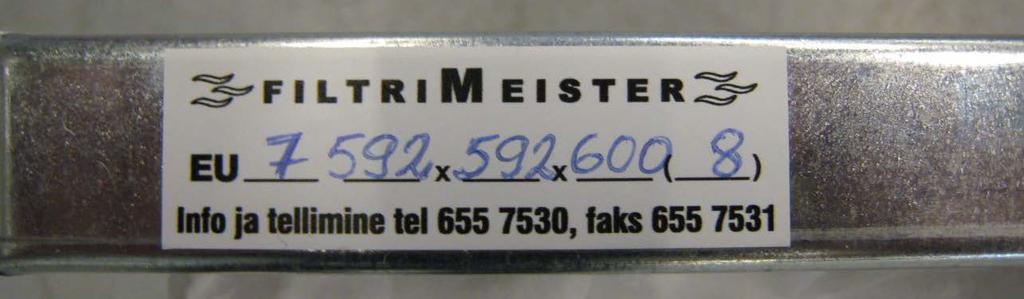
1 issued by an Accredited Testing Laboratory Contact person Tobias Eriksson P (2) Energy Technology Tobias.Eriksson@sp.se 1002 ISO/IEC Filtrimeister OÜ Ehitajate tee 110 EE TALLIN Estonia Testing of Air Filter according to EN779:2012 (3 appendices) A test according to EN 779:2012 was carried out by request from Filter AB. Tested item Filtrimeister OÜ, EU7 592x592x600 (8), F7, 592 mm x 592 mm x 600 mm, 8 pocket air filter. Filtrimeister OÜ, EU7 592x592x600 (8), F7, filter medium sample from a 592 mm x 592 mm x 600 mm, 8 pocket air filter (for discharging test). The items were sent to SP by Filtrimeister OÜ and were received by SP on September 27, The items were without visible defects. Date and Place The test was carried out at SP s laboratory of Energy Technology in Borås, Sweden on October 8-9, Discharging test was carried out on October 11-14, Test method The test was carried out according to standard EN 779:2012 Particulate air filters for general ventilation Determination of the filtration performance. Results The results are presented in appendix 1 and are valid only for the items tested. Postal address Office location Phone / Fax / Laboratories are accredited by the Swedish Board for Accreditation and SP Box 857 SE BORÅS Sweden Västeråsen Brinellgatan 4 SE BORÅS info@sp.se Conformity Assessment (SWEDAC) under the terms of Swedish legislation. This report may not be reproduced other than in full, except with the prior written approval of the issuing laboratory.
2 P (2) Measurement equipment Pressure gauge Furness model 318, SP's inventory no (static P Filter) Pressure gauge Furness model 318, SP's inventory no (static P Flow) Pressure gauge Furness FC012, SP's inventory no ( P Filter) Pressure gauge Furness FC012, SP's inventory no ( P Flow) Particle counter Las-X II, SP's inventory no Barometer, Testo 511, SP's inventory no Temperature and RH, Testo 635, SP's inventory no Weighing scale, Mettler PC16, SP's inventory no Flow meter, MFS-C-250, SP's inventory no Flow meter, MFS-C-50, SP's inventory no Kr-85 Aerosol Neutralizer, TSI, SP's inventory no Uncertainty of measurement The uncertainty of the Air flow is better than ± 5 % The uncertainty of the Pressure Drop is better than ± 3 % The uncertainty of the Temperature is better than ± 0.5 ºC The uncertainty of the Relative Humidity is better than ± 3 % RH The uncertainty of the Atmospheric Pressure is better than ± 1 mbar The uncertainty of the Measured mass is better than ± 0.5 g The method error in determination of the filtration efficiency is: η = 0-90 %: ± 0.1 of penetration value [%] η = %: ± 0.2 of penetration value [%] η = %: ± 0.5 of penetration value [%] η > %: ± 1 of penetration value [%] The uncertainty of the filtration efficiency according to EN 779:2012 is presented in the appendix. Energy Technology - Combustion and Aerosol Technology Performed by Examined by Signature_1 Tobias Eriksson Signature_2 Marie Rönnbäck Appendices 1. Test report according to EN779: Picture of tested item 3. Interpretation of test reports according to section 13.2 in EN779:2012
3 P (8) Testing organisation: SP Technical Research Institute of Sw eden Report no.: 3P07091 EN 779:2012 AIR FILTER RESULTS GENERAL Test no.: SP Date of test: 08/10/ /10/2013 Supervisor: CM Test requested by: Filtrimeister OÜ Device receiving date Device delivered by: Filtrimeister OÜ 27/09/2013 DEVICE TESTED Model: Manufacturer: Construction: EU7 592x592x600 (8) Filtrimeister OÜ Pocket filter, 8 pockets Type of media: Net effective filtering area: Filter dimensions (w idth x height x depth): Synthetic 5.9 m² 592 mm x 592 mm x 600 mm TEST DATA Test air flow rate: Test air temperature: Test air relative humidity: Test aerosol: Loading dust: m 3 /s 26 to 34 o C 26 to 43 % DEHS ASHRAE 52/76 RESULTS Initial pressure drop: Initial arrestance: Initial efficiency (0.4 µm): Test dust capacity: Untreated/ discharged efficiency 124 Pa >99 % 73 % 155 / 215 / 258 g of media (0.4 µm): 77 % / 44% Final test pressure drop: Average arrestance: Average efficiency (0.4 µm): Filter class (450 Pa): Remarks: 250 / 350 / 450 Pa >99% / >99% / >99% 88% / 90% / 92% F7 Note: The performance results are only valid for the tested item and cannot by themselves be quantitatively applied to predict efficiency and lifetime in service Efficiency (0.4 µm), % Arrestance, % Efficiency (0.4 µm) as a function of dust fed at the air flow rate Arrestance as a function of dust fed at the air flow rate Dust fed, g Pressure drop, Pa Air flow rate, m 3 /s Pressure drop as a function of the air flow rate (clean device) Pressure drop as a function of dust fed at the air flow rate
4 P (8) EN779: Efficiency after different dust loading phases Air filter: EU7 592x592x600 (8) Test no.: SP Test aerosol: DEHS Air flow rate: m 3 /s Particle size Efficiency % Interval Mean Pressure drop, Pa and Dust fed, g 124 Pa 141 Pa 172 Pa 246 Pa 333 Pa 457 Pa µm µm 0 g 30 g 80 g 155 g 210 g 265 g ± ± ± ± ± ± ± ± ± ± ± ± ± ± ± ± ± ± ± ± ± ± ± ± ± ± ± ± ± ± ± ± ± ± ± ± ± ± ± ± ± ± ± ± ± ± ± ± ± ± ± ± ± ± ± ± ± ± ± ± ± ± ± ± ± ± ± ± ± ± ± ± 0.0 NOTE The uncertainty of the measured efficiencies is reported on a 95 % confidence level. EN779: Average efficiency at different final test pressure drops Air filter: EU7 592x592x600 (8) Test no.: SP Test aerosol: DEHS Air flow rate: m 3 /s Particle size Average efficiency % Interval Mean Final test pressure drop µm µm 250 Pa 350 Pa 450 Pa ± ± ± ± ± ± ± ± ± ± ± ± ± ± ± ± ± ± ± ± ± ± ± ± ± ± ± ± ± ± ± ± ± ± ± ± 0.0 Test dust capacity 155 g 215 g 258 g NOTE The uncertainty of the measured efficiencies is reported on a 95 % confidence level.
5 P (8) EN779: Efficiency after different dust loading phases Air Filter: EU7 592x592x600 (8) Test no.: SP Test aerosol: DEHS Air flow rate: m 3 /s Efficiency, % Particle size, µm 1) 0 g / 124 Pa 2) 30 g / 140 Pa 3) 80 g / 171 Pa 4) 155 g / 245 Pa 5) 210 g / 332 Pa 6) 265 g / 456 Pa EN779: Initial and average efficiency at different final test pressure drops Air Filter: EU7 592x592x600 (8) Test no.: SP Test aerosol: DEHS Air flow rate: m 3 /s Average efficiency, % Particle size, µm Initial
6 P (8) EN779: Air flow rate and pressure drop after different dust loading phases Air filter: EU7 592x592x600 (8) Test no.: SP Test aerosol: DEHS Air flow rate: m 3 /s Date Dust fed Air flow meter Filter m tot t f p sf dp f q m t ϕ p a ρ q v p p 1.20 g C Pa Pa kg/s C % kpa kg/m 3 m 3 /s Pa Pa Clean filter 08/10/ /10/ /10/ /10/ /10/ Clean filter pressure drop is proportional to (q v ) n, w here n = Dust loading phase 08/10/ /10/ /10/ /10/ /10/ /10/ /10/ /10/ /10/ /10/ = after dust increment 1 = before next dust increment Symbols and units dp f air flow meter differential pressure, Pa q m mass flow rate, kg/s m tot cumulative mass of dust fed to filter, g q v air flow rate filter, m 3 /s p measured filter pressure drop, Pa t f temperature at air flow meter, C p 1.20 filter pressure drop at air density 1.20 kg/m 3, Pa t temperature upstream of filter, C p a absolute air pressure upstream of filter, kpa ϕ relative humidity upstream of the filter, % p sf air flow meter static pressure, kpa ρ air density upstream of filter, kg/m 3
7 P (8) EN779: Pressure drop and arrestance after different dust loading phases Air filter: EU7 592x592x600 (8) Test no.: SP Test aerosol: DEHS Air flow rate: m 3 /s Date p 1 dm m tot p 2 m 1 m 2 m m d A A m Pa g g Pa g g g g % % 08/10/ /10/ /10/ /10/ /10/ Symbols and units A arrestance, % A m average arrestance, % dm dust increment, g p 1 pressure drop before dust increment (air density 1.20 kg/m³), Pa p 2 pressure drop after dust increment (air density 1.20 kg/m³), Pa m d m 1 m 2 m tot m dust in duct after device, g mass of final filter before dust increment mass of final filter after dust increment cumulative mass of dust fed to filter, g mass gain of final filter, g Mass of tested item: Clean filter: After complete test: g g Test dust ASHRAE 52/76, Particle Technology Ltd. Batch no: 8097
8 P (8) EN779: Efficiency and pressure drop of untreated filter material at 100 % nominal velocity Air filter: Test no.: EU7 592x592x600 (8) SP Test aerosol: DEHS Discharging method: Isopropanol Air flow rate: 14.8 l/s Media velocity: 0.16 m/s Size of material sample: 9.24 dm² Particle size Sample 1 Sample 2 Sample 3 Average µm Efficiency Interval Mean % Pressure drop 91 Pa 87 Pa 88 Pa 89 Pa ± ± ± ± ± ± ± ± ± ± ± ± ± ± ± ± ± ± ± ± ± ± ± ± ± ± ± ± ± ± ± ± ± ± ± ± NOTE The uncertainty of the measured efficiencies is reported on a 95 % confidence level. EN779: Efficiency and pressure drop of discharged filter material at 100 % nominal velocity Air filter: Test no. EU7 592x592x600 (8) SP Test aerosol: DEHS Discharging method: Isopropanol Air flow rate: 14.8 l/s Media velocity: 0.16 m/s Size of material sample: 9.24 dm² Particle size Sample 1 Sample 2 Sample 3 Average µm Efficiency % Interval Mean Pressure drop 82 Pa 80 Pa 81 Pa 81 Pa ± ± ± ± ± ± ± ± ± ± ± ± ± ± ± ± ± ± ± ± ± ± ± ± ± ± ± ± ± ± ± ± ± ± ± ± NOTE The uncertainty of the measured efficiencies is reported on a 95 % confidence level.
9 P (8) EN779: Efficiency and pressure drop of untreated filter material at 50 % nominal velocity Air filter: Test no.: EU7 592x592x600 (8) SP Test aerosol: DEHS Discharging method: Isopropanol Air flow rate: 7.4 l/s Media velocity: 0.08 m/s Size of material sample: 9.24 dm² Particle size Sample 1 Sample 2 Sample 3 Average µm Efficiency % Interval Mean Pressure drop 45 Pa 43 Pa 44 Pa 44 Pa ± ± ± ± ± ± ± ± ± ± ± ± ± ± ± ± ± ± ± ± ± ± ± ± ± ± ± ± ± ± ± ± ± ± ± ± NOTE The uncertainty of the measured efficiencies is reported on a 95 % confidence level. EN779: Efficiency and pressure drop of discharged filter material at 50 % nominal velocity Air filter: Test no. EU7 592x592x600 (8) SP Test aerosol: DEHS Discharging method: Isopropanol Air flow rate: 7.4 l/s Media velocity: 0.08 m/s Size of material sample: 9.24 dm² Particle size Sample 1 Sample 2 Sample 3 Average µm Efficiency % Interval Mean Pressure drop 41 Pa 40 Pa 40 Pa 40 Pa ± ± ± ± ± ± ± ± ± ± ± ± ± ± ± ± ± ± ± ± ± ± ± ± ± ± ± ± ± ± ± ± ± ± ± ± NOTE The uncertainty of the measured efficiencies is reported on a 95 % confidence level.
10 P (8) Efficiency, % Particle size, µm Efficiency of untreated filter material at 100 % nominal velocity Efficiency of discharged filter material at 100% nominal velocity Efficiency of untreated filter material at 50% nominal velocity Efficiency of discharged filter material at 50 % nominal velocity
11 P (1) Appendix 2
12 P (1) Appendix 3 The interpretation of test reports according to EN779: Interpretation of test reports This brief review of the test procedures, including those for addressing the testing of electrostatically charged filters, is provided for those unfamiliar with EN 779 procedures. It is intended to assist in understanding and interpreting the results in the test report/summary. (For further details of procedures the full EN 779 document should be consulted). Many types of air filter rely on the effects of passive static electric charges on the fibers to achieve high efficiencies, particularly in the initial stages of their working life. Environmental factors encountered in service may affect the action of these electric charges so that the initial efficiency may drop substantially after an initial period of service. In many cases this is offset or countered by an increase in efficiency ( mechanical efficiency ) as dust deposits in filter media. In the later stages of operating life the efficiency may increase to equal or exceed the initial efficiency. The reported untreated and conditioned (discharged) efficiencies show the extent of the electrical charge effect on initial performance. It should not be assumed that the measured conditioned (discharged) efficiency represents real life behaviour. It merely indicates the level of efficiency obtainable with the charge effect completely removed and with no compensating increase in mechanical efficiency. For reasons of consistency filter efficiencies are measured using artificially generated clouds of synthetic DEHS material (droplets) with closely controlled particle size. These efficiency measurements are repeated after the filter has been loaded with ASHRAE loading dust until the resistance has risen to a value of 250 Pa in the case of the coarse (G) procedure and with up to a value of 450 Pa for the fine and medium (F and M) procedure. Test dust capacities measured in this way may be used for to compare performances and for rankings but should not be assumed to simulate real life operating conditions as the properties of dusts encountered in service conditions vary very widely.