Determination of soil hydraulic properties of potential low and intermediate level waste disposal sites in Bulgaria
|
|
|
- Christal Bruce
- 5 years ago
- Views:
Transcription
 2 Belgian Nuclear")
1 EXTERNAL REPORT SCK CEN-ER-49 08/DMa/P-4 Determination of soil hydraulic properties of potential low and intermediate level waste disposal sites in Bulgaria Assistance to site selection and site evaluation for lowand intermediate level waste disposal in Bulgaria Dimitar Antonov 1 and Dirk Mallants 2 1 Geological Institute of the Bulgarian Academy of Sciences (GI-BAS) 2 Belgian Nuclear Research Centre (SCK CEN) CO January, 2008 SCK CEN Boeretang 200 BE-2400 Mol Belgium IPA-PAS
2 SCK CEN Studiecentrum voor Kernenergie Centre d étude de l énergie Nucléaire Boeretang 200 BE-2400 Mol Belgium Phone Fax Contact: Knowledge Centre library@sckcen.be RESTRICTED All property rights and copyright are reserved. Any communication or reproduction of this document, and any communication or use of its content without explicit authorization is prohibited. Any infringement to this rule is illegal and entitles to claim damages from the infringer, without prejudice to any other right in case of granting a patent or registration in the field of intellectual property. SCK CEN, Studiecentrum voor Kernenergie/Centre d'etude de l'energie Nucléaire Stichting van Openbaar Nut Fondation d'utilité Publique - Foundation of Public Utility Registered Office: Avenue Herrmann Debroux 40 BE-1160 BRUSSEL Operational Office: Boeretang 200 BE-2400 MOL
3 EXTERNAL REPORT OF THE BELGIAN NUCLEAR RESEARCH CENTRE SCK CEN-ER-49 08/DMa/P-4 Determination of soil hydraulic properties of potential low and intermediate level waste disposal sites in Bulgaria Assistance to site selection and site evaluation for lowand intermediate level waste disposal in Bulgaria Dimitar Antonov 1 and Dirk Mallants 2 1 Geological Institute of the Bulgarian Academy of Sciences (GI-BAS) 2 Belgian Nuclear Research Centre (SCK CEN) CO January, 2008 Status: Unclassified ISSN SCK CEN Boeretang 200 BE-2400 Mol Belgium
4
5 Table of Contents Abstract Introduction General Principles and Experimental Methodology Theoretical remarks Experimental stage Quantifying the hydraulic functions from water retention curve determination General remarks Soil water characteristic Unsaturated hydraulic conductivity Hydraulic functions for typical soils Results from the analysis Results from the previous investigations Conclusions...20 Acknowledgements...20 References...20 Appendix A...23 Appendix B...29 Appendix C
6 2
7 Abstract In the framework of selecting a suitable site for final disposal for low- and intermediate level short-lived radioactive waste in Bulgaria, a determination of soil hydraulic properties of two potential sites was made. The investigated samples are from the vadoze zone of the unsaturated deep soil profiles, which are considered as a pathway of eventual radionuclide migration from the disposal facility to the biosphere. The hydraulic parameters are determined from the relationship soil water content pressure head (soil water retention curve). The traditional method of determining the retention function was used - establishing a series of equilibria between water in the soil sample and a body of water at known potential. According to the pressure head value, two types of apparatuses were used a sand bath and a pressure cell. The hydraulic parameters of the samples were obtained by implementing the optimization procedure for retention curves available in the computer code RETC. The resulting hydraulic parameters can now be used in the simulation models for the prediction of variably saturated water flow and concomitant radionuclide transport in the deep unsaturated sediments of the potential disposal sites. This is important input to an evaluation of the suitability of potential sites for developing a near surface disposal facility. Key words: low- and intermediate level short-lived radioactve waste, site evaluation, unsaturated hydraulic properties, retention curve, RETC, optimization procedure 3
8 4
9 1. Introduction A procedure for selection of a site for a National repository for low and intermediate level radioactive wastes is forthcoming in Bulgaria. At the present state, after subsequent analysis of elimination, from 24 initially selected terrains only three potential sites remained - all situated in the Northwest part of the country. The State Enterprise 'Radioactive Wastes', the Bulgarian state organization responsible for the final disposal of the radioactive wastes, appointed the GI-BAS for further investigations of these sites. Two of the sites (Marichin Valog and Brestova Padina) are close to the Kozloduy Nuclear Power Plant and they are with almost similar geomorphologic and geological conditions, namely undulating landscape developed on Pliocene clays covered by Quaternary sediments - loess and clayey gravel layers. The third potential site (Varbitza) is located at about 60 km in South-Southeast direction and it is placed in the Fore-Balkan marl sediments weathered at the upper part. At the three sites, the water table is at relatively great depth, so an unsaturated (vadoze) zone exists. The thickness of the unsaturated zone is about m at Varbitza and Brestova Padina sites and up to 30 m in Marichin Valog. From the long-term safety point of view, the movement of water and dissolved contaminants in the saturated and unsaturated zones of the subsurface environment is a basis for comparison of the sites in order that the best suitable one be selected. Also, the proper knowledge about unsaturated water flow and concomitant radionuclide transport is key input to safety assessment calculations. Computer models for the prediction of variably saturated flow and transport properties of the medium require accurately estimation of a number of parameters which appear in those models. These hydraulic parameters can be determined from the relationship soil water content soil water suction, which is indentified in the literature by various names, including water retention function (Klute, 1986). The main task of the following investigations is the measurement of the soil hydraulic characteristics, notably the soil water retention curve (capillary pressure - water content relationship). Laboratory tests will be set up using soil samples from two potential sites - Marichin Valog and Varbitza. Data collected will be mathematically analyzed using RETC inverse optimization computer code and will be compared with previous studies of that kind (Mallants et al., 2005; Mallants et al., 2006; Mallants et al., 2007). The resulting parameters can be used as input to variably saturated water flow codes, with which predictive calculations can be made on the hydraulic regime of unsaturated sediments underlying a surface repository. 5
10 2. General Principles and Experimental Methodology 2.1. Theoretical remarks. The traditional method of determining the water retention function involves establishing a series of equilibria between water in the soil sample and a body of water at known potential. The soil-water system is in hydraulic contact with the body of water via a water-wetted porous plate or membrane but in certain cases it could be a uniform sand medium. At each equilibrium point, the volumetric water content, θ, of the soil is determined and paired with a value of the matric pressure head, h m, determined from the pressure in the body of water and the gasphase pressure in the soil. The data pair (θ, h m ) is one point on a retention function. A drainage curve is mapped by establishing a series of equilibria by drainage from zero pressure head. A wetting curve is obtained by equilibrating samples wetted from a low water content or low pressure head (large negative value) (Klute, 1986). The retention curve is hysteretic, i.e. the water content at a given pressure head for a wetting soil is less than that for a drained soil. The principle features of the hysteresis of the retention function are shown in Fig. 1. The drainage curve that starts at complete saturation of the porous medium is the initial drainage curve (IDC). In many porous media, as water is removed, the matric pressure head decreases and the water content approaches a limit called the residual water content, θ r. The main wetting curve (MWC) is obtained by wetting the sample from low water content. Usually, the MWC is determined starting at the residual water content θ r or the so-called "air-dried condition". As the soil is wetted along the MWC and the pressure head approaches zero, the water content approaches a value, θ o, that is less than the total porosity, θ s, due to the presence of entrapped air. Usually, θ o is about is about 0.8 θ s to 0.9 θ s. The water content, θ o, is called the natural saturation or the satiated water content. The drainage curve obtained beginning at θ o is called the main drainage curve (MDC). It merges asymptotically with the IDC as the pressure head decreases. An infinite set of scanning curves lies inside the envelop of the IDC and the MWC (Fig. 1). Fig. 1. Diagram of hysteresis in the water retention function (by Klute, 1986) 6
 and the pressure cell method is used for equal or more than -100 cm values of the pressure head.")
11 2.2. Experimental stage. The equipment for determining the retention function could be two types suction apparatus (sand bath) or pressure cell apparatus. The sand bath method is used for the pressure head values up to -100 cm (100 cm of suction tension) and the pressure cell method is used for equal or more than -100 cm values of the pressure head. The main details of the sand bath method apparatus are shown on Fig. 2 and a general view of the system is shown on Photo 1. Fig. 2. Example of sand suction table, dimensions in mm (by Di Bonito, 2005): 1- tensiometer, 2-soil core sample, 3-nylon or cotton voile, 4-ceramic sink, 5-fine sand ( µm), 6-coarse sand, 7- drain system, cm 3 reservoir, 9-thin nylon tube, 10-air inlet, 11-levelling bottle, 12-overflow, 13- tap, 14-flexible 7 mm id nylon tubing Note: It is important that the sand has to be very uniform so not to interrupt the water flow from the bottom of the sink to the soil samples. Photo 1. A sand bath apparatus (courtesy: Guido Rentmeester, UCL, 2007) 7

12 The main details of the pressure cell apparatus are shown on Fig. 3 and a general view of the system is shown on Photo 2. Fig. 3. Pressure membrane cell, dimensions in mm (by Di Bonito, 2005): 1-air from compressor, 2-O-rings, 3-bolts, 4-visking membrane, 5-outflow pipe, 6-sintered bronze plate Photo 2. Pressure cell apparatus ( courtesy: Guido Rentmeester, UCL, 2007) 8
13 3. Quantifying the hydraulic functions from water retention curve determination 3.1. General remarks Twenty-one undisturbed soil samples in steel rings were prepared for estimation of the soil water retention curve, resp. for the hydraulic parameters determination. A brief description of the samples from the Marichin Valog site is as follows: one sample /Lab N 3527/ from the red clayey gravel layer (transition zone) at m depth; eleven samples /Lab NN 3529, 3530, / from the Pliocene clay layer from different depths. All the samples are from the vadoze zone of the profile. The soil samples from the Varbitza site are as follows: nine samples /Lab NN or S1-S9/ from the upper weathered part of the marl sediments. It is assumed that this zone is unsaturated up to 15 m in depth. The boreholes from which the samples were taken are shown on Appendix A, Fig. A-1 and Fig. A-2, respectively for the Marichin Valog and the Varbitza sites. The detailed description and some physical parameters of all samples are given at Appendix A, Tabl. A-1. For the aim of the plotting of the soil water retention curve, the estimation of the samples' volumetric water content after saturation is done at nine points of the pressure head, namely at 1.0, 1.85, 2.0, 2.4, 3.0, 3.5, 4.0 and 4.2 pf. Note that pf = -log(h) [cm], for instance 1.85 pf is equal to -70 cm of a pressure head. As it was mentioned above, for the pf 1.0 and 1.85 data points, the sand bath method has been used after the saturation in the same apparatus (Photo 3). For the other data points the pressure cell apparatus has been used. In the case of pf 3.5 and above (i.e. high pressure values), as the results of the volumetric water content are mostly dependent on the sample`s grain size and not so much on its texture, disturbed samples (in a state of a paste) have been used (Photo 4). A detailed scheme of the measurements is given in Appendix B of this report. 9
 and disturbed samples-paste in 2 cm high rings (above pf 3)( courtesy: Guido Rentmeester, UCL, 2007)")

14 Photo 3. Saturation and measurement of the pf 1.0 and pf 1.85(courtesy: Guido Rentmeester, UCL, 2007) Photo 4. Preparation for measurements in the pressure cell: undisturbed samples in steel rings (up to pf3) and disturbed samples-paste in 2 cm high rings (above pf 3)( courtesy: Guido Rentmeester, UCL, 2007) 3.2. Soil water characteristic Various models have been defined to describe the soil water characteristic, but the model defined by van Genuchten (1980) is the most commonly used. One of the advantages of the van Genuchten model is that it provides a predictive closed-form equation for the unsaturated hydraulic conductivity function by using the statistical pore-size distribution model of Mualem (1976), see further. First, the degree of water saturation is defined: θ θ r S e = (1) θ θ s r 10
15 where θ is soil water content (cm 3 /cm 3 ), θ r and θ s are the residual and saturated water contents (cm 3 /cm 3 ), respectively. As a first approximation and on intuitive ground, θ s = η and θ r = 0. In reality, however, the saturated water content θ s of soils is smaller than the total porosity η because of entrapped air and the presence of large pores which drain too rapidly to become saturated. The residual water content θ r is likely to be larger than zero, because of the presence of adsorbed water. Most often θ r is treated as a fitting parameter without physical significance. Rather than using the matric potential in the parameterization of the water characteristic, the matric head h is used instead: ψ m h = (2) ρ g w where h has units of length (m). Note that h was named pressure head in a saturated soil because of the positive pressure. The original van Genuchten equation for the soil water characteristic, θ(h), is defined as (van Genuchten, 1980): θ s -θ r θ r + h <0 n m θ (h)= (1+( α h ) ) (3) θ s h 0 where θ, θ r and θ s were defined previously, and α (1/m), n, and m are constants which define the shape of the curve, with m = 1-1/n (with the requirement n > 1 if Eq. (3) is used in combination with K(h), see further). The dependency of the van Genuchten model on the parameters α and n is shown in Fig Matric head h (m) α = n = Saturation degree Se Saturation degree Se Fig. 4 Dependency of van Genuchten soil water characteristic on parameter α (keeping n fixed at 1.25) (left) and n (keeping α fixed at 1) (right). Saturation degree S e is used rather than water content. 11
16 3.3 Unsaturated hydraulic conductivity In addition to the parameterisation of θ(h), description of water flow through unsaturated soil also requires the parameterisation of K(h). Most models for K(h) assume that the water-filled pore space consists of a set of capillaries with the distribution of pore radii being determined by the soil water characteristic. One very attractive unsaturated hydraulic conductivity function is that derived by van Genuchten (1980), and is based on the statistical pore size distribution of Mualem (1976). The van Genuchten-Mualem K(h) model is defined as follows: where K(h)= K K s s K r(h) h <0 (4) h 0 τ 1/m m 2 K r = S e [1 - (1- S e ) ] (5) and K s and K r are saturated and relative hydraulic conductivity (m/s), respectively, τ is an empirical constant assumed equal to 0.5 (Mualem, 1976), and S e is as defined previously. The advantage of the van Genuchten-Mualem K(h) model is that nearly all its parameters, except K s, can be determined from the soil water characteristic. In other words, a complete description of θ(h) and K(h) may be obtained with five parameters, i.e. θ r, θ s, α, n, and K s. Two types of measurements therefore suffice to determine the hydraulic functions: measurements of the soil water characteristic and saturated hydraulic conductivity. 3.4 Hydraulic functions for typical soils Different soil types exhibit quite different hydraulic functions. This is illustrated by considering three different soil textures, sand, silt, and loam, where the sand is composed of much coarser particles compared to the fine-textured silt and loam. The soil water characteristic and the unsaturated hydraulic conductivity relationship are shown in Fig. 5. Matric head h (m) Sand Loam Silt Hydraulic conductivity K (m/s) 1E-004 1E-005 1E-006 1E-007 1E-008 1E-009 Sand Loam Silt Sand Silt Loam Water content θ Matric head h (m) Water content θ Fig. 5 Hydraulic functions of typical soils using the van Genuchten soil water characteristic and the van Genuchten-Mualem hydraulic conductivity model. Sand: θ r = 0.03, θ s = 0.32, α = 2.3 (m -1 ), n = 4.17, K s = (m s -1 ); Silt: θ r = 0.01, θ s = 0.41, α = 0.7 (m -1 ), n = 1.30, K s = (m s -1 ); Loam: θ r = 0.00, θ s = 0.43, α = 1.6 (m -1 ), n = 1.25, K s = (m s -1 ). 12
17 Carsel and Parish (1988) estimated a set of average van Genuchten parameters for a large variety of soil textural groups (see Table 1). These data may be used, when initial estimates of the soil water characteristic are not available. Table 1 Average values for van Genuchten soil water characteristic for textural groups according to the USDA classification (Soil Survey Staff, 1998) as estimated by Carsel and Parish (1988). Texture θ r θ s α (m -1 ) n K s (m d -1 ) Sand Loamy sand Sandy loam Loam Silt Silt loam Sandy clay loam Clay loam Silty clay loam Sandy clay Silty clay Clay Results from the analysis Measured retention data for the Mariching Valog and Varbitza site are shown in Fig. 6 and 7, respectively. 13
18 Pliocene clay Matric head (cm) Volumetric water content (cm 3 cm -3 ) Marichin Valog site Core No Core No Core No Core No Core No Core No Core No Core No Core No Core No Core No Core No Red clay Matric head (cm) Volumetric water content (cm 3 cm -3 ) Fig. 6 Measured retention data for cores taken from the Marichin Valog site. 14
19 1000 Weathered marl Varbitza site Core No. S1 Core No. S2 Core No. S3 Core No. S4 Core No. S5 Core No. S6 Core No. S7 Matric head (cm) volumetric water content (cm3 cm-3) Fig. 7 Measured retention data for cores taken from the Varbitza site. The raw laboratory data determined by the above mentioned experimental procedures are given in Appendix B, Table B-4. The so received soil water retention curves were optimized by the computer program RETC. One of the programme`s options is a simultaneous fit of pooled retention data (van Genuchten et al., 1991). This option results in a simultaneous fit of the van Genuchen model parameters (Eq. 3) to a set of observed soil water retention data from different samples (pooled data). The results from the computer analyses are presented in Tables 2, 3 and 4, respectively for the clayey gravel, Pliocene clay and weathered marl samples. Table 2. Parameter values for the clayey gravel (Pliocene clay) sample from the inverse optimization using RETC code. Parameter θ r was fixed at zero Parameter Best fit value S.E. coefficient Lower 95% Upper 95% θ s [cm 3.cm -3 ] α [m -1 ] n [-] R
20 Table 3. Parameter values for the Pliocene clay samples from the inverse optimization using RETC code. Parameter θ r was fixed at zero Parameter Best fit value S.E. coefficient Lower 95% Upper 95% θ s [cm 3.cm -3 ] α [m -1 ] n [-] R In order to have one more common (representative) result for the Pliocene clay samples the data for the volumetric water content were firstly averaged for the respectively pf value. The same procedure was applied for the weathered marl samples. Table 4. Parameter values for the weathered marl samples from the inverse optimization using RETC code. Parameter θ r was fixed at zero Parameter Best fit value S.E. coefficient Lower 95% Upper 95% θ s [cm 3.cm -3 ] α [m -1 ] n [-] R Observed and fitted retention curves are shown in Fig
21 Pliocene clay Matric head (cm) a) Water content (cm 3 cm -3 ) Red clay Matric head (cm) b) Water content (cm 3 cm -3 ) Weathered marl Matric head (cm) c) Water content (cm 3 cm -3 ) Fig. 8. Observed and fitted retention curves. (a) : Pliocene clay; (b): Red clay; (c) Weathered marl. 17
22 3.6. Results from the previous investigations In the framework of a site characterization campaign at the Marichin Valog site performed 2005, with assistance to site selection and site evaluation for low- and intermediate level waste disposal, thirteen undisturbed core samples from the vadose zone of the profile were analyzed according to the above mentioned methodology by the SCK CEN (Mallants et al., 2005). A description, some soil physical parameters and the raw laboratory results of the measurements volumetric water content pressure head are shown in Appendix C, Table C-1. The results after the inverse optimization with the computer program RETC are presented in Table 5. Table 5. Fitted van Genuchten moisture retention parameters (θ s, α and n); parameter θ r is fixed at zero, K s is measured(mallants et al., 2005) Sample No θ s α n K s cm 3 cm -3 cm -1 - m s -1 U E-07 U E-07 U E-07 U E-06 U E-07 U E-08 U E-08 U N.A. U N.A. U E-06 U N.A. U N.A. U N.A. Table 6. Fitted van Genuchten moisture retention parameters (θ s, α and n) from two investigation campaigns Type of soil Parameter Results 2005 Results 2007 Red clayey gravel θ s [cm 3.cm -3 ] α [m -1 ] n [-] Pliocene clay θ s [cm 3.cm -3 ] α [m -1 ] n [-]
23 A comparison between the results obtained in 2007 and 2005 investigations for the similar type of soils (for the Marichin Valog site) is presented in Table 6. The comparison shows a good correspondance in the n optimazed value but quite dispersive results for the α one for the both type of soils. Of course, the spatial variety has to be taken into account but further studies (e.g. large scale field investigations) are needed for more reliable estimates of the α value. 19
24 4. Conclusions The hydraulic properties of three types of soil samples were evaluated. The samples originate from the potential radwaste disposal sites vadoze zone. After the optimization procedure of the retention curves with the code RETC, van Genuchten model parameters were obtained. For the soils from the Marichin Valog site (red clayey gravel and Pliocene clay), the optimized retention curves were in good agreement with the data. According to the relatively short period of equilibrum established for the weathered marls, the parameters are not fitted very well and their further use must be carefully considered. The comparison between the results of 2005 and 2007 campaigns shows very good correspondence for the values of the saturation water content and the parameter n, taking into account the spatial variability. The values of parameter α are quite dispersive and an additional calibration is needed. The presented investigation is a very important step in the prediction of the movement of water and dissolved contaminants in the saturated and unsaturated zones of the subsurface environment from the long-term safety point of view, and it is a basis for comparison of the radwaste disposal sites in order that the best suitable one be selected. In addition, the study has also been very instructive for the staff of the Geological Institute of the Bulgarian Academy of Sciences in terms of technology transfer about new measurement techniques important in for the characterization of the deep unsaturated sediments in potential disposal sites. Acknowledgements This study was financially supported by the bilateral cooperation programme Royal Decree 25 April 2007 on Belgian support to improve the safety of nuclear installations in East and Central Europe and in the CIS (year 2007, project No. 7), (contract CO between SCK CEN and Federale Overheidsdienst Economie, K.M.O., Middenstand, en Energie). We are sincerely appreciative to Guido Rentmeester from the Catholic University of Louvain-La-Neuve, Unité de Genie Rural (UCL/AGRO/MILA/GERU) for his help in the determination of the retention data. References Carsel, R.F., and Parish, R.S., Developing joint probability distributions of soil water retention characteristics. Water Resour. Res., 24(5): Di Bonito. M Trace elements in the soil pore water. A comparison of sampling methods. PhD Thesis, University of Nottingham, 299 p. Evstatiev, D. et al Assessment of geological conditions for long-term storage of RAW on a site of and near to Kozloduy NPP. Modeling, analysis and general conclusions of results /3rd final stage report/. SE RAW fond library. Karastanev, D. et al Engineering Geological, Hydrogeological and Geophysical Investigations. Report for the State Enterprise Radioactive waste, SE RAW fond library. 20
25 Klute. A Water Retention: Laboratory Methods. In: Methods of Soil Analysis. 1. Physical and Mineralogical Methods. A. Klute Edt., SSSA Bok Series: 5, Soil Science Society of America, Inc. Publ., Mallants, D., D. Karastanev, D. Antonov The 2005 site characterization campaign at the Marichin valog site (Kozloduy), Bulgaria. Report N R-4285, 43 p. Mallants, D., Karastanev, D., and Antonov, D. (2006). The 2006 site characterization campaign at the Mariching Valog site (Kozloduy), Bulgaria. Assistance to selection and site evaluation for low- and intermediate level waste disposal in Bulgaria. SCK CEN report R-4419, SCK CEN, Mol, Belgium. Mallants, D., Karastanev, D., Antonov, D., and Perko, J., Innovative in-situ determination of unsaturated hydraulic properties in deep loess sediments in North- West Bulgaria. Proceedings of the 11th International Conference on Environmental Remediation and Radioactive Waste Management ICEM2007, September 2-6, 2007, Oud Sint-Jan Hospital Conference Center, Bruges, Belgium. Mualem, Y., A new model for predicting the hydraulic conductivity of unsaturated porous media. Water Resour. Res., 12: Soil survey staff, Keys to Soil Taxonomy, USDA, Natural Resources Conservation Services, Seventh Edition. van Genuchten. M. Th., F.J. Leij, S.R. Yates The RETC Code for Quantifying the Hydraulic Functions of Unsaturated Soils. User manual of the computer code RETC, US Salinity Laboratory, Riverside, California 92501, 85 p. 21
26 22
27 Appendix A 23
28 24


29 Fig. 1-A. Marichin Valog site with indication of the boreholes (after Evstatiev et al., 2003 and Mallants et al. 2005) 25

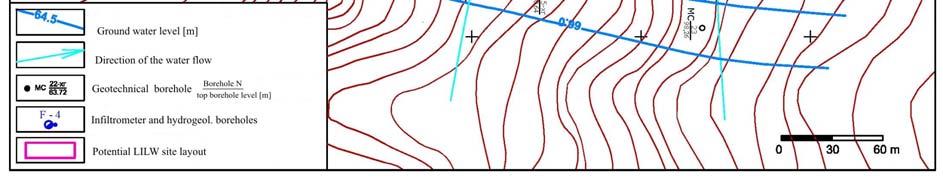
30 Fig. 2-A. Varbitza site with indication of the boreholes (by Karastanev et al., 2007) 26
31 Tabl. A-1. Description and physical parameters of the measured samples SITE Borehole Lab. N Description Depth Gravimetric water content, W Wet bulk density Dry bulk density Marichin Valog Marichin Valog F Red clay /gravel/ (transition zone) [m] [%] [g/cm 3 ] [g/cm 3 ] MB I 3663 Pl clay ,4 1,95 1,61 " MB I 3664 " ,8 2,03 1,66 " MB I 3665 " ,9 2,02 1,67 " MB I 3666 " ,8 2,06 1,69 " MB I 3667 " ,7 2,05 1,67 " MB I 3668 " ,8 2,03 1,65 " MB I 3669 " ,7 2,03 1,67 " MB I 3670 " ,4 2,06 1,70 " MB I 3671 " ,6 2,05 1,69 " MB I 3529 " " MB I 3530 " Varbitza MB Weathered marl ,9 2,30 2,06 " MB " ,5 2,31 2,05 " MB " ,2 2,32 2,07 " MB " ,0 2,28 2,00 " MB " ,1 2,30 2,04 " MB " ,4 2,30 2,05 " MB " ,8 2,28 2,00 " MB " ,2 2,22 1,95 " MB " ,3 2,15 1,83 27
32 28
33 Appendix B 29
34 30
35 Tabl. B-1. Scheme for the order of measurement of the soil samples Pliocene clay Method Pressure Duration. Laboratory number of the sample state minimum [pf] days saturation x x x x x x x x x x x 7 Sand bath x x x undisturbed sample x x x /-70 cm/ Start/End of the method The beginning of the experiment/approx. 21 days after the beginning of the experiment Pressure x-i x-ii x-ii x-ii x-i cell. undisturbed 2.4 x-i x-ii x-ii x-ii - x-i - 2 sample 3 - x-i x-ii x-ii x-ii - - x-i 2 Start/End of the method Approx. 7 days after the beginning/approx. 13 days after the beginning Pressure 3.5 1/3x-I 1/3x-II 1/3x-I 1/3x-I 1/3x-I 1/3x-II 1/3x-II 1/3x-II 1/3x-II 1/3x-II 1/3x-II 2 cell. disturbed 4 1/3x-I 1/3x-II 1/3x-I 1/3x-I 1/3x-I 1/3x-II 1/3x-II 1/3x-II 1/3x-II 1/3x-II 1/3x-II 2 sample 4.2 1/3x-I 1/3x-II 1/3-I 1/3-I 1/3-I 1/3x-II 1/3x-II 1/3x-II 1/3x-II 1/3x-II 1/3x-II 2 Start/End of the method Approx. 11 days after the beginning/approx. 17 days after the beginning of the experiment Note 1: The "1/3x" means one-third of the sample s length Note 2: The "x-i" and "x-ii" show the serial number of the batches for the pressure sells 31
36 Tabl. B-2. Scheme for the order of measurement of the soil samples weathered marl Method Pressure Duration. Laboratory number of the sample state minimum [pf] days saturation x x x x x x x x x 7 Sand bath x x x 7 undisturbed sample x x x 7 /-70 cm/ Start/End of the method The beginning of the experiment/approx. 21 days after the beginning of the experiment Pressure 2 x x x x-ii x-ii x-ii 2 cell. undisturbed 2.4 x x x x-ii x-ii x-ii 2 sample 3 x x x x-ii x-ii x-ii 2 Start/End of the method Approx. 7 days after the beginning /Approximately 13 days after the beginning Pressure 3.5 1/3x-II 1/3x-II 1/3x-II 1/3x-I 1/3x-I 1/3x-I 1/3x-II 1/3x-II 1/3x-II 2 cell. disturbed 4 1/3x-II 1/3x-II 1/3x-II 1/3x-I 1/3x-I 1/3x-I 1/3x-II 1/3x-II 1/3x-II 2 sample 4.2 1/3x-II 1/3x-II 1/3x-II 1/3x-I 1/3x-I 1/3x-I 1/3x-II 1/3x-II 1/3x-II 2 Start/End of the method Approx. 7 days after the beginning /Approximately 13 days after the beginning Note 1: The "1/3x" means one-third of the sample s length Note 2: The "x-i" and "x-ii" show the serial number of the batches for the pressure sells 32
37 Tabl. B-3. Scheme for the order of measurement of the soil samples Red clay /transition zone/ Method Sand bath. undisturbed sample Pressure cell. undisturbed sample Pressure cell. disturbed sample Pressure state Laboratory number of the sample Duration. minimum [pf] 3527 days saturation x 7 1 x /-70 cm/ x 7 2 x x 2 3 x x 2 4 x x 2 33
38 Tabl. B-4. Measured soil hydraulic properties of undisturbed and disturbed soil samples Sample Depth from the surface [m] Volumetric water content θ [cm 3.cm -3 ] pf 0 pf 1 pf 1.85 pf 2 pf 2.4 pf 3.0 pf 3.5 pf 4.0 pf 4.2 Red clay /gravel /3527/ Pl clay /3663/ Pl clay /3664/ Pl clay /3665/ Pl clay /3666/ Pl clay /3667/ Pl clay /3668/ Pl clay /3669/ Pl clay /3670/ Pl clay /3671/ Pl clay /3529/ Pl clay /3530/ Weathered marl /S1/ Weathered marl /S2/ Weathered marl /S3/ Weathered marl /S4/ Weathered marl /S5/ Weathered marl /S6/ Weathered marl /S7/ Weathered marl /S8/ Weathered marl /S9/
39 Appendix C 35
40 36
41 Sample No Tabl. C-1. Measured soil hydraulic properties of undisturbed soil samples from borehole N37 (Mallants et al., 2005) Soil Description Depth from the surface Bulk density Volumetric water content (cm 3 cm -3 ) at Total porosity pf 0 pf 0.5 pf 1 pf 1.5 pf 2 pf 2.3 pf 2.8 pf 3.4 pf 4.2 m g.cm -3 cm 3 cm U2 paleosoil U4 silty loess U5 silty loess U6 clayey loess U7 clayey loess U8 red clay U9 red clay (gravel) U10 clay (Pl) U11 clay (Pl) U12 sandy clay (Pl) U14 silty sand (Pl) U15 clay (Pl) U16 clay (Pl)