City of Yuba City. Yuba City Update to Water Demand and Infrastructure System Evaluation. Technical Memorandum
|
|
|
- Merry Caldwell
- 5 years ago
- Views:
Transcription

1 City of Yuba City Yuba City Update to Water Demand and Infrastructure System Evaluation Technical Memorandum July 2006
2
3 Table of Contents Introduction... 1 Background...1 Purpose and Objectives...1 Water Demands and Supply... 2 Planning Areas...2 Water Demand Analysis...2 May 2004 Water Master Plan Projected Buildout Water Demands...2 May 2006 Revised Projected Buildout Water Demands...3 System Evaluation Assumptions and Criteria... 5 Updated Water Distribution System...5 Model Update...7 Model Calibration...9 Field Data...9 Calibration Process...9 Hydraulic Calculations...10 System Analysis...10 Booster Pumping Station (BPS)...12 Existing BPS Capacity (Distribution System)...12 Storage Tank Facilities...12 Operational...13 Emergency...13 Fire...13 Existing Storage Facility Assessment...13 Future Park Irrigation...14 Recommended improvements...15 Future Distribution Piping Improvements...15 Transmission Main...15 Pressure Reducing Valves...16 Future BPS Capacity...16 Future Storage Facility Assessment...18 Results of Extended Period Simulations...19 Phasing of Distribution and T-main System Infrastructure Improvements...20 Phase 1 Improvements...20 Phase 2 Improvements...20 Phase 3 Improvements...21 Fire Flow Improvements (Regions 1, 2, and 3)...21 Water System Cost Estimates...22 Cost Estimating Accuracy...22 Baseline Construction Costs...22 Pipelines...22 Bore and Jack Casing...23 Storage...23 BPS...24 Construction Contingency...24 Engineering, Administration, and Construction Management Costs...24 Capital Improvement Program (CIP)...24 Water Distribution System Costs...24
4 Tables: Table 1. May 2004 WMP Projected Buildout Water Demands...3 Table 2. Buildout Population Based on Lower Limit Land-Use Densities...4 Table 3. Buildout Population Based on Upper Limit Land-Use Densities...4 Table 4. Revised Projected Buildout Water Demands...4 Table 5. Generic Diurnal Curve Information (Used to Operate in Extended Period Mode)...7 Table 6. Selected Fire Flow Sites used for Model Calibration...9 Table 7. Roughness Coefficients Table 8. System Pressure and Velocity Criteria Table 9. Yuba City Hydraulic Model: Buildout Demands Used in Model...11 Table 10. Existing Booster Pumping Capacity...12 Table 11. Insurance Service Office Fire-Flow and Storage Requirements Table 12. Existing Storage Facility...14 Table 13. Existing Minimum Water Storage Capacity Required (Surface Water System) Table 14. Recommended Firm Pumping Capacities from WTP s HLPS...16 Table 15. Total Booster Pumping Capacity Needed at Buildout...17 Table 16. Recommended BPS Locations and Capacities (Distribution System) Table 17. Buildout Condition s Minimum Total Storage Capacity Required Table 18. Recommended Future Tank Locations and Capacity Summary Table 19. Pipe Construction Unit Costs Table 20. Estimated Bore and Jack Unit Costs Table 21. Storage Tank Estimated Unit Costs...23 Table 22. Phase 1 Estimated Capital Improvement Costs Table 23. Phase 2 Estimated Capital Improvement Costs Table 24. Phase 3 Estimated Capital Improvement Costs Table 25. Fire Flow Piping Capital Improvement Costs (Regions 1, 2, and 3)...25 Figures: Figure 4-3. Updated City of Yuba City Buildout SOI Proposed Improved Distribution System...6 Figure 1. Generic Diurnal Curve....8 Appendices: Appendix A. Detailed Cost Estimates Appendix B. Calibration Data - Pump and Reservoir Information Appendix C. Calibration Data - Static and Residual Pressures and Hydrant Flows Appendix D. Examples of Typical PRV Stations
5 HDR prepared the City of Yuba City s May 2004 Water System Master Plan Update. The May 2004 water master plan (WMP) evaluated the current and future water needs for the City and the City s Sphere of Influence (SOI), including the former Hillcrest Water Company groundwater regions acquired by the City in May The result of the master plan s evaluations was the proposed Capital Improvement Program (CIP) for the City s water distribution system and Surface Water Treatment Plant (SWTP). The CIP identifies improvements needed to meet the projected growth and water demand in the City, former Hillcrest Regions, and future developments in the SOI. The May 2004 WMP was based on the land use proposed for the City s 2004 General Plan Update. At buildout conditions, the General Plan anticipated that additional housing units will be within the currently undeveloped areas of the City s SOI (which is primarily within the master plan s Regions 4A/5A and 4B/5B). The May 2004 WMP estimated the number of additional housing units at buildout based on the lower limits of the land-use densities allowed in the General Plan. This update considers and reflects the upper limit of these densities allowed in the General Plan. The additional dwelling units calculated using the upper limit will result in higher water demands than those discussed in the May 2004 WMP. An update of the water model (taking into consideration the revised water demands) and an updated infrastructure system evaluation is required to assist with planning the future capital water infrastructure improvements. The purpose of this technical memorandum (TM) is to summarize the assumptions, evaluation results, and the team s recommendations developed from the water modeling update and infrastructure system evaluations. The evaluation will include the following: Review of the water demands to determine the impacts of the additional dwelling units anticipated within the undeveloped areas of the City s SOI at buildout conditions. The evaluation of the City s surface water distribution system. Update to the hydraulic model to include new infrastructure constructed after the May 2004 WMP was finalized. Update to the hydraulic model to reflect the revised buildout water demands. Expansion of the steady-state water model to a dynamic model capable of performing extended period simulations (EPS). The dynamic model will allow the City to perform water age simulations if needed to comply with the new Stage 2 Disinfection By- Product s requirement for Initial Distribution System Evaluations (IDSE).
6 The water demands will be updated so that the City may determine if the City s water treatment and distribution facilities are adequately sized to ensure reliable water service for future conditions. This update considered the same planning areas used in the May 2004 WMP evaluations. The City s SOI includes the following regions (see Figure 2-1 in the May 2004 WMP): City of Yuba City. Region 1 (formerly known as Hillcrest Water Region 1). Region 2/3 (formerly known as Hillcrest Water Region 2/3). Region 5 (formerly known as Hillcrest Water Region 5 - Tierra Buena area). Region 4A/5A planning area. Region 4B/5B planning area. The City s SOI is bordered by the Feather River to the east, Pease Road to the north, Township Road to the west, and Bogue Road to the south. Although the City has recently incorporated most of Region 2/3 within the City limit, this update will evaluate Region 2/3 as a separate planning area. Currently, surface water service is provided only within the existing City limit boundary and Region 5. All other areas within the service area are served by groundwater wells. Regions 4A/5A and 4B/5B are primarily undeveloped. In addition, the following unincorporated areas were also included in the City s water service area evaluation: Region 6 planning area. Region 7 planning area. These areas were included in the update evaluation to plan for the possibility of future water infrastructure extension to these regions. May 2004 Water Master Plan Projected Buildout Water Demands To be consistent with the City s 2004 General Plan Update, the May 2004 WMP estimated buildout water demands in the SOI using the per capita projection method and peaking demand factors. The buildout condition s average annual demand was estimated based on the General
7 Plan s projected population and a demand factor of 273 gpcd. The projected population was based on: The average density (dwelling units per acre for each residential land use classification). Acreage available in the undeveloped areas of the SOI. Average household size of 2.67 people per dwelling unit. The 2004 General Plan Update reported the total population at buildout will be approximately 108,300 people in the City s SOI, with a majority of the population increase in the undeveloped areas of the SOI. The May 2004 WMP considered that most of the population growth would occur in Regions 4A/5A and 4B/5B. Table 1 summarizes the projected buildout water demands reported in the May 2004 WMP. Planning Area Population Average Annual (MGD) Maximum Day (MGD) Peak Hour (MGD) Yuba City 43, Regions 1 and 2/3 9, Region 5 (Tierra Buena) 3, Regions 4A/5A and 4B/5B 52, Total SOI (Buildout) 108, Region 6 3, Region 7 7, Total Water Service Area (Buildout) 118, Park Irrigation (Regions 1, 2/3, 5, 4A/5A, 4B/5B) Total Water Demand 118, Water savings due to conservation measures are accounted for by using a demand factor of 273 gpcd. Projected average annual demand based on a per capita demand factor of 273 gpcd. Maximum Day demand = 2.0 peaking factor x average annual demand. Peak Hour demand = 3.5 peaking factor x average annual demand. Regions 6 and 7 are presented for water infrastructure planning purposes. Park Irrigation demand will be supplied by existing and future groundwater wells. May 2006 Revised Projected Buildout Water Demands At the kickoff of this project, the City requested that HDR evaluate the buildout water demands based on the upper limit land-use densities allowed in the General Plan. The higher densities would result in higher number of dwelling units and therefore, higher population projection. Table 2 summarizes the residential average densities considered for the May 2004 WMP. Table 3 summarizes the higher densities considered in this project. Table 4 summarizes the revised projected buildout water demands based on the higher land-use densities and resulting population as reported in Table 3.
8 ! Residential Land Type Acres Avg. Density Units/Acre Total Additional Housing Units (Dwelling Unit) Additional Population (2.67 Persons/Unit) Single Family - Low Density 3, ,150 43,120 Single Family - Low/Medium Density ,570 14,870 Medium/High Density ,640 15,060 Total 4,655 27,360 73,050 Based on land use and buildout acreage of undeveloped lands reported in Table 3-2 of General Plan. Based on residential average densities reported in Chapter 3 of the General Plan. "!! Residential Land Type Acres Avg. Density Units/Acre Total Additional Housing Units (Dwelling Unit) Additional Population (2.67 Persons/Unit) Single Family - Low Density 3, ,910 55,830 Single Family - Low/Medium Density ,190 16,530 Medium/High Density ,640 15,060 Total 4,655 32,740 87,420 Based on land use and buildout acreage of undeveloped lands reported in Table 3-2 of General Plan. Higher residential average densities based on information provided by City at project s 03/20/2006 kickoff meeting. # $ Planning Area Population Average Annual (MGD) Maximum Day (MGD) Peak Hour (MGD) Yuba City 43, Regions 1 and 2/3 9, Region 5 (Tierra Buena) 3, Regions 4A/5A and 4B/5B 52, Additional Population 36,110 * Total SOI (Buildout) 144, Region 6 3, Region 7 7, Total Water Service Area (Buildout) 154, Park Irrigation (Regions 1, 2/3, 5, 4A/5A, 4B/5B) Total Water Demand 154, Water savings due to conservation measures are accounted for by using a demand factor of 273 gpcd. Projected average annual demand based on a per capita demand factor of 273 gpcd. Maximum Day demand = 2.0 peaking factor x average annual demand. Peak Hour demand = 3.5 peaking factor x average annual demand. Regions 6 and 7 are presented for water infrastructure planning purposes. Park Irrigation demand will be supplied by existing and future groundwater wells. * The General Plan noted the additional population to only be approximately 51,310 people in the SOI. Therefore, this evaluation considered the additional population increase to be closer to 36,110 people ( people).!
9 # $ The same criteria used in the May 2004 WMP were used to evaluate the adequacy of the existing water distribution systems, including storage and booster pumping facilities. The updated evaluations focused on the water service area through buildout of the current City limits and SOI. % For this update, the entire water service area was evaluated to meet current and buildout water demands. This section summarizes: A description of the development and calibration of the hydraulic model. Results of the hydraulic evaluation to alleviate current and projected future deficiencies in the distribution system. Storage and booster pumping capacity evaluation. The distribution system was modeled for the following alternatives: 1. The existing City of Yuba City proper, including new pipe additions and water system improvements since publication of the May 2004 WMP. Source of water is surface water. 2. Existing Regions 1, 2, and 3 were modeled considering only treated surface water as the source for future distribution system improvements. 3. Future buildout of the City SOI including Yuba City and Regions 1, 2, 3, 5, 4A/5A, and 4B/5B. The May 2004 WMP s Figure 4-3 was updated to show the proposed improvements recommended based on the latest water model update and results of the latest infrastructure evaluations (see the revised Figure 4-3). The pipe length totals presented in this TM reflect recommended improvements for future SOI buildout, except for the piping improvements inside of Region 5, which were included in the 2002 Tierra Buena Report. "
10
11 Model Update The updated Yuba City hydraulic model was prepared in WaterCAD version 7. The steadystate model created for the May 2004 WMP was updated by City staff to include new piping constructed since the previous model was used. The model database was updated with new piping greater than 8 IN in diameter. Pipes less than or equal to 8 IN were included when closing a loop or serving a large customer. The model was also modified to enable it to operate in extended period mode. This included the following edits: Changing existing reservoirs from fixed grade nodes to tanks so that water levels in the reservoirs could be simulated. Adding controls on pumps so that they will start and stop as appropriate. Inserting a diurnal curve in the model. Since the City had limited historical SCADA information, a generic diurnal curve was used. See Table 5 and Figure 1 for information on the generic curve considered. -. ' $,( /! Hour Demand Factor Hour Demand Factor 0 (Midnight) (Noon) (Midnight) 0.33 '
12 Figure 1 - City of Yuba City Hydraulic Modeling Generic Diurnal Curve Demand Factor Midnight Noon Midnight Hour of Day
13 Model Calibration Field Data Field data was collected for the calibration effort by City staff in April Data was collected for eight separate fire flow sites in the distribution system. The sites were selected based on their location with respect to existing pump stations and reservoirs, their location on the end of dead-end lines, and the ability to access the site and discharge large flows to the surface safely. The sites are identified in Table 6. 3*%% *( ' Fire Flow No. Flow Hydrant Junction Name Gage Hydrant Junction Name 1 End of Brandywine Drive cul-de-sac FF Flow 1 (J-635) Royo Ranchero and Brandywine Drive FF Gage 1 (J-634) 2 End of Century Park Drive cul-de-sac FF Flow 2 (J-159) Century Park Drive and Hunn Road FF Gage 2 (J-157) 3 End of Utah Court cul-de-sac FF Flow 3 (J-690) Utah Court and Eureka Drive FF Gage 3 (J-691) 4 End of Sombra Court cul-de-sac FF Flow 4 (J-14) Sombra Court and Serena Drive FF Gage 4 (J-18) 5 End of Chloe Court cul-de-sac FF Flow 5 (J-805) Chloe Court and Tre Picos Drive FF Gage 5 (J-806) 6 End of Messina Court cul-de-sac FF Flow 6 (J-946) Messina Court and Messina Drive FF Gage 6 (J-366) 7 End of Kira Court cul-de-sac FF Flow 7 (J-96a) Kira Court and Hooper Road FF Gage 7 (J-666) 8 Masera Way and Allen Way FF Flow 8 (J-884) Josephine Way and McCune Avenue FF Gage 8 (J-882) Information on the status of pumps (on/off), pump flows, pressure at pump discharge, at clearwell/reservoir water levels are included in Appendix B. Static and Residual pressures and hydrant flows during the fire flow test are included in Appendix C, along with the modeling results. Calibration Process The following steps were taken during the calibration process: Demand for the day of the fire flow tests was approximated based on existing demand conditions and allocated to the junction nodes in the model. Pumps operating during the tests were set as on and those not operating were set as off. Water levels in the reservoirs were set at the levels identified in the tables. )
14 A simulation was run without any fire flows to determine the static pressure for the system. The resulting pressures were recorded and are included in Appendix C. Flow through each operating pump was also identified and compared with the field measured flows. Static pressures from field and model were compared to identify where there were significant differences. Since all sites were within 4 psi and the model was both higher and lower than the field values (average difference 1.8 psi), static pressures were considered to be calibrated for planning level analysis. Each fire flow was modeled by adjusting the demands in the model to include the fire flow measured during the field analysis. Eight separate simulations were performed, one for each fire flow. The resulting pressure at the gage junction was recorded and is presented in Appendix C. During the initial evaluation, modeled pressures at the gage hydrants were uniformly higher than were the field values. Friction factors (C-factors) were adjusted downward to increase friction losses in the pipes. The eight fire flow simulations with lower C-factors were run to confirm the new values. Appendix C lists the final pressure values for the static and fire flow conditions. The resulting model is considered calibrated for planning purposes. Additional calibration should be completed to use the model for water age analysis. This additional calibration will consist of extended period simulations of known system demand with the intent to match water levels in reservoirs and pumping operations between the model results and field conditions. Hydraulic Calculations The model calculations were based on the Hazen-Williams equation. Roughness coefficients are presented in Table 7. Pipes sizes were based on design constraints for pressure, flow, and pipe velocities. 4# &5' (( Hazen-Williams Roughness Coefficient Existing Piping 100 Proposed Piping 130 System Analysis The updated water model was evaluated for the three operational scenarios to determine system improvements required to meet minimum pressure and velocity requirements. The scenarios modeled consisted of the following: Normal operation Average day demand and maximum day demand. Peak hour (135.1 mgd for SOI buildout condition). *
15 The system criteria used in the May 2004 WMP were used for the latest infrastructure evaluations. The system evaluation criteria are defined in Table 8 for these three operational scenarios. 6* 7 ' System Criteria Maximum Day and Peak Hour maximum velocity Allowable Velocities Fire-Flow maximum velocity Normal Operation maximum pressure Normal Operation minimum pressure Allowable Pressures Peak Hour minimum pressure Fire-Flow minimum pressure (at all nodes) 7 fps 10 fps 60 psi 40 psi 30 psi 20 psi The hydraulic model was used to determine how to move water across the system from the Water Treatment Plant (WTP) to the extent of the proposed water service area. The analysis used projected buildout maximum day and peak hour demands and identified improvements needed to meet minimum pressure requirements under the demand conditions. There was no analysis of adequacy during fire flow conditions. New piping in the model was limited to 12 IN and larger and typically followed main street alignments (approximate 1 mile grid). New piping, reservoirs, and pump stations, as identified in Figure 4-3 of the May 2004 WMP, were inserted in the calibrated model. Three additional reservoir/pump station facilities were also inserted into the model. See the updated Figure 4-3 for the locations of the new facilities. The new piping projects kept the same name as listed in the CIP tables from the May 2004 WMP. Each junction in the model was assigned a Region designator. Buildout demands were allocated proportionally to the junctions so that all junctions within a Region had the same demand. Table 9 lists the demands by pressure zone and the number of junctions that have been assigned to each Region. 8) ' 9 :! Region Maximum Day Demand (MGD) Number of Junctions Yuba City Region Region Region Region 3/ Region 4/5A Region 4/5B Region Region Pump Station - 41
16 Region Maximum Day Demand (MGD) Number of Junctions Transmission - 50 Total ,062 Pump station designation is for nodes at existing and proposed reservoir/pump station sites and have no customer demands. Transmission designation is for junctions located along the proposed T-main loop. Regions 3/7 are for the three nodes along the southern perimeter or Region 3 that will connect to future piping in Region 7. An evaluation of the piping included in the calibrated model identified those projects from the May 2004 WMP that had already been installed. These completed projects were removed from the list of proposed projects, and remained in the model. +, Existing BPS Capacity (Distribution System) Table 10 summarizes the City s existing BPS capacity in the surface water distribution system. The City s existing High Lift Pumping Station (HLPS) at the WTP has a firm pumping capacity of 30 mgd and delivers treated surface water to the distribution system in the City and Region 5 only. Since the distribution system in the City does not have sufficient booster pumping capacity, the HLPS must also contribute to the peak demands in the City and Region 5. As noted in Table 2-7 in the May 2004 WMP, the current peak hour demand from the City is mgd and from Region 5 is 2.98 mgd. The total treated surface water distribution system s existing peak demand is 41.2 mgd. Therefore, with the existing HLPS, the City has sufficient booster pumping capacity to meet the current surface water peak demands in the City and Region 5. 01& &' Location Firm Pumping Capacity (MGD) Water Treatment Plant (Existing HLPS) 30.0 Booster Pumps at Sam Brannon Tank Site 1.3 Booster Pumps at Rowe Avenue Tank Site 1.3 Booster Pumps at Burns Tank Site 3.3 Booster Pumps at Harter Tank Site 10.8 Total This project used the same storage tank sizing criteria used in the May 2004 WMP. There are three components of storage volume normally attributed to each storage facility: Operational Emergency Fire
17 Operational The intent of operational storage is to provide the difference in quantity between customers peak demands and the system s available supply, which is typically designed to only meet the maximum day demand. Operational storage is replenished during off-peak hours when demand is lower than the supply production rate. With operational storage, system pressures are improved and stabilized to better serve customers throughout the service area. Operational storage is approximately equal to 25 percent of the maximum day demand. Emergency Fire Emergency storage volume is recommended to meet water demand during emergency situations such as pipeline failures, major T-main failures, pump failures, electrical power outages, or natural disasters. The volume of water allocated for emergency uses is determined based on historical records of emergencies, and on the amount of time which is expected to lapse before the emergency state can be corrected. As in the May 2004 WMP, this evaluation calculated the emergency storage volume to be equivalent to 75 percent of average day demand. Fire storage volumes vary and will be based on the requirements of the Insurance Services Office (ISO). Table 11 summarizes the minimum fire-flow requirements for different land use categories and with duration of 4 hours. Storage volume is calculated by multiplying the flow rate by 4 hours. Fire storage should typically be provided in each tank to assure it can flow easily to the fire event.,*$+ ((% % *&# ; Land Use Category Minimum Flow at 20 psi (GPM) Storage Volume (GAL) Residential Low Density 2, ,000 Residential Medium Density 3, ,000 Commercial 5,000 1,200,000 Industrial 5,000 1,200,000 Schools, Hospitals, Civic 4, ,000 According to ISO requirements, flow rates may be met by any combination of pumping and storage. A 2,000 gpm residential fire that lasts 4 hours would require 480,000 gallons (gal) of stored water, and a 5,000 gpm industrial fire that lasts 4 hours would require 1,200,000 gal of water. The City would be required to have the larger of the two volumes, or 1,200,000 gal of water stored for fire fighting purposes. Existing Storage Facility Assessment The WTP is designed to supply the distribution system s maximum day demands. When demand exceeds the established maximum day demand, additional volume is provided from storage facilities, requiring less treatment capacity. Once demand falls below the maximum day
18 demand, excess water produced by the WTP goes into storage. A properly designed and operated water system has a net storage change of zero in any 24-hour period. Each ground level tank location includes a BPS. The tanks are equipped with altitude valves that control water levels. The City s existing storage facilities are summarized in Table 12. Since the May 2004 WMP was finalized, the City has constructed two of the recommended storage tanks: New Clearwell at WTP (4 MG Total). New Harter Storage Tank (4 MG Total). The Harter tank was identified in the May 2004 WMP as the New UPRR/Elmer Drive. Table 13 summarizes the minimum required storage capacity needed in the surface water system servicing the City and Region 5. With the recent addition of the Harter Tank, the City has sufficient storage capacity in the surface water system. 01&*&% Tank Site Type Total Storage Capacity (MG) Water Treatment Plant Old Clearwells (2) Partially Buried - Pre-stressed Concrete New Clearwell Partially Buried - Pre-stressed Concrete Harter Tanks Ground level Steel 4.0 Sam Brannon Tank Ground level Steel 1.0 Rowe Avenue Tank Ground level Steel 1.0 Burns Tank Ground level Steel Sub-Total Existing Storage 17.0 "01& *&' # ; /*( * 2 Existing Surface Water Service Area Average Day Demand MGD Maximum Day Demand MGD 25% of MD 75% of AA Minimum Storage Requirements (MG) Operational Emergency Fire Total 5000 gpm x 4 hrs Storage Yuba City, Existing Limits Region Total Surface Water Service Area It was assumed parks would be irrigated with groundwater.!
19 / This section presents the recommended improvements identified during the May 2006 modeling analysis for the City of Yuba City potable water service area. This includes all recommended improvements to the service area. The improvements required for each phase of the development are listed below.. The model was set up to operate the water system slightly differently than from previous simulations. Because of the maximum pressure limitation in the distribution piping near the WTP, it was determined it would be impossible to move water across the system (from the WTP within the distribution piping) and still meet the minimum pressure requirements. Thus, a portion of the existing and proposed large diameter piping was used to create a transmission main (T-main) loop around the water service area. Transmission Main The pipelines used in the T-main are listed below: An existing 30 IN pipeline south from the WTP along Live Oak Blvd, Ainsley Avenue, Orange Street, Rosalind Avenue, and Cooper Avenue to the intersection of Cooper and B Street. The existing connection between this line and the distribution system piping at Cooper and Freemont will be disconnected and a Pressure Reducing Valve (PRV) (TPRV-2) is installed between the T-main and the distribution system piping at Cooper and B Street. A new 30 IN pipeline south on Clark/Bunge to Lincoln. A PRV (TPRV-3) is proposed to be installed between the T-main and the distribution system piping at Clark/Bunge and Lincoln. The existing 24 IN pipe that feeds the Burns Reservoir is then connected to the 30 IN T-main at this location. A new 30 IN pipeline west on Lincoln from Clark/Bunge to George Washington Way. A new 30 IN pipeline north on George Washington Way from Lincoln to Franklin Road. A PRV (TPRV-7) is installed between the T-main and the distribution systems at George Washington Way and Franklin. A new 30 IN pipeline east on Franklin from George Washington Way to Harter Road. A new 36 IN pipeline north on Harter from Franklin to State Highway 20 where it connects to the existing 36-inch pipeline. A PRV (TPRV-12) is installed between the T- main and the distribution systems at Harter and State Highway 20. An existing 36 IN pipeline north on Harter from State Highway 20 to Butte House Road. A new 36 IN pipeline east on Butte House Road and north on Blevin from the end of the existing pipeline on Harter to Blevin and Jamie. "
20 A new 42 IN pipeline east on Jamie to the WTP. A PRV (TPRV-16) is installed between the T-main and the distribution systems at North Ridge and W. Onstott Frontage Road. The T-main will be operated to deliver water to the PRVs and reservoirs. With the construction of the T-main, there will effectively be two pressure zones in the Yuba City water system: 1) the T-main system and 2) the distribution system. Pressure in the T-main will be approximately 110 psi at the WTP and will drop farther from the WTP. The recommended T- main pressure is based on maintaining a minimum of 60 psi in the T-main at buildout condition. At the T-main capacity of 66 mgd (buildout), the model estimated about 50 psi pressure drop between the HLPS and the most SW corner of the City s SOI. Therefore, a minimum of 110 psi is needed to maintain 60 psi at the most SW corner of the City s SOI. Direct connections between the T-main and the system reservoirs will be included to aid in refilling the reservoirs. The T-main will act to transfer water throughout the Yuba City water service area without increasing pressures in the distribution system. Pressure Reducing Valves Pressure reducing valves are proposed at locations remote from the proposed BPS/reservoir sites and where the proposed T-main is near the proposed distribution system piping. A total of 16 PRVs were initially considered and ultimately reduced to the five PRVs listed above. Because of the reduced number of PRV s, some booster pumping operation maybe needed to meet maximum day demands. See Appendix D for some examples of a typical PRV station. For Yuba City, a 3-valve PRV station is proposed.. $ The T-main will operate at a higher system pressure than that produced by the WTP s existing HLPS. Therefore, a new HLPS is needed at the WTP to primarily feed the T-main. Table 14 summarizes the required pumping capacity from the WTP s HLPS for the different CIP phases. # % &' ( <9 * CIP Phase Flow to Distribution System (MGD) Flow to T-Main System (MGD) Total HLPS Firm Capacity (MGD) Phase Phase Phase Flow to distribution system will be at a lower system pressure (59 psi maximum). Recommend using existing HLPS at WTP. Flow to T-main will be at a higher system pressure (approximately 110 psi). Recommend designing new HLPS to deliver water to T-main at higher pressure. &
21 Water will be provided to the distribution system from the 1) WTP s existing HLPS and 2) T- main through PRV s set at approximately 60 psi. The booster pumps at the reservoirs will operate based on pressures in the distribution system. If the PRVs are unable to maintain adequate pressure, the booster pumps will start to augment the pressure. During low demand seasons, the pumps will operate on timers to ensure that the reservoirs will not become stagnant. With the T-main being used for reservoir refill, pumps at the reservoirs can operate at the same time as when reservoirs are being filled. Thus, the reservoir will not empty, even if the pumps have to operate continuously. Pressures in the distribution system near the reservoir will not fluctuate between high pressures (as the pumps operate) and low pressures (during reservoir refill). The BPS in the distribution system will draw water from the reservoirs and deliver the water to the distribution system. With this approach, the combined pumping capacity of all the BPS should equal or exceed the peak hour demands minus the flow from the existing HLPS and through the proposed PRV s to the distribution system. Since the number of PRV s was reduced, the booster pumps must operate a few hours during maximum demand days. Table 15 summarizes the minimum pumping capacity needed to meet buildout peak demands. Table 16 summarizes the recommended BPS needed in the distribution system (based on evaluated extended period simulations). The capacity of each BPS will depend on the demand of the local service area directly served by the pumping station. Some stations may need smaller pumping capacities than what is recommended. The capacities may also be reduced if more T-main PRVs are installed. - &' = Demand Condition Flow (MGD) SOI Peak Hour Demand Flow to Distribution System * 57.9 Existing Booster Pumping Capacity (firm) (without existing HLPS at WTP) ** Required Peak Demand Pumping Capacity (firm) 77.2 Minimum Additional Booster Pumping Capacity Needed 60.5 * Estimated flow from existing HLPS and PRVs is approximated to be midway between buildout SOI average day demand (38.6 mgd and maximum day demand 77.2 mgd). ** Based on information from Table 10 without the WTP HLPS. The Existing HLPS will be delivering only maximum day demand flows into the distribution '
22 3# *' / * 2 Site Firm Pumping Capacity (MGD) Expansion of Existing Burns Tank (provide additional 7.7 mgd) 7.7 Proposed BPS at Franklin Tank Site 16.4 Proposed BPS at Sanborn Tank Site 8.5 Proposed BPS at Lincoln Tank Site 8.6 Proposed BPS at Jamie Tank Site 7.8 Proposed BPS at Hooper Tank Site 8.0 Proposed BPS at Lassen Tank Site 8.0 Proposed BPS at Royo Tank Site 8.0 Total Additional Booster Pumping Capacity Tanks were located throughout the SOI at locations of highest demand and along the proposed T-main. The number storage tanks needed and the size of each facility were determined based on model results. Table 17 summarizes future SOI storage tank requirements and includes the additional population anticipated due to higher residential average densities. By buildout of the water service area, the total storage capacity required will be 50.6 MG. As noted in Table 12, the existing storage volume is 15.9 MG. Therefore, a minimum of 34.7 MG additional storage capacity is needed in the distribution system at buildout. 4' < *&' # ; Planning Area Average Day MGD Operational Emergency Fire Maximum Day MGD 25% of MD 75% of AA 5000 gpm x 4 hrs Total Storage Yuba City, existing limit Regions 1 and 2/ Region 5 (Tierra Buena) Region 4A/5A and 4B/5B Additional Population Total SOI Region Total Water Service Area Table 18 summarizes the tanks recommended to provide sufficient storage capacity under buildout conditions. The size and locations of these tanks are based on the water model results. See the updated Figure 4-3 for tank locations. In addition to the tanks recommended in the May 2004 WMP, three additional proposed tanks are noted in Table 18. The three reservoirs (Hooper, Lassen, and Royo) have been added to this update since the May 2004 WMP and are also directly connected to the T-main. Additional T-main to supply Hooper and Royo has been (
23 included in the model. Capacities for the pump stations and volume of reservoir have been assumed based on information for other proposed reservoirs and not optimized. 6# %>' * Storage Tank Reservoir Volume (MG) Proposed Burns Reservoir 3.0 Second Burns Tank General Location Proposed Franklin Tank 6.0 Harter and Franklin Road Proposed Sandborn Tank 3.2 Lincoln Road and Sandborn Road Proposed Lincoln Tank 3.2 George Washington Blvd and Lincoln Road Proposed Jamie Tank 3.0 Blevin and Jamie Proposed WTP Clearwell No WTP Site New Proposed Hooper Reservoir 6.0 Jamie and Hooper New Proposed Lassen Reservoir 6.0 Harter and Lassen New Proposed Royo Reservoir 3.0 Royo Ranchero and Highway 20 Totals 37.4 / 0#1 Extended period simulations were performed to determine the effectiveness of the proposed system. Pressures throughout the entire modeled water system range between 40 and 60 psi throughout the entire 24-hour simulation. Reservoirs fluctuate between 5 feet of drawdown and full. The booster pumps in the system operate during the highest demand period of the day and are off for the lower demand periods. Since the reservoirs are filled from the T-main and the booster pumps deliver water to the distribution system, reservoirs can be filling at the same time as the pumps are operating. This allows the reservoir water levels to remain within the top five feet of the reservoir. Total pumping to the distribution system and to the T-main system from the WTP was simulated to reach a high of approximately 96 mgd. Of this, a maximum of 30 mgd was modeled to pump to the distribution system. The remainder is pumped to the T-main. Flows pumped to the T-main system enter the distribution system through the five PRVs or are pumped into the distribution piping at the reservoirs by the booster pumps. The results of this set of simulations can be used to develop a detailed Capital Improvement Program. Additional simulations are needed to optimize the operations of the T-main system and the BPS. Required capacities of the BPS and the maximum flow rate into the reservoirs need to be finalized. Controls for the starting and stopping of the booster pumps should be reviewed and modified as needed. Additional steady-state calibration should be performed as new water system infrastructure facilities are constructed. Extended period calibration should be completed prior to using the model for analysis of changes to system operation or for detailed water age analysis. )
24 The model is quite sensitive to the settings for booster pump starts and stops and can fail to converge to a solution. The setup evaluation described above should assist in reducing the sensitivity in the model This evaluation considered that same phasing approach that was used in the May 2004 WMP. The recommended improvement projects in Phase 1 are necessary to correct current deficiencies within the City and Region 5. Recommended improvements in Phase 2 will improve both system operation and performance, and allow for Regions 1, 2, 3 and portions of 4A/5A and 4B/5B to receive treated surface water. Improvements in Phase 3 are needed to meet buildout conditions projected for the SOI and Region 6. As in the May 2004 WMP, distribution system piping improvements for Regions 1, 2, and 3, have been identified separately from fire-flow piping improvements. Only Regions 1, 2, and 3 s distribution piping improvements have been included in each CIP phase. No planning period has been identified for Regions 1, 2, and 3 s fire flow piping improvements. Phase 1 Improvements There improvements are primarily for the existing water distribution system within the City and Region 5 to meet City s operating criteria. This phase also includes improvements to the treated surface water distribution system to service Region 5, new residential developments in the western portion of the City, and alleviating operation concerns near the existing Burns reservoir and BPS. The priority improvements that are needed prior to the Phase 2 Improvements are: Completion of ExYC-1 (30 IN Piping) from B-Street/Cooper to Lincoln/Clark. Installation of TPRV-2 (PRV assembly in vault) near Frederick and Cooper. Transfer existing distribution system connection to PRV assembly. Installation of TPRV-3 (PRV assembly in vault) near Lincoln and Bunce at point where 24 IN piping goes to Burns tank. Installation of Proposed Burns Reservoir (3.0 mgd) at the existing Burns Tank site. Expansion of the existing BPS at the Burns Tank site to increase pumping capacity to 12.5 mgd. Phase 2 Improvements Includes those improvements needed to create the T-main system dedicated to filling storage tanks and delivering flow to the distribution system via pressure reducing valves (PRV assembly). The T-main will be operating at a higher system pressure (approximately 110 psi near WTP) than the treated surface water distribution system. The distribution system will *
25 have system pressures as noted in Table 8. The water model limited the amount of flow that is fed directly into the distribution system (from the WTP s high lift pumping station or HLPS) to 30 mgd, which is the firm capacity of the WTP s existing HLPS. The distribution system will receive the remainder of the flows from the T-main via PRVs. This phase includes improvements to the treated surface water distribution system to service Regions 1, 2, 3 and portions of 4A/5A and 4B/5B. The recommended fire-flow piping improvements are not included in this phase. This phase includes construction of a new HLPS at the WTP to service the new T-main system. It is recommended that the new HLPS structure be designed to accommodate a buildout capacity of 66 mgd (firm). Pumping equipment should be provided to satisfy the next WTP expansion capacity. Additional pumping capacity can be added as the water service area maximum day demands increase. The following improvements are needed prior to the surface water service area maximum day demand exceeding 30 mgd: Completion of YC-10 (42 IN Piping) from WTP to Blevin/Jamie (part of T-main). Completion of R45A-6 (36 IN Piping) from Blevin/Jamie to Butte House/Harter (part of T-main). Installation of TPRV-12 (PRV assembly in vault) near Highway 20 and Harter. Transfer existing distribution system connection to PRV assembly. Installation of TPRV-16 (PRV assembly in vault) near North Ridge and West Onstott Frontage Road. Installation of new HLPS at the WTP to service the new T-main. The addition of the remaining storage tanks, BPS, and T-main/distribution piping (see Appendix A) can be added where water demands are needed. Phase 3 Improvements Includes the remainder of the T-main and distribution system improvements (see Appendix A) needed to deliver treated surface water to the entire SOI under buildout conditions. The storage tanks, BPS, and T-main/distribution piping can be added where water demands are needed due to development. Fire Flow Improvements (Regions 1, 2, and 3) Includes piping improvements needed in Regions 1, 2, and 3 to maintain a minimum system pressure of 20 psi and maximum pipe velocity of 10 FT per second during fire flow conditions. During the development of this TM, we discovered that the May 2004 WMP had an error in the sub-total cost calculation for the fire flow improvements. The sub-total cost shown in Table 25 is slightly less than the 14,982,000 shown in Table 9-4 of the May 2004 WMP.
26 $ # The criteria from the May 2004 WMP were used as the guideline to update the CIP estimated costs. Total facility costs include the baseline construction cost, a contingency, and other costs associated with engineering, administration, and construction management. $ # Construction costs for new facilities are based on engineering judgment, recent bid prices, and historical trends and are not based on detailed engineering design and analysis. Therefore, the construction cost estimates are considered to range from +30 percent to -30 percent of the expected bid price. $ $ For this evaluation, the unit construction cost criteria were adjusted based on: Current Engineering News Record (ENR) construction cost index. Available bid prices from similar projects that recently bid. The May 2004 WMP construction costs reflected an ENR construction cost index for the San Francisco Bay Area of 7,800, which was the index reported for January For the updated cost estimates, ENR s construction cost index for May 2006 will be considered, which is approximately 8,500 for the San Francisco Bay Area. The engineer s estimated construction costs are based on normal construction, recent projects, and engineering decisions. Unusual construction must be addressed individually. Contractor s overhead and profit are included in the costs. Pipelines In the May 2004 WMP, pipeline construction unit costs were estimated from recent bids received by the Yuba City for several water pipeline projects. For this update, a ratio of the ENR construction cost index from 2004 to 2006 was used to estimate cost increases. Table 19 summarizes the pipe construction unit costs used in this evaluation. Estimated unit costs include pipe material, trenching (minimum cover), installation, initial backfill, controlled density backfill, fittings, valves, service connections, average trench restoration fees, pavement restoration, fire hydrants, testing, traffic control, and appurtenances. Unit costs are based on the use of ductile iron piping for diameters less than 18 IN and steel piping for diameters greater than 20 IN.
27 8'! ' Pipe Diameter (Inches) Unit Cost (S/LF) 8 $ $ $ $ $ $ $ $ $460 Bore and Jack Casing Table 20 summarizes the updated estimated unit costs associated with bore and jack pipe installation work. These unit costs include costs for the steel casing, excavation of the jacking and receiving pits, and jacking of carrier pipe. 0?>! ' Storage Casing Size (Inches) Unit Cost ($/LF) 16 $ $ $ $ $510 Jacking Pit $20,000 Receiving Pit $13,500 The updated estimated storage facility unit costs in Table 21 include the tank structure, foundation, appurtenances, yard piping, and architectural treatment. Costs are provided for above ground tanks, constructed of either reinforced concrete or steel. *&>0! ' Capacity (MG) Steel Tank ($/GAL) Concrete Tank ($/GAL) 0.5 $1.25 $ $1.10 $ $1.00 $ $0.85 $ $0.65 $0.85
28 BPS Costs for BPS will vary depending on the features designed into the station such as the number of pumps, standby power, control features, surge protection features, buildings, architectural treatment, etc. In addition, some pumping stations may require modification or upgrade only. Estimated construction costs for BPS are determined on a case-by-case basis. $ $ Since knowledge about site-specific conditions of each proposed project is limited at the master planning stage, a 30 percent contingency will be applied to the baseline construction cost to account for unforeseen events and unknown conditions. # 4 4$ 5 $ A cost equal to 20 percent of construction cost (including contingencies) will be applied to account for additional items such as engineering, administration, construction management, and inspection costs. $ +$, This section summarizes the updates to the Capital Improvement Program for the City s water distribution system. The CIP in the May 2004 WMP included all recommended improvements to the City s water service area, including improvements to the City s WTP. Updating the WTP s CIP was not included in this project s scope of work and will be addressed as part of the WTP expansion project. $ Table 22 to Table 25 summarizes the estimated costs for each phase. Detailed recommended improvements and associated cost estimates for each phase are included in Appendix A. The proposed improvements do not include improvements needed to provide Region 7 with treated surface water. 50 ', $ ' Project Estimated Capital Costs Water Distribution Piping $7,270,000 Storage Reservoirs and BPS $4,260,000 Subtotal $11,530,000 Contingency (30%) $3,460,000 Engineering, Administration, CM (20%) $3,000,000 Phase 1 Total Costs $17,990,000!
29 "50 ', $ ' Project Estimated Capital Costs Water Distribution Piping $29,800,000 Storage Reservoirs and BPS $27,850,000 Subtotal $57,650,000 Contingency (30%) $17,300,000 Engineering, Administration, CM (20%) $14,990,000 Phase 2 Total Costs $89,940,000 5"0 ', $ ' Project Estimated Capital Costs Water Distribution Piping $44,310,000 Storage Reservoirs and BPS $22,960,000 Subtotal $67,270,000 Contingency (30%) $20,180,000 Engineering, Administration, CM (20%) $17,490,000 Phase 3 Total Costs $104,940,000 -%% &', $ ' /# &@@"2 Project Estimated Capital Costs Fire Flow Piping $9,352,000 Subtotal $9,352,000 Contingency (25%) $2,810,000 Engineering, Administration, CM (30%) $2,430,000 Fire Flow Piping Total Costs $14,592,000 "
30 Detailed Cost Estimates Appendix A
31 Appendix A: Updated Capital Improvement Program Costs Summary of Water Distribution System Capital Improvement Program Costs Phase I Distribution Piping 7,600,000 Storage Reservoirs and Pumping Station 4,260,000 Subtotal 11,860,000 Contingency (30%) 3,560,000 Engineering, Administration, CM (20%) 3,080,000 Phase I Total (rounded) 18,500,000 Phase II Distribution Piping 31,840,000 Storage Tanks and Pumping Station 27,850,000 Subtotal 59,690,000 Contingency (30%) 17,910,000 Engineering, Administration, CM (20%) 15,520,000 Phase II Total (rounded) 93,120,000 Phase III Distribution Piping 50,910,000 Storage Tanks and Pumping Station 22,960,000 Subtotal 73,870,000 Contingency (30%) 22,160,000 Engineering, Administration, CM (20%) 19,210,000 Phase III Total (rounded) 115,240,000 Fire Flow Improvements (Regions 1, 2, and 3) Fire Flow Piping 9,352,000 Subtotal 9,352,000 Contingency (30%) 2,810,000 Engineering, Administration, CM (20%) 2,430,000 Fire Flow Improvements Total (rounded) 14,592,000 7/13/2006 Page 1 of 6
32 Appendix A: Updated Capital Improvement Program Costs Storage Tanks and Pumping Station May 2006 Modeling Analysis Reservoirs/Booster Pump Facilities Reservoirs Volume (MG) Pump Station Capacity TDH (mgd) (ft) Total HP PHASE 1 Proposed Burns Reservoir Location Burns Tank Site Comment Tank Unit Cost Storage Cost Pump Station Cost Total Cost Pump capacity increase to 12.5 mgd $0.85 $2,540,000 $1,720,000 $4,260,000 Subtotal $2,540,000 $1,720,000 $4,260,000 PHASE 2 Proposed Franklin Reservoirs Harter and Franklin Tank Two Tanks and pump stations $0.85 $5,080,000 $3,660,000 $8,740,000 Proposed Sanborn Reservoir Sandborn and Lincoln Tank New Facility $0.85 $2,710,000 $1,930,000 $4,640,000 Proposed Lincoln George Washington and Reservoir Lincoln Tank New Facility $0.85 $2,710,000 $1,930,000 $4,640,000 Proposed Jamie Reservoir Blevin and Jaime Tank New Facility $0.85 $2,540,000 $1,720,000 $4,260,000 WTP HLPS - New HLPS Total WTP HLPS firm capacity = 70 mgd. Construct New HLPS (Dedicate as Transmission Ex HLPS firm = 30 mgd to feed T-Main N/A ,572 Pumps) (dedicate to distrib sys) $5,570,000 $5,570,000 Subtotal $13,040,000 $14,810,000 $27,850,000 PHASE 3 WTP - Add DYK Clearwell & New HLPS Pumps (equip only) ,672 Proposed Hooper New HLPS (Add Pumps to feed T- main) Total WTP HLPS firm capacity = 96 mgd. Ex HLPS firm = 30 mgd New HLPS firm = 66 mgd $1.00 $4,010,000 $760,000 $760,000 Reservoir Jamie and Hooper New Facility $0.85 $5,080,000 $1,830,000 $4,450,000 Proposed Lassen Reservoir Harter and Lassen New Facility $0.85 $5,080,000 $1,830,000 $4,450,000 Proposed Royo Reservoir Royo Ranchero and Highway 20 New Facility $0.85 $2,540,000 $1,830,000 $4,450,000 Subtotal $16,710,000 $6,250,000 $14,110,000 Notes: 1. All storage tanks are steel. 2. All puming stations include the cost of a hydropneumatic tank for surge protection. Total $32,290,000 $22,780,000 $46,220,000 7/13/2006 Page 2 of 6
33 Appendix A: Updated Capital Improvement Program Costs Phase 1 Distribution Piping Improvements Diameter (IN) From To Unit Cost ID Existing Proposed Intersection Intersection Length (FT) Comment ($/LF) Total Cost R5-3 New 8 Hooper Coy Roosevelt Coy 800 Not on Drawing $184,000 R5-4 New 10 Highway 20 Hooper North 1,800FT to existing 10IN 1,800 Not on Drawing $486,000 ExYC Sherwood Dr. Windsor Dr. E. Hillcrest Dr. Windsor Dr. 280 Not on Drawing $78,400 ExYC Walton Ave. Bridge St. Tharp Rd. Bridge St. 1,340 Not on Drawing $375,200 R45A-8 New 12 Tharp Hwy 20 Klamath Lane Hwy 20 1,013 Partially Completed 280 $283,600 YC Queen Blevin East to existing 12IN pipe 1,015 Change to replace 8IN pipe 280 $284,200 ExYC-5 New 14 Teegarden Ave. Shasta St. Forbes Ave. Cooper Ave. 2,807 Change to new pipe 290 $814,000 ExYC-4 New 16 Franklin Ave. Hwy 99 Franklin Ave Walton Ave. 2,830 Not on Drawing $877,300 YC New 16 Queen Blevin Butte House Blevin 480 Not on Drawing $148,800 R45A-3 10 & Butte House Madison Butte House (Hooper) 1,446 Partially Completed 310 $448,300 R45B-16 New 16 Harter UPRR Harter Butte House 1,794 Partially Completed 310 $556,100 ExYC-1 New 30 Cooper B Street Lincoln Clark/Bunce 6, $2,625,900 Total 22,338 Total (rounded) $7,160,000 ID Max Flow Rate (mgd) Valve Size (IN) Location Comment Qnty Total Cost Prop TPRV-2 (ex) Frederick and Cooper Existing Conn transferred to PRV 1 LS $220,000 Prop TPRV Lincoln and Bunce Point where 24IN line goes to Burns Tank 1 LS $220,000 Subtotal $440,000 Note: 1. Cost includes package type valve vault, PRV valve units, and isolation valves. Phase 1 Piping Improvements Total Cost $7,600,000 7/13/2006 Page 3 of 6
34 Appendix A: Updated Capital Improvement Program Costs Phase 2 Distribution Piping Improvements Diameter (IN) From To Unit Cost ID Existing Proposed Intersection Intersection Length (FT) Comment ($/LF) Total Cost Ex2-18 New 8 Harding Rd Cherry St Harding Rd Woodleaf Dr 690 Not on Drawing $158,700 Ex Richland Rd Hwy 99 Hunn Rd Arden Ave 1,350 Not on Drawing $310,500 R1-1 6-New 12 Mariposa Jones Teesdale Jones 1,414 Partially Complete 280 $395,900 R1-2 8-Jun 12 Teesdale Railroad Phillips Teesdale 2, $756,000 R45A-13 New 12 Ranchero Butte House Township Butte House 3,361 Changed end of line 280 $941,100 R45B-2 New 12 Lassen Klamath El Margarita Lassen 2, $773,400 Ex1-33 New & 6 14 Richland Rd Glennwood Dr Richland Walton 2,850 Not on Drawing $826,500 Ex Hwy 99 Richland Rd Hwy 99 Hunn 740 Not on Drawing $214,600 Ex2-20 New & 6 14 Lincoln Ave Meadow Ave Lincoln Ave Walton Ave 2,740 Not on Drawing $794,600 R2-2 8-New 14 Cherry Harding Walton Cherry 2, $785,900 R Walton Lincoln Walton Franklin 6,347 Partially Completed 290 $1,840,600 R3-2 8-New 14 Bogue Walton Walton Lincoln 5, $1,525,400 R3-4 6-New 14 Phillips Lincoln Walton Lincoln 3,340 Partially Completed 290 $968,600 R3-5 < 8 14 Phillips Smith Walton Smith 3, $959,900 R45A-1 New 14 Butte House Tierra Buena Jamie Tierra Buena 3, $1,013,000 R1-5 8-Apr 16 Lincoln Phillips Bogue Phillips 5, $1,633,700 R2-6 New (10IN) 16 Littlejohn Franklin Franklin Walton 962 Partially Completed 310 $298,200 R Aug 16 Bridge Hwy 99 Walton Bridge 2, $716,700 R Aug 16 Walton Lincoln Ohleyer Lincoln 2, $908,300 R3-3 6-New 16 Railroad Bogue Sanborn Bogue 8, $2,653,600 R45B-12 New 16 Bogue Sanborn Jordan Sanborn 11,150 Partially Completed 310 $3,456,500 R45B-13 New 16 Harding Franklin Franklin El Margarita 2, $663,400 R45B-14 New 16 Franklin El Margarita Franklin Township 7, $2,318,800 R45A-6 New 36 Blevin Jamie Butte House Harter 6,267 Partially Completed 430 $2,694,800 YC-10 New 42 Blevin Jamie WTP Jamie 8, $3,789,000 Total 98,375 Total (rounded) $31,400,000 ID Max Flow Rate (mgd) Valve Size (IN) Location Comment Qnty Total Cost Prop TPRV-12 (ex) Highway 20 and Harter Existing Connection transferred to PRV 1 LS $220,000 Prop TPRV North Ridge and W. Onstott Frontage Road 1 LS $220,000 Subtotal $440,000 Note: 1. Cost includes package type valve vault, PRV valve units, and isolation valves. Phase 2 Piping Improvements Total Cost $31,840,000 7/13/2006 Page 4 of 6
35 Appendix A: Updated Capital Improvement Program Costs Phase 3 Distribution Piping Improvements Diameter (IN) From To Unit Cost ID Existing Proposed Intersection Intersection Length (FT) Comment ($/LF) Total Cost R2-3 New 30 Lincoln Clark Sanborn Lincoln 8, $3,412,900 R2-4 New 12 Mark Thomas Bridge Harter Bridge 1,714 Partially Completed 280 $479,900 R45A-10 New 12 Tierra Buena Jaime Tierra Buena Pease 2, $812,600 R45A-11 New 16 Hooper Jaime Jaime Blevin 4, $1,360,900 R45A-12 New 16 Hooper Jaime Hooper Butte House 2, $902,400 R45A-2 New 16 Greene Hwy 20 Hwy 20 Township 982 Partially Completed 310 $304,400 R45A-4 New 12 Township Pease Tierra Buena Pease 7, $2,088,800 R45A-9 New 14 Butte House Elmer Elmer Jamie 4, $1,226,700 R45B-1 New 12 Harter Bridge El Margarita Bridge 1, $551,600 R45B-11 New 16 Sanborn Bogue G. Washington Bogue 4, $1,444,600 R45B-14 New 16 Franklin El Margarita Franklin Township 7, $2,343,000 R45B15 New 16 Bogue G. Washington Franklin G. Washington 10, $3,280,100 R45B-17 New 36 Hwy 20 Harter Franklin Harter 5, $2,218,800 R45B-18 New 30 Franklin G. Washington Lincoln G. Washington 5, $2,043,600 R45B-19 New 30 Franklin Harter Franklin G. Washington 4, $1,823,600 R45B-24 New 30 Sanborn Lincoln G. Washington Lincoln 4, $1,759,300 R45B-25 New 12 Redhaven Harter Franklin Harter 3,393 Partially Completed 280 $950,000 R45B-3 New 12 Township Bogue Rd Bogue Rd G. Washington 5, $1,408,400 R45B-4 New 12 G. Washington Franklin Hillview Dr G. Washington 2,802 Partially Completed 280 $784,600 R45B-5 New 12 Bogue Township Pease Township 23, $6,577,200 R45B-6 New 12 Hwy 20 Northward El Margarita Franklin El Margarita 984 Partially Completed 280 $275,500 R45B-8 New 16 Ohleyer Lincoln G. Washington Lincoln 3, $1,026,100 R45B-9 New 16 G. Washington Lincoln Lincoln Township 4, $1,534,500 R6-1A New 12 Tierra Buena Pease Rd Butte Vista Lane Pease Rd 5,228 Partially Completed with 16IN in middle 280 $1,463,800 R6-1B New 12 Dorothy Chandler Pease Rd Hwy 100 Pease Rd 1,810 Partially Completed with 16IN in middle 280 $506,800 R6-2 New 12 Unincorporated 6 16, $4,676,000 YC-6 New 16 Hwy 99 Pease North Ridge Hwy 99 3, $1,219,500 Prop Hooper Tran New 24 Jamie Blevin Jamie Hooper 4,553 See Note $1,730,100 Prop Royo Tran New 24 Harter Highway 20 Royo Ranchero Highway 20 6,434 See Note $2,444,900 PPS-7094 New 16 Prop Royo P/S to North 354 See Note $109,700 PPS-7090 New 16 Prop Hooper P/S To East 131 See Note $40,600 PPS-7091 New 12 Prop Hooper P/S Hooper True Road 397 See Note $111,200 Total 161,196 Total (rounded) $50,910,000 ID Max Flow Rate (mgd) Valve Size (IN) Location Comment Qnty Total Cost Prop TPRV Franklin and George Washington 1 LS $220,000 Subtotal $220,000 Notes: 1. Cost includes package type valve vault, PRV valve units, and isolation valves. 2. Water supply to Proposed Hooper Reservoir and Pump Station from Transmission main. 3. Water supply to Proposed Royo Reservoir and Pump Station from Transmission main. 4. Piping from P/S to new 16IN in Distribution System. 5. Piping from P/S to Distribution System. Phase 3 Piping Improvements Total Cost $51,130,000 7/13/2006 Page 5 of 6
36 Appendix A: Updated Capital Improvement Program Costs Distribution Improvement For Fire Flow Only Recommended Improvements Based on Those Included in the May 2004 Water Master Plan. May 2006 Water Modeling Evaluations did not determine if these improvements have been completed. PROPOSED 8-INCH PIPING IMPROVEMENTS Diameter (inch) From To Length Unit Cost ID Existing Proposed Intersection Intersection (FT) ($/LF) Total Cost Ex Meadow Ave Phillips Rd Meadow Ave Lincoln Rd 1, $430,100 Ex Creswell Dr Phillips Rd Creswell Dr Phillips Dr 1, $448,500 Ex Galaxy Dr Celestial Wy 1070 Celestial Way $64,400 Ex Starlite Ln Jones Rd Starlite Ln Galaxy Dr 1, $310,500 Ex Delone Dr Jones Rd Delone Dr loop 1, $345,000 Ex Delone Dr Starlite Ln Starlite Jones Rd $112,700 Ex Geneva Ave Delone Dr Geneva Ave Starlite Ln $225,400 Pipe intersection Del Lago Neptune Teesdale Ex Del Lago Dr Neptune Dr Pacifica Dr 1, $303,600 Ex Jeffrey Dr Albatross Ave Jeffrey Dr Teesdale Rd $179,400 Ex Canterbury Dr Ari Ct 1934 Jeffrey Dr $96,600 Ex Jonathan Dr Lincoln Rd Brian Dr/Jonathan Dr $105,800 Ex Elliot Dr Cherry St. Elliott Dr Anita Wy 1, $319,700 Ex Walton Ave Camino Del FloresCamino Del Flore Camino Del Oro 1, $299,000 Ex Hunn Rd Arden Ave Arden Ave Vernon Ave 2, $506,000 Vernon Ave Littlejohn Rd Ex Littlejohn Rd Bancroft Ave Bancroft Ave Arden Ave $186,300 Ex Richland Rd Camino Cortez Camino Cortez Hunn Rd 1, $363,400 Ex Littlejohn Rd Hunn Rd Littlejohn Rd Richland Rd 1, $356,500 Ex pipe 516 Parkview 485 Parkview Ave $149,500 Ex Manzanita Wy Evergreen Wy Cedar Wy Holly Tree Dr 6 pipe 411 Evergreen Wy 1, $338,100 Ex Camino Del Oro Pipe $57,500 Ex Walton Ave Mesa Verde Lincoln Rd Mesa Verde 1, $358,800 Ex Tanglewood Dr Lincoln Rd 773 Estates Dr 1, $312,800 Curlotta Wy Ex Kathleen Wy S. Barrett Rd Meadow Ave S. Barrett Rd 1, $312,800 Ex Teesdale Rd Jones Rd Starlite Ln Jones Rd 1, $262,200 Ex Del Lago Ct FH Del Lago South end of Del Lago $43,700 Ex Hunn Dr La Ramada 462 La Ramada $108,100 Total for 8-inch Piping 28,680 $6,596,400 PROPOSED 12-INCH PIPING IMPROVEMENTS Diameter (inch) From To Length Unit Cost ID Existing Proposed Intersection Intersection (FT) ($/LF) Total Cost Ex Walton Ave Camino Del Florez Walton Holley Tree Dr $148,400 Ex Camino Del Florez Walton Camino Del Flore Pelican Place 1, $341,600 Ex Marlin Ct Fire Hyrant (FH) Marlin Pacifica Dr $89,600 Ex Dolphin Ct FH Dolphin Columbia Dr $86,800 Ex Waverly Ct FH Waverly Jeffrey Dr $53,200 Ex Cambridge Ct FH Cambridge Jeffrey $53,200 Ex Ari Ct FH Ari Lois Lane $72,800 Ex Baron Ct FH Baron Ct Lois Lane $72,800 Ex Mayette Ct FH Mayette Franquette Dr $106,400 Ex Claro Ct FH Claro Franquette Dr $106,400 Ex Cecily Ct FH Cecily Franquette Dr $106,400 Ex Tara Ct FH Tara Jeffrey Dr $47,600 Ex Jill Ct FH Jill Jeffrey Dr $47,600 Ex Tessdale Ct FH Teesdale Teesdale Rd $145,600 Ex Randolph Dr FH Randolph Dr Phillips Rd $246,400 Ex Reo Dr FH Reo Dr Randolph $103,600 Ex Ronald Dr FH Ronald Meadow Ave $50,400 Ex Barbara Wy FH Barbara Meadow Ave $67,200 Ex Lot on corner Lincoln Rd S. Barrett Rd $176,400 Ex & 8 12 Lincoln Rd Hwy 99 Lincoln Rd Karen Dr $207,200 Ex Westwood Dr FH Westwood Dr Richland Rd $50,400 Ex Bay Ct Pebble Beach Dr Bay Ct $182,000 Ex Donald Ct Germaine Dr Donald Ct $70,000 Ex Thomas Ct Thomas Dr Thomas Ct $36,400 Ex Chelsea Pl Edwin Dr Chelsea Pl $86,800 Total for 12-inch Piping 9,840 $2,755,200 TOTAL FIRE FLOW IMPROVEMENTS (rounded) $9,351,600 7/13/2006 Page 6 of 6
37 Calibration Data: Pump and Reservoir Information Appendix B
38 APPENDIX B City of Yuba City Hydraulic Model Fire Flow Tests for Calibration Pump and Reservoir Information Pumps On/Off Test 1 Test 2 Test 3 Test 4 Test 5 Test 6 Test 7 Test 8 HLPS 10 x x x x x x x x x x x x x x x x Harter x x x x x x x x Burns 1 x x x x x x x x Rowe Sam B /30/2006 Page 1 of 4
39 APPENDIX B City of Yuba City Hydraulic Model Fire Flow Tests for Calibration Pump and Reservoir Information Pump Flows Test 1 Test 2 Test 3 Test 4 Test 5 Test 6 Test 7 Test 8 HLPS ,337 Average Flow Harter Average Flow Burns ,271 Average Flow Rowe Sam B Sum ,526 Average Flow Fire Flow Base Dmd /30/2006 Page 2 of 4
40 APPENDIX B City of Yuba City Hydraulic Model Fire Flow Tests for Calibration Pump and Reservoir Information Pump Pressures Test 1 Test 2 Test 3 Test 4 Test 5 Test 6 Test 7 Test 8 HLPS Average Pressure Harter Average Pressure Burns Rowe Average Pressure Sam B Average Pressure /30/2006 Page 3 of 4
41 APPENDIX B City of Yuba City Hydraulic Model Fire Flow Tests for Calibration Pump and Reservoir Information Clearwell Elevation Test 1 Test 2 Test 3 Test 4 Test 5 Test 6 Test 7 Test 8 HLPS Average Level Harter Average Level Burns Average Level Rowe Average Level Sam B Average Level /30/2006 Page 4 of 4
42 Calibration Data: Static and Residual Pressures and Hydrant Flows Appendix C
43 APPENDIX C City of Yuba City Hydraulic Modeling Results of Calibration * Sources in this analysis are fixed grade reservoirs and Pressure Reducing Valves (Pumps are not operating) Residual Node Flowing Node Static Pressure (PSI) Residual Pressure (PSI) Differences Test No. Location Node Flow (gpm) Node Field Model Difference Field Model Difference Field Model Difference 1 Brandywine Dr J-635 1,120 J (4.20) 2 Century Park Dr J-159 1,160 J (0.80) 3 Utah Ct J-690 1,130 J Sombra Ct J-14 1,120 J (0.51) (5.29) Chloe Ct J-805 1,150 J Messina Ct J-946 1,050 J Kira Ct J-96a 1,030 J (1.42) Josephine Dr J-884 1,060 J (0.45) (2.50) Average Difference Pumping Rates Test No. Location HLPS 10 Harter 2 Burns 1 Total Field Model Difference Field Model Difference Field Model Difference Field Model Difference Static 5,337 4,917 (420) (236) 1,271 1, ,526 7,526-1 Brandywine Dr 4,188 3,783 (405) (239) 1,258 1, ,370 6,370-2 Century Park Dr 5,972 5,567 (405) (206) 1,369 1, ,265 8,265-3 Utah Ct 5,105 4,543 (562) (250) 1,141 1, ,166 7,166-4 Sombra Ct 5,938 5,373 (565) (187) 1,175 1, ,008 8,008-5 Chloe Ct 5,105 4,727 (378) (236) 1,300 1, ,325 7,325-6 Messina Ct 3,875 3,440 (435) (243) 1,218 1, ,003 6,003-7 Kira Ct 6,355 5,729 (626) (101) 1,328 2, ,588 8,588-8 Josephine Dr 6,155 5,677 (478) (176) 1,379 2, ,479 8,479 - Average Difference (474.89) (208.22) NOTE: * Colors relate to the relative locations of the sites. Sites with the same color are faily close together. 7/14/2006 Page 1 of 1
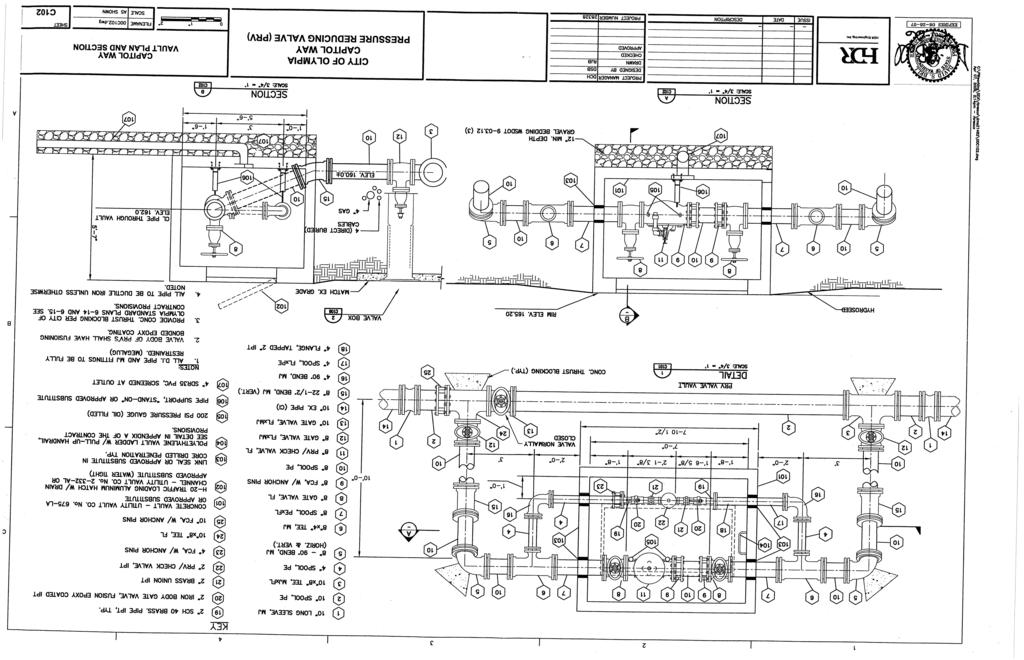
44 Examples of Typical PRV Stations Appendix D
45

46
47
48