Groundwater Resource Management: Or How I Learned to Stop Worrying and Love Drinking Recycled Sewage
|
|
|
- Bennett Long
- 5 years ago
- Views:
Transcription

1 Groundwater Resource Management: Or How I Learned to Stop Worrying and Love Drinking Recycled Sewage Jason S. Dadakis 99 Orange County Water District Engineering Sciences 42 Thayer School of Engineering Dartmouth College April 2, 2015


 and")
2 Who is this guy? Class of 1999 EARS Major Environmental Consulting M.S. Hydrology & Water Resources 10+ years Registered Professional Geologist (P.G.) and Certified Hydrogeologist (C.HG) in CA
3 Outline Hanover drinking water and sewage California Drought & GW Management Drinking Recycled Sewage (a.k.a. potable reuse) Closing thoughts Questions
4 How does Hanover provide potable water?

5 Reservoirs in protected watersheds Fletcher Reservoir Hanover Center Reservoir Parker Reservoir
 4. Disinfection via Sodium Hypochlorite 5. Fluoride addition www.konchewater.")
6 Engineered Treatment 1. Poly aluminum chloride addition (coagulant) 2. Microfiltration 3. Sodium Bicarbonate addition (ph) 4. Disinfection via Sodium Hypochlorite 5. Fluoride addition
7 How does Hanover manage its sewage?

8

9
10
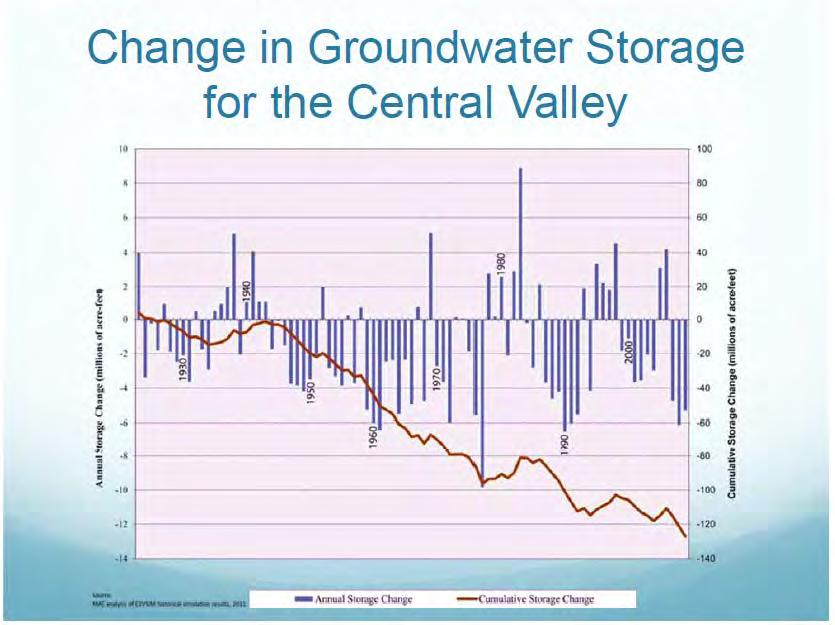
11 CA Drought & Groundwater Management

12 Focus today on the supply side


13 The Acre-Foot Western USA water unit of measure 325,900 gallons 1,234 cubic meters Covers a football field by 1 foot Supplies 2 families for a year 13


14 93% Severe or Higher in California Published March 24th

 Colorado River Aqueduct")
15 Southern California: Historically Dependent on Imported Water Supplies LA Aqueduct (Los Angeles) State Water Project (MWD) Colorado River Aqueduct (MWD)

16 Courtesy of Metropolitan Water District of Southern California


17 Las Vegas Lake Powell Lake Mead Courtesy of Metropolitan Water District of Southern California
18 Northern California Conditions LA Aqueduct (Los Angeles) State Water Project (MWD) Colorado River Aqueduct (MWD)
19 As of 3/22/15, courtesy of Metropolitan Water District of Southern California
20 Northern California Conditions LA Aqueduct (Los Angeles) State Water Project (MWD) Colorado River Aqueduct (MWD)

21 (Northern CA) As of 3/22/15, courtesy of Metropolitan Water District of Southern California
 90 Wettest 80 70 88")


22 8 Station Index Precipitation (Northern CA) 90 Wettest in 60 Precipitation (in) in Normal Hydrology Last Year Driest 48 in 31 in 17 in 0 Oct Nov Dec Jan Feb Mar Apr May Jun Jul Aug Sep
23 As of 3/22/15, courtesy of Metropolitan Water District of Southern California

24 January 2013


25 January 2014

26 January 2015

27 MWD Storage Reserve Levels 4 Emergency Storage Dry-Year Storage Million Acre-Feet *Estimated end-of year actual storage balances, subject to change, courtesy of MWD

 Green")
28 Lake Oroville (Northern CA) Green Bridge

")
29 Lake Oroville (Northern CA) Bidwell Marina

30 Lake Oroville Enterprise Bridge

31


32 April 1 st : Governor s Executive Order Mandatory 25% water use reduction across state Lawn replacement program Landscape irrigation restrictions Streamlined water project review and permitting

33 Famiglietti and Rodell, 2013 NASA/JPL-Caltech/University of California, Irvine Groundwater not looking much better in places

34

35 Groundwater provides 30 percent of the state s water supply. 431 groundwater basins Cover 40% of state Storage capacity: 1,050 billion m 3 Surface Storage: 120 billion m 3

36 Sustainable Groundwater Management Act of 2014 Mandates basin operations within sustainable yield to avoid undesirable results Chronic groundwater depletion (WL declines) Land subsidence Seawater Intrusion Other quality degradation Surface water depletion Requires local agencies to formally implement according to timeline Does not determine or alter water rights Does not require metering

37 State: will provide some funding, but will intervene if locals don t get on board
38 Sustainable groundwater management is challenging! Groundwater basins are complex, difficult to characterize Dynamic, multi-scale, frequently non-linear systems Bredehoeft, J.D The Water Budget Myth Revisited: Why Hydrogeologists Model. Groundwater, 40 no. 4:
39 Case Study: Orange County Water District


40 Orange County Water District (OCWD) Formed in 1933 by state (at request of locals) to manage local groundwater basin


41 OCWD manages groundwater basin at base of Santa Ana River Watershed OCWD covers ~350 sq. mi Groundwater basin provides water for over 2.4 million people Semi-Arid region: precipitation avg. 14 in/yr

42 Primary OCWD Functions

43 Over 2000 ft of unconsolidated sediments from marine and alluvial deposition, comprise the basin aquifers. The basin contains approximately 66 million acre-ft of groundwater, but only ~500,000 acre-ft can be utilized (<1%).


44 Operational Recharge Facilities Santa Ana River (SAR) Facilities capture river water for groundwater recharge OCWD maintains water rights to the SAR downstream of Prado Dam Prado Dam is an ACOE flood control structure also operated for water conservation

45 Seawater Intrusion Desired Seawater Holding Point Injection Wells Injection Well Production Wells Sea Level Intrusion Barrier

46 Underlying principles for basin management Committed to increasing supply, not limiting demand Rejection of centralized control over consumption Rejection of legal adjudication Willing to set aside individual rights Did not want a Philosophy of Scarcity Common pool approach for all well owners Equal access to basin for all within it All users pay proportional to their use Incentivize expanding GW supply for all Better for overlying land values Use economic incentives to control pumping All pumping must be metered and reported
 Basin equity assessment (BEA) All three established annually by elected OCWD Board of")
47 OCWD uses economic incentives to manage pumping Basin production percentage (BPP) Replenishment assessment (RA) Basin equity assessment (BEA) All three established annually by elected OCWD Board of Directors
 5,000 Pay")
48 Example water utility with 20,00 acre-ft annual water demands 20,000 $1,000 15,000 BPP 75% Acre-ft/yr 10,000 $300 Pay RA & BEA (equal to treated Imported water cost) 5,000 Pay RA 0
49 The BPP has ranged from 62 to 89 percent and may be lowered to 70 percent in % Basin Production Percentage 90% 89% 80% 70% 60% 70% 70% 80% 70% 70% 65% 65% 62% 70% 70% 70% 70% 70% 74% 80% 75% 75% 75% 75% 75% 75% 69% 66% 64% 80% 72% 70% 70% 69% 68% 65% 62% 62% 50% 40% Fiscal Year Ending
50 RA funds OCWD, including the purchase of replenishment water for recharge $1,200 $1,000 Replenishment Assessment Cost per Acre Foot $800 $600 $400 $200 $ Treated Imported Water
51 Basin storage provides insurance during times of drought ,000 Full Basin Operating Range Acre-feet Below Full -200, , , , ,000 Dry periods -700,
52 Basin storage must be managed within limits or risk adverse impacts. Acre-Feet 0-100,000 FULL Available storage for one wet year Negative Impacts Shallow groundwater Allows for 2-4 consecutive dry years, including 66,000 af Conjunctive Use Storage - 500, ,000 Short-term Emergency Storage Reduced Pumping Capacity Sea water intrusion Subsidence
53 OCWD has basin management triggers tied to basin storage conditions. Basin Storage Conditions (acre-feet below full) Basin Management Actions to Consider Less than 100,000 af Raise BPP 100,000 to 300,000 af Maintain and/or raise BPP 300,000 to 350,000 af Greater than 350,000 af Seek additional supplies to refill the basin and/or lower the BPP Seek additional supplies to refill the basin and lower the BPP
54 BPP determination is essentially a water budget forecast tural Incidental Recharge + Captured SAR Base Flow Storm Water Recharge + Captured SAR Storm Flow Recharge + Imported Water Recharge + Recycled Water Recharge (e.g., GWRS) +/- Targeted Change in Storage = BPP Total Water Demands BEA penalty incentives well owners not to pump >BPP Satisfy remaining demand via treated imported water


55 Typical Water Supplies to Recharge OC Basin = 345,000 af Imported Water 65,000 55

56 FY13-14 Actual Recharge OC Basin = 227,600 af Imported Water 53,000 56
57 FY15-16 Estimated Groundwater Water Budget Recharge Source SAR Baseflow 65,000 SAR Stormflows 40,000 Incidental Recharge 50,000 GWRS 103,000 Purchased Imported Water 65,000 Other 2,000 Total Water Into Basin 325,000 Average Hydrology (afy) Expected 70% BPP 322,000 Projected Storage Gain/Loss 3,000
58 Rainfall has been below average in 8 of the last 10 years Driest period on record ( ) Total Annual Rainfall (inches) Avg. 14 inches Fiscal Year (July-June)
59 Incidental Recharge vs. Local Rainfall: Annual Incidental Recharge (Acre-feet) 160, ,000 80,000 Avg. 40,000 IR = 4,422 X FHQ Rain + 2,047 R 2 = Annual data based on July - June water year Annual Rainfall at OCWD Field Headquarters (Inches)
60 Santa Ana River base flow has declined by more than 50 percent over the last 9 years. 180,000 SAR Base Flow (acre-feet) 160, , , ,000 80,000 60,000 40,000 20,000 58% Decline Fiscal Year (July-June)
 200,000 180,000 160,000 140,000 120,000")
61 SAR base flow is primarily due to wastewater discharges. 11 Major WWTP s Discharge to SAR reaching Prado Total Discharge (af) 200, , , , , ,000 80,000 60,000 40,000 20, % Decline Calendar Year

62 Imported water supplies likely to be allocated starting in July % cut likely Emergency Storage Purchases for recharge may face additional reduction Dry-Year Storage Million Acre-Feet *Estimated end-of year actual storage balances, subject to change, courtesy of MWD
63 San Bernardino Rainfall vs. Recharged Storm Flow: Annual SAR Storm Flow Recharged (AF) 120, ,000 80,000 60,000 40,000 20,000 Storm Flow Recharged = 2,723 X SB Rain + 9,685 R 2 = Average Annual data based on July - June water year Annual San Bernardino Rainfall (Inches)
64 Recycled water is projected to provide 30 percent of recharge by , , , , , , , , ,000 50, Annual Recharge (afy) GWRS Imported Water Storm Flow Recharge Recharged Base Flow tural Recharge Avg. 326,000 afy Est. Fiscal Year (ending June 30)
 of the water budget?")
65 Question for students! How should OCWD manage the uncertainty when forecasting the individual components (parameters) of the water budget? How should OCWD manage the cumulative uncertainty when setting the BPP for the coming year?
66 Potable Reuse


67 Water Reuse = Recycled Water Focus on municipal wastewater (i.e., sewage) today 36 billion gallons discharged to environment every day <5% is intentionally reused 4 states account for 90% of reuse in USA Arizona California Florida Texas Primary driver is water scarcity, though increasingly cost-competitive
")

68 Non-potable vs. Potable Reuse Non-potable reuse Irrigation (agricultural and landscape) Industrial (e.g., boiler feed, cooling water) Commercial (e.g., laundry) Indoor (toilet flushing) Environmental enhancement Potable reuse Groundwater recharge Reservoir augmentation Direct Potable Reuse

69 Why Potable Reuse? Avoids cost of new infrastructure for a second distribution network Enables full utilization of recycled water (less seasonal demand limitation) Because we have the technology to do it safely and reliably
70 De facto (unplanned) potable reuse has been occurring for a long time River


71 San Diego Example CA-SWP Colorado River


72 Scale of de facto reuse in the U.S. Fraction of Population Surveyed 1980 assessment of the water supplies for 76 million Americans 100% 10% 1% 0% Data from Swain % > 5% 33% Wastewater discharges upstream 2013 ASU update - 25 sites with the highest wastewater content Number of Sites Avg. Flow: 1980 vs Avg. Flow Low Flow > 5% 17 Wastewater discharges upstream Flow at point of withdrawal Data from Rice et al. 2013

73 Planned Potable Reuse is also increasing in the USA. Capacity, mgd
74 Major Planned Potable Reuse Projects in operation USA Upper Occoquan, VA Morrow, GA Gwinette Co., GA Big Spring, TX Wichita Falls, TX LACSD, Southern CA West Basin, Southern CA GWRS, Southern CA International Windhoek, mibia Singapore Western Corridor, Australia Perth, Australia Torreele, Belguim
 advanced water purification facility Takes treated sewer water that otherwise would be wasted to the ocean and purifies it to near-distilled quality Provides a")
75 What Is The Groundwater Replenishment System (GWRS)? 70-MGD (265,000 m 3 /day or 265 MLD) advanced water purification facility Takes treated sewer water that otherwise would be wasted to the ocean and purifies it to near-distilled quality Provides a new 72,000 acrefeet (89 million m 3 /year) per year source of water, which is enough water for nearly 600,000 people Operational since January 2008


76 Project is a Partnership Source Control OCSD OCWD Sewage Primary Treatment Secondary Treatment Advanced Water Purification Reuse
")


77 GWRS Advanced Purification Processes OCSD Secondary Effluent Microfiltration (MF) Reverse Osmosis (RO) Ultraviolet Light (UV) with Hydrogen Peroxide Seawater Barrier Normally Goes to Ocean Backwash Sent to OCSD Brine Sent in OCSD Outfall Recharge Basins in Anaheim


78 Microfiltration (MF) process Siemens CMF-S Microfiltration System Hollow fiber polypropylene membranes Removes bacteria, protozoa, and suspended solids 0.2 μm pore size In basin submersible system
79 Membrane Processes Cl -1 Bacteria > 0.1 μm Virus > 0.01 μm Mg 2+ 8 x 10-4 μm x 10-4 μm Cl 1-3 x 10⁻⁴ μm Microfiltration (MF) Cl - 1 Cl - 1 Cl - 1 Cl - 1 Cl - 1 Cl - 1 Pore size: μm
80 Membrane Processes Cl -1 Bacteria > 0.1 μm Virus > 0.01 μm Mg 2+ 8 x 10-4 μm x 10-4 μm Cl 1-3 x 10⁻⁴ μm Microfiltration (MF) Ultrafiltration (UF) Cl - 1 Cl - 1 Cl - 1 Cl - 1 Cl - 1 Cl - 1 Cl - 1 Cl Cl - Pore size: μm μm
81 Membrane Processes Cl -1 Bacteria > 0.1 μm Virus > 0.01 μm Mg 2+ 8 x 10-4 μm x 10-4 μm Cl 1-3 x 10⁻⁴ μm Microfiltration (MF) Ultrafiltration (UF) nofiltration (NF) Cl - 1 Cl - 1 Cl - 1 Cl - 1 Cl - 1 Cl - 1 Cl - 1 Cl - 1 Cl - 1 Cl - 1 Cl - 1 Cl - 1 Pore size: μm μm μm
82 Membrane Processes Cl -1 Bacteria > 0.1 μm Virus > 0.01 μm Mg 2+ 8 x 10-4 μm x 10-4 μm Cl 1-3 x 10⁻⁴ μm Microfiltration (MF) Ultrafiltration (UF) nofiltration (NF) Reverse osmosis (RO) Cl - 1 Cl - 1 Cl - 1 Cl - 1 Cl - 1 Cl - 1 Cl - 1 Cl - 1 Cl - 1 Cl - 1 Cl - 1 Cl - 1 Pore size: μm μm μm Non-porous

83 Reverse Osmosis (RO) process Uses thin film composite polyamide (TFC-PA) membranes Recovery Rate: 85% Removes dissolved minerals, viruses, and organic compounds Pressure range: psi


84 Ultraviolet/Advanced Oxidation System Trojan UVPhox System Low Pressure High Output lamp system Uses hydrogen peroxide to form an advanced oxidation process Disinfection Destroys trace organic After treatment, water is so pure that minerals are added
85 GWRS Water Quality CA Division of Drinking Water (DDW) developed permit requirements Test for over 400 compounds with all results well below permit levels or at non-detection (ND) levels 28 Volatile Organic Compounds All ND 39 Non-Volatile Synthetic Organic Compounds All ND 8 Disinfection By-Products All ND 10 Unregulated Chemicals All but one ND, all below permit levels 51 Priority Pollutants All ND 16 Endocrine Disrupting Chemicals and Pharmaceuticals All ND Superior to other available sources of basin recharge

86 Energy Consumption 3.5 4, Typical Energy Intensity by Water Source For Southern California water utility 4,000 3,500 3,000 kwh/m ,500 2, ,500 1, Recycled Water Groundwater Brackish Groundwater Desal OCWD GW Replenishment Project Colorado River Aqueduct State Water Project Seawater Desal kwh/af Source: Pacific Institute analysis regarding SDCWA data

87 GWRS Project Funding $481 Million Capital Cost 72,000 acre-feet per year capacity OCSD Contribution, $196,000,000 OCWD, $196,000,000 State Grants, $69,000,000 Federal Grant, $20,000,000 Unit cost is ~$475/AF with subsidies and ~$800/AF without subsidies.


88 Benefits of GWRS Creates a new local water supply Reuses a wasted resource Expands the seawater barrier Increases water supply reliability Costs less than water from the Colorado River and the State Water Project Uses one-half the energy it takes to import water and one-third the energy to desalinate seawater Improves quality of water in the basin


89 Public Outreach Many projects stopped by public and political opposition Outreach began early, more than 10 years prior to start-up Researched public concerns Face-to-face presentations Community leaders Measured effects of outreach Community support Outreach continues today, assisted by media interest No active opposition

90 GWRS INITIAL EXPANSION Success led to GWRS Initial Expansion $142 Million (US Dollars) Creates additional 31,000 afy of new local water, enough to serve 250,000 people Complete in May 2015 Inspired other global projects Potential is great 1.3 billion gallons of treated wastewater is discharged into the Pacific Ocean every day
91 Future trends More direct reuse applications More large-scale reuse interested Alternatives to RO for potable reuse Limits on environmental discharge Increased treatment requirements on environmental discharge Decentralized reuse systems Seawater Desalination
 Planners (water resource, environmental) Public Health professionals (doctors, toxicologists) Technicians (water treatment, water distribution) Communications professionals")
92 High demand for smart, agile, multi-disciplinary people in water industry Scientists (geologists, hydrologists, chemists, biologists, geographers, environmental) Engineers (civil, environmental, mechanical, electrical) Planners (water resource, environmental) Public Health professionals (doctors, toxicologists) Technicians (water treatment, water distribution) Communications professionals Lawyers (contracts, water rights) Accountants (budgets, purchasing) Elected representatives

93 Questions?