Cooperative Coastal Monitoring Program
|
|
|
- Lenard Domenic Townsend
- 5 years ago
- Views:
Transcription
1 New Jersey Department of Environmental Protection Division of Watershed Management Office of Watershed Education, Estuaries & Monitoring Cooperative Coastal Monitoring Program Presented by: Virginia Loftin NJ Water Monitoring Council Meeting, January 31, 2007
2 NJ Department of Environmental Protection NJ Department of Health and Senior Services County Health Departments Cooperative Program Between: Monmouth County HD Ocean County HD Atlantic County HD Cape May County HD Middlesex County HD Local Health Departments Middletown HD Northeast Monmouth Regional Health Commission Long Branch HD Long Beach Township HD Atlantic City HD
3 Cooperative Coastal Monitoring Program Program began in 1974 Program revised and State Sanitary Code adopted in 1986 Responded to public health concerns Provided data required for general and site-specific water quality analyses Activities include: Weekly monitoring of bathing beaches for enterococcus bacteria Aerial surveillance of coast Regular inspections at coastal sewage treatment plants Public notification of beach conditions Complimentary Programs: Clean Shores Program, Adopt A Beach Program

4 186 Ocean stations Most ocean monitoring stations are associated with potential pollution sources 139 Bay Stations All bay beaches are monitored

5 County and local health departments collect and analyze approximately 5700 water quality samples each summer season Beach closings are mandatory for sewage overflows and other pollution events with potential to affect public health Monitoring conducted after all pollution events

6 Current testing method: EPA Method 1600: Enterococci in water by membrane filtration results in 24 hours Future methods? qpcr quantitative polymerase chain reaction results in 2 hours Predictive modeling

7 EPA Beaches Environmental Assessment and Coastal Health (BEACH) Act based on New Jersey s Cooperative Coastal Monitoring Program Provides grant $ for monitoring water quality and public notification of beach conditions October 10, 2000


8 Standard is 104 enterococci bacteria per 100 ml of sample Monitoring begins in mid-may and runs through early September. Samples are collected weekly on Mondays.

9 Sources of bacteria include: Stormwater outfalls on beach

10

11
12

13 Stream discharge to ocean


14 Coastal Lake Discharges Deal Lake, Loch Arbour Sylvan Lake, Avon
 Wreck Pond,")
15 Monmouth County Health Department Rain Provisional Policy (2002) Wreck Pond, Spring Lake
16 and unusual events
17 Coastal Sewage Treatment Plant Inspections DEP inspects 17 coastal STPs and monitors discharges to coastal waters
18 Ocean Beach Closings Ocean Beach Closings Number of Closings Rainfall policy implemented For Bacteria in Excess of Standard Precautionary Floatables
19 Bay Beach Closings Bay Beach Closings Number of Closings Rainfall policy implemented for bacteria in excess of standard precautionary
20 Aerial Surveillance

21 DEP Flight Crew


22 EPA Water Ditching and Survival Training


23

24

25


26 What we re looking for Middlesex County Utilities Authority Raritan Bay outfall ~ mgd


27
28
29 What we usually see
30
31

32 Web-Based Reporting Introduced in Summer 2004 Completely paperless system PDAs distributed to all county field samplers Field data is downloaded at lab at time of sample drop-off
33 Web-Based Reporting Lab managers enter sample results directly on to web page System recommends action for agency officials (e.g. closures) Posting determinations are immediately available on NJDEP and Earth 911 websites Citizens, lifeguards, media, resorts, other stakeholders receive immediate alerts of closures/advisories via opt-in Results are immediately available for EPA BEACH Data Flow.
34 Web-Based Reporting State-of-the-art technology reduces workload and streamlines data management at all levels of government Government-to-Government and Government-to-Public information exchange through one seamless network

35 SAND

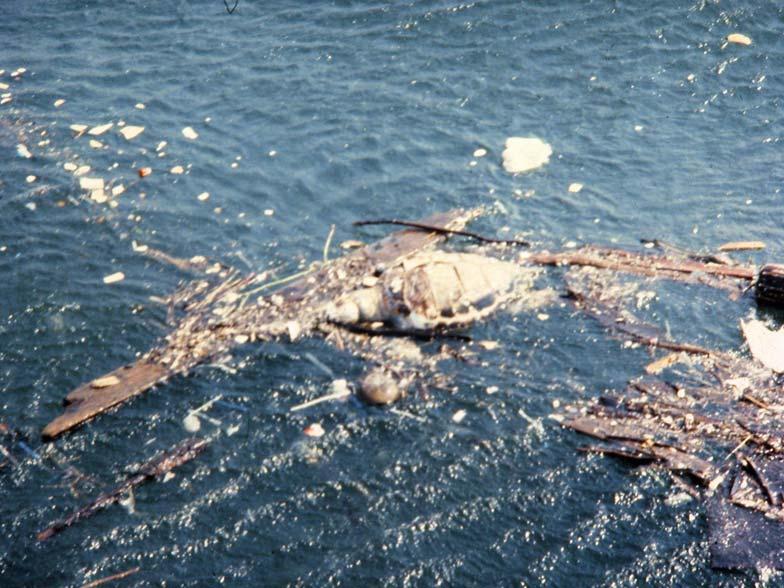
36

37
38 1-877-WARN DEP CCMP staff on call 24/7 from early May through late September for all pollution events and reports in tidal waters


39 DEP staff respond to pollution reports


40

41

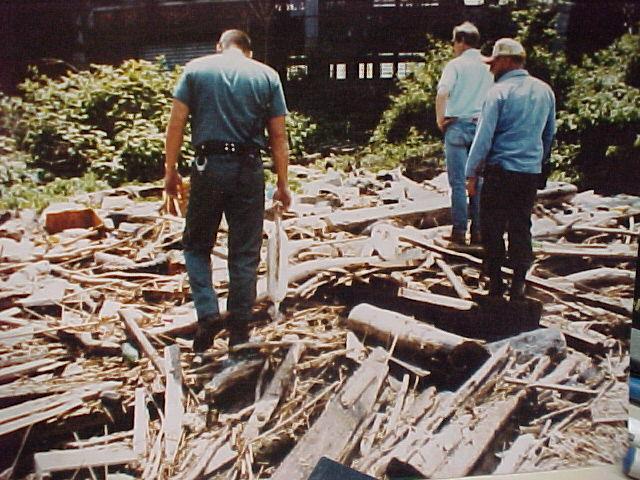
42
43 Clean Shores. Project was initiated in 1989 in response to medical waste and garbage related beach closings in Project was initiated in 1989 in response to medical waste and garbage related beach closings in Cooperative effort between: Cooperative NJDEP effort between the NJDEP Department Department of Corrections of Corrections and Local Governments Local Governments


44 Sources of Floatable Debris
45
46 16th Street Park City of Bayonne 1991


47 City of Elizabeth Before After


48

 6 stories high The ocean shoreline of NJ 15 times")
49 From 1989 to 2006: Over 115 million pounds of floatables removed miles of shoreline cleaned and re-cleaned. Equivalent to: The area of a football field (including end zones) 6 stories high The ocean shoreline of NJ 15 times over


50 Disposal Tree parts and beverage containers are recycled. Lumber and garbage is landfilled.
51 Miles and pounds 1989 to 2006 miles cleaned pounds (millions) Miles cleaned Pounds (millions


52 US Army Corp of Engineers


53 Adopt A Beach 2 beach cleanups each year ~ 1000 volunteers/cleanup

54 Adopt A Beach 2006 Debris Source Data

55 Funding Sources Up to $200K from the sale of the Shore Protection License Plate ~ 280K each year from annual EPA BEACH grants 90% is passed through to counties
56 GOAL Cooperative Coastal Monitoring Clean Shores and Adopt A Beach:

57 Clean and healthy beaches!

58 New Jersey Department of Environmental Protection Division of Watershed Management Office of Watershed Education, Estuaries & Monitoring SAND Virginia Loftin