Dealing with Climate Variability and Climate Change. Bernadette Sloyan (CSIRO), Alex Sen Gupta (UNSW), and Matthew England (UNSW)
|
|
|
- Blaze Stone
- 5 years ago
- Views:
Transcription
1 Dealing with Climate Variability and Climate Change Bernadette Sloyan (CSIRO), Alex Sen Gupta (UNSW), and Matthew England (UNSW)
2 Dealing with Climate Variability and Climate Change Seven key areas were identified that underpin understanding of this Theme as identified in the Marine Nation 2025 document. With input from over 100 Australian Climate Scientists Pacific and Indian Tropical Oceans Angus Santos (UNSW) Polar and mid-latitude oceans Australian coastal and shelf oceans Andy Hogg (ANU) Peter Oke (CSIRO) Paleoclimate Ocean biogeochemical cycles Sea level and ocean heat and freshwater content Marine Extremes Katrin Meissner (UNSW) Bronte Tilbrook (CSIRO) John Church (CSIRO) Kathleen McInnes (CSIRO) and Ron Cox (UNSW)
 where large-scale land subsidence causes a rate of rise relative to the land which is substantially higher.")
3 : Impacts Global Mean Sea Level increased by 210mm between 1880 and 2009, and is continuing to rise at a fairly steady rate of just over 3mm/year. This rate of rise is undoubtedly contributing to the flooding problems of low-lying island states like Tuvalu, Kiribati and the Maldives. This is exacerbated in some areas (e.g. Gippsland, Victoria ) where large-scale land subsidence causes a rate of rise relative to the land which is substantially higher.


4 : Impacts Recent estimates by the Climate Council are that almost 250,000 homes around Australia worth about $72 billion are vulnerable to a 1.1 metre rise in sea levels. Key infrastructure - road, rail, ports, airports, water and wastewater services, energy and communications- public assets and commercial assets swell the national sum that is at risk to about $226 billion.

5 : Impacts Vulnerabilities due to multiple stresses Sea-level rise Warming Acidification Hypoxia Stratification Storm Surges source: IPCC WGII 2014

6 : Impacts Australia s aquaculture and fisheries industry, worth about $2.23B and tourism industry (Great Barrier Reef generates $6B) both of which rely on a healthy, productive marine environments. D. Higher sea level modifies coastlines with increase risk of flooding and impact marine aquaculture industries H. Temperaturedriven shifts in stock of large pelagic fish 8. Ocean acidification reduces biological calcification and alters plankton communities 9. Mass Coral bleaching, decline in growth rate and loss of marine biodiversity G. Degradation of coral reefs and associated fish stocks


7 : Impacts The Great Barrier Reef has experienced bleaching events in 1980, 1982, 1992, 1994, 1998, 2002, and Widespread and intense events occurred in the summers of 1998 and 2002, with 42% and 54% respectively of reefs bleached to some extent, and 18% strongly bleached. The Great Barrier Reef is also under pressure from tropical cyclones, ocean acidification, invasive marine species and declining water quality.

8 : Impacts

9 : Impacts Benefit of using coupled ocean-atmosphere models for agribusiness management decisions % of long-term income no forecast forecast % of years
10 : Impacts Use of coupled forecast (with dynamic ocean) improves realisable farm yield and profits N fertilizer (kg N/ha) An example for WA wheat region Profit ($/ha) Forecast V V Historical knowledge Coupled forecast $94 /ha $161 /ha Benefit of forecast $67 /ha = 71% Current farmers practice Risk (# loss years; mean loss)

11 Illustration of the seven spheres of the Earth System, which are intertwined and physically coupled through exchange fluxes of energy, momentum, and matter, and biogeochemically coupled through fluxes of carbon and other substances.

12 The Ocean regions surrounding Australia are important in the earths climate for the key climate variables: heat, water, carbon and nutrients.


13 The ocean surrounding Australia have experience significant trends over the recent period Freshwater Trends Temperature Trends

14 Using rainfall anomalies as a proxy for extreme El Nino, occurrences of extreme El Nino-like event are projected to double


15 under UV light inshore GBR corals show luminescent lines due to humic acids from soils during flood events proxy for river flow and rainfall

16 Tripled length of instrumental record 1974 wettest year dry period late 18 th -early 19 th century extremes becoming more extreme extremes occurring more often Lough, 2011


17 u Climate Variability and Climate Change: Impacts Variability is due to modest warming trend and a systematic transition to boundary currents thermocline that are significantly less stable. The shift to warm boundary currents coincides with a weakening of the Hadley cell and a 40% reduction in the strength of the subtropical jet.
 help to")

18 High-latitude oceans (modulated by seasonally-varying sea-ice coverage) help to govern the ocean s overturning circulation to control oceanic heat and carbon storage on long timescales
19 The effect of sea level rise during the 20th century at two Australian sites. The Average Recurrence Interval for extremes sea level was reduced by a factor of around three at both sites, so that an extreme that used to occur, say, every three years now occurs every one year. Fremantle Fort Denison
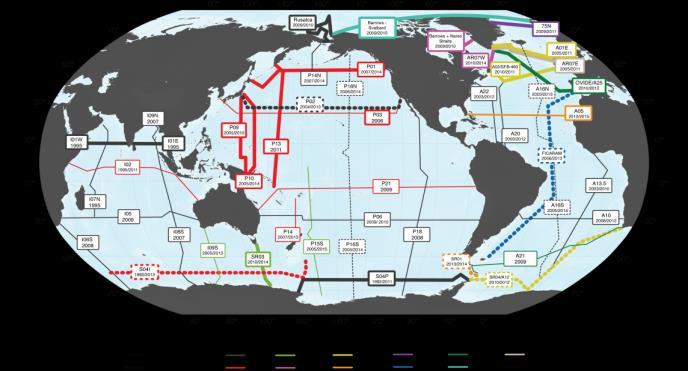
20 A schematic of the ocean observing system


21 Australia is a significant partner in all of the components of the ocean observing system both in maintaining the observing system and providing scientific oversight. We strongly leverage our limited resources to further international invest in our region.

 T-Tide USA")
22 Australian researcher also need to participate in intensive process studies. The Southwest Pacific Ocean Circulation and Climate Experiment (SPICE) T-Tide USA Canada Australia

23 IOCCP GOA-ON SOCAT SOOS GO-SHIP FOO GCP


24 GO-SHIP/ GLODAP anthropogenic CO 2 storage IOCCP/ SOCAT Air-sea CO 2 Flux


25
 of air-sea CO 2 exchange is used to determine the global carbon")

26 Observational synthesis products (e.g. SOCAT) of air-sea CO 2 exchange is used to determine the global carbon budget. The atmosphere and ocean accumulation of CO 2 allows the land sink to be resolved. This work is feeding into yearly updates of the global carbon budget (

,")

27 BLUElink is an ocean modelling and analysis tool used for accurately forecasting ocean conditions. BLUElink Reanalysis (BRAN), provides a time-varying picture of the ocean circulation over the past 20 years.

 The operational system is called OceanMAPS the Ocean Modelling Analysis and")
28 BLUElink is an ocean modelling and analysis tool used for accurately forecasting ocean conditions. The global ocean model that underpins BLUElink is called the Ocean Forecasting Australia Model (OFAM) The operational system is called OceanMAPS the Ocean Modelling Analysis and Prediction System. This produces daily, 7-day forecasts of ocean conditions.

29 The Australian Community Climate Earth System Simulator (ACCESS) is our national climate model. ACCESS is a numerical model of the major elements of the climate system that affect the Earth s weather and climate. It provides global and national climate change assessments.

30 The Australian Community Climate Earth System Simulator (ACCESS) is our national climate model. ACCESS is a numerical model of the major elements of the climate system that affect the Earth s weather and climate. It provides global and national climate change assessments.

.")
31 Coupled ocean-atmospheric prediction system 12km Atmosphere, 10km ocean Tropical Cyclone Yasi Sea surface velocities from control (a) and ensemble ocean atmosphere prediction system(b). (Sandery and O Kane 2013)


32 Australian Climate research is highly qualified and respected in the international climate community
33 Marine science priorities for dealing with climate variability and change. Enhanced understanding of ocean-cryosphere-atmospherebiogeochemical variability and controls on interocean exchanges by wind, heat and freshwater fluxes. Improved knowledge of the impact of increasing greenhouse gas concentrations on the complex interplay between major climate phenomena and ocean-cryosphere-atmosphere-biogeochemical dynamics Increased understanding of the mechanisms and impacts of multidecadal variability and longer-term trends on Australian and regional climate (including Asia and Pacific Islands).

34 Challenges High quality observations and adequate Research Vessel access Global and regional ocean climate modelling of world-class standard with a Southern Hemisphere focus Computational & storage resources meeting the next decade s scientific needs Adequate and sustained research funding targeting the marine climate sector


35 Investment in Australian and regional marine climate variability and change research provides significant benefit to a diverse group of end-users including national, state and local governments, national defence organisations, tourism, fisheries and aquaculture, off-shore oil and gas and renewable energy industries, marine parks and regulatory authorities. The research undertaken by this science community underpins development of climate products and services needed by industry, the public and policy makers.
36 Dealing with Climate Variability and Climate Change Bernadette Sloyan (CSIRO), Alex Sen Gupta (UNSW), and Matthew England (UNSW)
37