New Jersey s Climate Change and Water Resource Policy Initiatives
|
|
|
- Baldric Carter
- 5 years ago
- Views:
Transcription
1 New Jersey s Climate Change and Water Resource Policy Initiatives NJ Clean Water Council Annual Public Hearing 7 December 2009 Presentation by Marjorie Kaplan, Manager, Office of Climate & Energy (OCE)/Policy, Planning & Science NJ Department of Environmental Protection
2 Outline of Presentation Climate Change Risk Assessment Framework for Risk Assessment Climate Change --Global Context Key Impacts of Climate Change Hydrology & Water Resources Northeast Climate Projections Climate Change Response: Policy Initiatives for NJ Climate Change Response: Mitigation & Adaptation U.S./NJ Contribution to Global Warming/Climate Change NJ Response: Mitigation Policies & Programs including Water-related Measures NJ Response: Mitigation (Funding Mechanism) NJ Response: Adaptation Policies & Programs NJ Response: Draft Water Supply Plan Concluding Note
3 CLIMATE CHANGE RISK ASSESSMENT
4 Framework* for Climate Risk Assessment Present and Past Climatologies- current and historical climate trends, indicators, variability Climate Models- temperature, precipitation, sea-level rise; indicate climate uncertainty (IPCC AR4, 2007) Emission Scenarios- population, GDP, technology (IPCC, 2000) Regional Climate Scenarios- downscaled model- based probabilities characterize risks Extreme Events- frequency and intensity of heat waves, rainfall flooding, droughts and coastal storms High Impact Scenarios- Ice sheet melting and Arctic sea ice extent monitored and evaluated *Adapted from Center for Climate Systems Research, Columbia University
5 Options for Dealing with Climate Change The optimal decision will depend on: Pattern and rate of climatic change Frequency, proximity and severity of extreme events The potential impact of climate change for natural and human systems (exposure and sensitivity) Adaptive capacity of current systems and communities in the state Costs and timeframes associated with options for dealing with climate change
6 Climate Change Global Context Enhanced GHG effect due to increased CO 2 concentrations (pre-industrial 275 ppm; now 390 ppm; stabilization level 450 ppm) Increase in temperature accompanied by changes in climate (cloud cover, precipitation, wind patterns, seasonal durations) Extreme weather events very likely (will be difficult and disruptive)
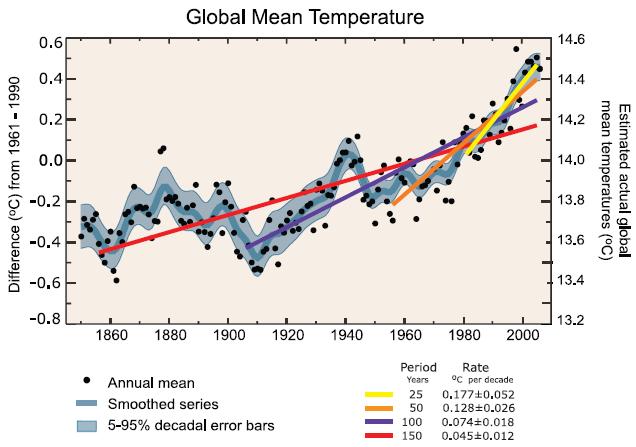
7
8 Key Impacts of Climate Change Water: Quantity and quality Human health: Changes in vector-borne diseases, heat/air quality-related mortality Ecosystems: Wildfire risk; loss of ecosystem services with decreases in biodiversity and populations of critical/endangered species Infrastructure and Energy: Changes in severe weather events, possibly including tropical storms Concomitant and Indirect Impacts: (e.g., economics, industry, agriculture, human health)
 TAR Increased runoff and earlier spring discharge from snow melt and glacial melt, Warming lakes and")
9 Increased Streamflow Earlier Stream Flow Warming Lakes Hydrology and Water Resources Projected "increases in annual mean streamflow in high latitudes (medium confidence) TAR Increased runoff and earlier spring discharge from snow melt and glacial melt, Warming lakes and rivers


10 How does climate change affect each of the 3 components of water supply? Water source Water collection, treatment & distribution Water demand
11 Northeast Climate Projections (NECIA, 2007) More frequent days with temperatures above 90 0 F (NCAR * projects record highs could outnumber record lows 20 to 1 by the end of the century) Longer growing season Increased heavy precipitation (20-30% late 21 st c.) Winter ppt falling more as rain rather than snow; reduced snowpack; earlier breakup of ice on lakes and rivers; earlier spring snowmelt resulting in earlier peak river flows Rising sea surface temperatures and sea level (10-23 in.); the latter may result in saltwater intrusion into estuaries and aquifers, inundate polluted sites, compromise coastal ecosystems (including loss of wetlands and their water filtration functions) *National Center for Atmospheric Research
12 Temperature Impacts on Water Sector -Longer growing season -More evaporation -Less runoff -More demand for lawn irrigation.
13 Precipitation Impacts on Water Sector More extremes (storms & droughts) means more storage is needed.

14 Public Water Supplies in NJ reservoirs intakes wells
15 Sea Level Rise Impacts Infrastructure, residential and commercial assets are all at risk to SLR and more frequent coastal flooding Inland flooding from rainfall will be more destructive due to drainage problems Saltwater will intrude into estuaries and aquifers, and inundate polluted sites Coastal ecosystems will be compromised Northeast coasts face increases in the extent and frequency of storm surge, coastal flooding, erosion and wetland loss (along with their water filtration)
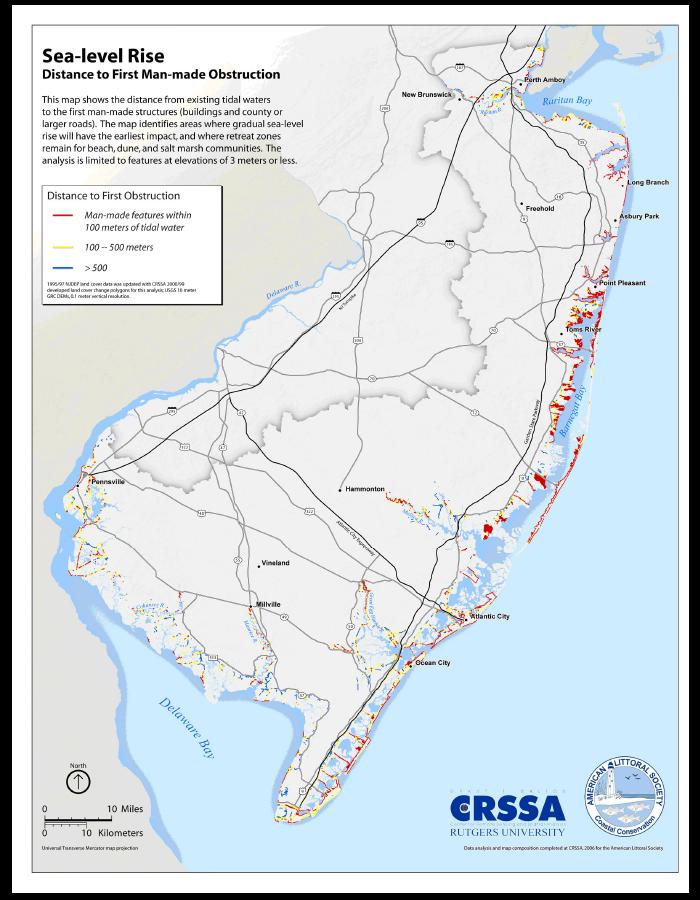
16
17 Aquatic Ecosystem Impacts Ecosystem health is an element of water quality standards Ecological communities and wildlife depend on adequate stream flow In the Northeast conditions of low stream flow are projected to last roughly a month longer by late century under higher GHG emissions scenario For communities dependent on streams and rivers for their water supply, this trend is cause for concern Biological indicators of water quality will be affected (e.g., hydrologic sensitivity)
18 CLIMATE CHANGE RESPONSE: POLICY INITIATIVES FOR NJ
19 Climate Change Response: Mitigation, Sequestration, Adaptation Limiting Future Impacts Mitigation (reduced CO 2 emissions through energy efficiency, renewable energy, carbon capture and storage and reduced CH 4 emissions) and Sequestration (enhanced CO 2 uptake by natural systems through improved land-use management) Response to Existing Impacts Adaptation ( climate proofing, i.e., ensuring development of climate-resilient human and ecological communities)
20 U.S. and NJ Contribution to Global Warming/Climate Change U.S. emits 20% of the world s GHG emissions NJ emits approximately 137 MMTCO 2 annually (2007) which is 2% of U.S. emissions and 0.4% of global emissions U.S. needs to cut emissions 30% by 2030 and 80% by 2050 to meet stabilization goal of 450 ppm CO 2 in the atmosphere NJ goal is to stabilize its emissions to 1990 level (123 MMTCO 2 ) by 2020 & reduce emissions 80% below 2006 level by 2050 (i.e., 25.5 MMTCO 2 )
21 GHG Emissions by Sector; New Jersey, 2007 Millions of Metric Tons CO 2 equivalent -7 Transportation (~38% of total) Electric Generation (~26% of total) Industrial (~12% of total) 26 Residential/Commercial (~19% of total) Other (~1% of total) Waste Management (~4% of total) 16 Other Highly Warming Gases (~3% of total) 36 Terrestrial Carbon Sequestration (offsets ~5% of total)
22 NJ Response: Policies & Programs (Mitigation) Executive Order 54 (2/13/2007) and Global Warming Response Act (7/6/2007) set statewide GHG limits Draft Global Warming Response Act 2020 Recommendations Report (12/15/2008) Three Core actions in GWRA: 1) Regional Greenhouse Gas Initiative (RGGI), 2) Energy Master Plan (EMP) and 3) Low Emission Vehicle (LEV) program, all 3 designed to meet 2020 GHG limits Beyond core actions, there are a host of other recommendations & related actions in key sectors including terrestrial sequestration and water
23 NJ Response- (Mitigation: Water-related Measures in Draft GWRA Report) Outdoor water consumption: mandatory statewide watering limits applied to all water users Green buildings: state guidelines/programs including measures to improve water conservation & decrease storm water run-off) Waste management: financial incentives to reduce carbon footprint of public water supply & POTWs
24 NJ Response: Policies & Programs (Mitigation: Funding Mechanism) Global Warming Solutions Fund Act (N.J.S.A. 26:2C-45 et seq) allocates proceeds from the auction of NJ RGGI CO 2 allowances ($51 million to date) 60% to EDA for end-use energy efficiency and new stateof-the art electric generation in commercial, institutional, industrial sectors; 20% to BPU to reduce electricity demand & costs for residential low and moderate income electricity customers; and 20% to DEP (10% to support local government GHG efforts and 10% to enhance stewardship & restoration of State forests and tidal wetlands [CO 2 storage & co-benefits, e.g., water filtration])
25 NJ Response: Policies & Programs (Adaptation) Draft Global Warming Response Act 2020 Recommendations Report commits the State to developing Comprehensive Adaptation Plan; lays out framework for the impacts to be addressed State currently in early stages of plan formulation and expects a coordinated process integrating other on-going efforts (e.g., Water Supply Plan)
26 NJ Response: Policies & Programs (Mitigation and Adaptation: Work in Progress) A number of working groups set up to address adaptation research, planning & implementation concerns including collaboration with DEP programs, regional and federal initiatives Basic research questions (e.g., scale issues) being considered with regard to use of climate models with implications on water supply planning, TMDL, aquatic ecosystem indicators, and other applications relevant not only to water but other key sectors as well Example is determining probabilities of changes in occurrence and seasonality of temperature, precipitation and solar radiation over different timescales (20, 25, 50, 75, 100 years)
27 NJ Response: Draft 2009 Water Supply Plan (NJWSP) Includes acknowledgement of climate change as part of future management challenge for water supply in NJ Recognizes the importance of maximizing water efficiency as an effective form of adapting to the potential water related impacts of climate change. Demand management is also key feature of the draft NJWSP DEP coordinating with USEPA & other state agencies in developing cooperative strategies to address climate change impacts on a statewide & regional basis

28 Average NJ Water Use, 1990 s (944 billion gallons/year)
29 Conclusion: Challenge of Climate Change Climate change will alter the distribution, quantity, and quality of water by affecting precipitation, air, and water temperature, and snow melt. Climate change will drive adaptation of the state s water supply infrastructure and allocations to meet the needs of its population. Cost of inaction > costs of mitigation & adaptation