Appendix Q. Tier 3 Air Quality Assessment
|
|
|
- Ashlie Daniels
- 5 years ago
- Views:
Transcription


1 Appendix Q Tier 3 Air Quality Assessment
2 This Air Quality Assessment was received from Camilla Needham, BECA Associate Environmental Engineering 12 th July 2013.
3 Report Northern Arterial Extension and Cranford St Upgrade Project Air Quality Assessment Prepared for Opus International Consultants Ltd (Client) By Beca Ltd (Beca) 19 August 2013 Beca 2013 (unless Beca has expressly agreed otherwise with the Client in writing). This report has been prepared by Beca on the specific instructions of our Client. It is solely for our Client s use for the purpose for which it is intended in accordance with the agreed scope of work. Any use or reliance by any person contrary to the above, to which Beca has not given its prior written consent, is at that person's own risk.
4 Northern Arterial Extension and Cranford St Upgrade Project Air Quality Assessment Revision History Revision Nº Prepared By Description Date A Mathew Noonan Draft 12/07/2013 B Mathew Noonan Final 19/08/2013 Document Acceptance Action Name Signed Date Prepared by Mathew Noonan 19/08/2013 Reviewed by Camilla Needham 19/08/2013 Approved by Hugh Leersnyder 19/08/2013 on behalf of Beca Ltd Beca // 19 August 2013
5 Table of Contents 1 Introduction Background Scope of the Assessment Exclusions Project Description Overview of the 2011 Air Quality Assessment Predicted Traffic Flows Revised Traffic Volume Predictions Comparison of Traffic Model Predictions Methodology Methodology Overview Sensitive Receptors Revised Emission Rates Benzene Emission Rates Nitrogen Oxide Chemistry Background Pollutant s Assessment Criteria Predicted Ground Level s Predicted CO s Predicted NO 2 s Predicted PM 10 s Predicted PM 2.5 s Predicted Benzene s Summary References...22 Beca // 19 August 2013 // Page 1
6 1 Introduction The Christchurch City Council (CCC) is proposing the construction of an extension to the Northern Arterial in conjunction with the upgrade of Cranford St. Opus International Consultants (Opus) are the lead consultants engaged by the CCC to undertake an assessment of the environmental effects of the proposed Northern Arterial Extension (NAE) and Cranford St Upgrade (CSU) Project (the Project). Opus has commissioned Beca Ltd (Beca) to provide an assessment of the potential air quality effects of the Project. 1.1 Background An assessment of the air quality effects of the Northern Arterial and provision of four lanes to Queen Elizabeth II (QEII) Drive was conducted in 2011 (NIWA, 2011). Dispersion modelling was used to assess the effect of vehicle emissions from the proposed development and the surrounding road network, including the proposed NAE and CSU Project. Since the 2011 assessment, the CCC has updated their traffic model predictions based on new land-use forecasts. As a consequence predicted traffic volumes on some key roads have significantly changed from those used in the 2011 air quality assessment. Also the vehicle emission model (VEPM (Vehicle Emissions Prediction Model) used to estimated emission rates has been updated from version 3 to version 5.1. The updated emission model provides a more accurate assessment of NZ vehicle fleet s future emission rates. Changes to predicted traffic volumes and vehicle emissions assumption will have an effect on the ground concentrations presented in the 2011 air quality assessment. 1.2 Scope of the Assessment This report assesses the air quality effects of the Project. The assessment is largely based on results of 2011 air quality assessment. This assessment is intended to update and supplement the 2011 assessment rather than replace it. In this report maximum ground level carbon monoxide (CO), nitrogen dioxide (NO 2 ), fine particulate (PM 10 and PM 2.5 ) and benzene concentrations have been predicted at sensitive receptors affected by the proposed development. Predicted concentrations have been derived from those reported in the 2011 air quality assessment but adjusted to account for changes in predicted traffic volumes and vehicle emission rates. Beca has not undertaken any additional dispersion modelling. The contribution from background emission sources to ambient pollutant levels has been assessed in the report using the same approach used in the 2011 air quality assessment. The validity of the background concentrations post the February 2011 earthquake have also been considered. The potential effect of the air discharges has been assessed by comparing predicted ground concentration against relevant air quality criteria. 1.3 Exclusions Revised ground level concentrations have been based on the results of the 2011 dispersion modelling. Beca has assumed that the dispersion model configurations and input data have been correctly configured and reviewed. The results of the modelling are assumed to provide a reliable assessment of worst case air pollutant levels based on the 2011 traffic and vehicle emission rate input assumptions. Beca has not undertaken a detailed review of the ambient air monitoring data used to establish background levels in the 2011 assessment. Beca // 19 August 2013 // Page 2
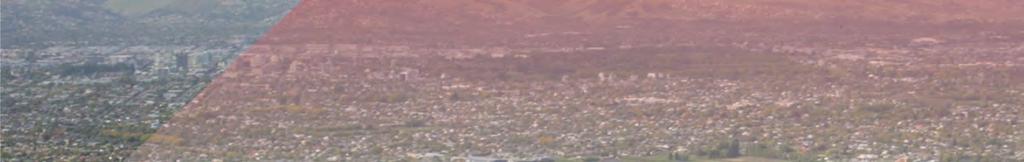
7 Predictions have been based on the revised traffic volumes provided to Beca by Christchurch City Council. 1.4 Project Description The Northern Arterial, the Northern Arterial Extension and the Cranford Street Upgrade projects were identified in the Greater Christchurch Urban Development Strategy as part of a package of works to improve access to the port and city from the north, which supports economic growth and opportunities for the region. The New Zealand Transport Agency (NZTA) is responsible for the design and construction of the proposed Northern Arterial. This will be a new four-lane, median separated state highway starting at the existing Christchurch Northern Motorway just south of the Waimakariri River bridges, passing to the east of Belfast and Redwood and connecting with QEII Drive near Winters Road. The Christchurch City Council is responsible for the NAE and CSU Project. The NAE will be a new four lane local road from the southern end of the Northern Arterial Route, at the double roundabout on QEII Drive, to Cranford Street through Cranford Basin. It will provide an extension to the Northern Arterial. The Cranford Street Upgrade project includes the four laning of Cranford Street from its junction with this proposed Northern Arterial Extension to its intersection with Innes Road, with intersection improvements at the Cranford/McFaddens intersection and the Cranford/Innes intersection. The Project is expected to be completed between 2020 and Overview of the 2011 Air Quality Assessment The 2011 air quality assessment was prepared in support of the proposed Northern Arterial and four laning of Queen Elizabeth II (QEII) Drive. The air quality effects with and without the proposed development were predicted for the future years of 2016 and The air quality effects of existing traffic conditions were also assessed (assuming a baseline year of 2010). Both the 2016 and 2026 with project traffic scenarios assumed the NAE and CSU Project had also been completed 1. The AUSROADS dispersion model was used to predict ground level pollutant levels for the four future emission scenarios and the baseline scenario. The vehicle emissions from the Northern Arterial, QEII Drive, and other main streets in the vicinity of the development, including the NAE, Cranford St and Innes Rd were incorporated in the dispersion model configuration. The dispersion model study domain is shown in Figure 1-1. The figure shows road sources included in the dispersion model and the location of sensitive receptors where ground level concentrations were predicted. 1 The NAE and CSU are now not expected to be complete by 2016, as assumed in the with project traffic model assumption. Beca // 19 August 2013 // Page 3
8 Figure 1-1. The 2011 dispersion model study area showing the road sources included in the dispersion model and sensitive receptors where pollutant levels were predicted (NIWA, 2011) The assessment therefore modelled the effect of the proposed NAE and CSU Project and also predicted pollutant levels at the sensitive receptors that would be most affected by the Project. Importantly the dispersion model considered the impact at residential properties located to the north of the Cranford St and Innes Rd intersection (Residential Area 5) where the greatest change in traffic volumes are predicted to occur as consequence of the Project. Beca // 19 August 2013 // Page 4
9 The contribution from background sources to ambient pollutant levels was estimated based on ambient air quality monitoring conducted in Christchurch. Background CO and NO 2 levels were derived from pollutant levels recorded during the pre-project monitoring programme near the proposed intersection of Northern Arterial and QEII Drive, and approximately 50m to the south of the QEII Drive. Background particulate matter (PM 10 and PM 2.5 ) and benzene levels were derived from the wider Environment Canterbury (ECan) ambient air monitoring network. The assessment, concluded that any adverse effects caused by the discharge of CO, NO 2, benzene, PM 10 or PM 2.5 from vehicle travelling road within the study area are likely to be minor. Beca // 19 August 2013 // Page 5
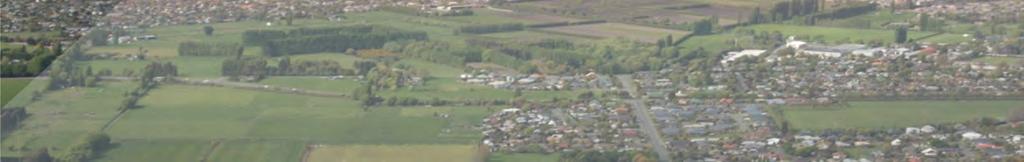
10 2 Predicted Traffic Flows 2.1 Revised Traffic Volume Predictions Relative contribution of motor vehicle emission to ambient air quality is roughly proportional to traffic volumes, although other factors such as speed, composition and congestion also have an effect. The Christchurch City Council has recently revised their traffic model predictions. Traffic flows have been predicted for with Project and do-minimum traffic scenarios for the project years 2026 and The do-minimum traffic scenario assumes that the Project has not been developed but that Northern Arterial and QEII upgrade have been completed. The predicted effect that the Project has on average daily traffic volumes in Christchurch for the projected year 2041 is shown in Figure 2-1. The figure shows the predicted difference in daily traffic volumes between the with Project and do-minimum scenarios. A predicted increase in daily traffic volumes is shown as a blue line and a decrease in traffic volumes as a green line. The thickness of the line varies in proportion to the change in predicted traffic volumes. The side of the road provides an indication of the direction of the traffic. Only the roads that are predicted to have an average daily traffic volume greater than 7,000 vehicles per day are shown in the figure. These roads are highlighted as red lines. A 7,000 vehicle per day criterion is proposed in the Ministry for the Environment s (MfE) Good Practice Guide for Assessing Discharges to Air from Land Transport ( MfE GPG Transport ) (2008) as one of the initial, Tier 1, screening criteria to identify roads where vehicle emissions may have an effect on ambient pollutant levels. Figure 2-1 clearly shows that the main effect of the Project would be increased traffic volumes along Cranford St, between the NAE and the Innes Rd intersections. The Project is also predicted to increase east bound traffic flows on QEII Drive between Main North Rd (SH74) and the Northern Arterial interchange, and on the Northern Arterial. Decreases in daily traffic volumes are predicted on QEII Drive between the Northern Arterial and Innes Rd, Cranford St to the north of NAE intersection, and the northern section of Innes Rd. Other smaller decreases in traffic volumes are predicted on the Main North Rd, Marshland Rd, and Johns Rd (SH1). The difference in with project and do-minimum traffic volumes are indicative of the relative effect vehicle emissions will have on nearby ambient air quality levels in the proposed Project is developed. Therefore, the traffic modelling results indicate the contribution from motor vehicle to air pollutant levels would be expected to increase with the Project (relative to the do-minimum scenario) in the residential areas located either side of the Cranford St, between the NAE and Innes street intersections. Smaller increases could also be expected at locations adjacent to the North Arterial and QEII Drive between the Northern Arterial and Main North Rd. Conversely the contribution from motor vehicle emissions to ambient pollutant levels would generally be expected to decrease near roads where decreases in traffic volumes are predicted (e.g. Cranford Rd north of the NAE intersection, QEII drive east of the NAE intersection, Main North Rd, Marshland Rd, and Johns Rd). Beca // 19 August 2013 // Page 6
 A summary of predicted average daily traffic volumes at key point")
11 Figure 2-1. Predicted changes in average daily traffic volumes between the do-minimum and with Project 2041 traffic scenarios (CCC, 2013) A summary of predicted average daily traffic volumes at key point locations in the road network is presented in Table 2-1. The table shows the predicted traffic volumes with and without the Project for the projected future years and the change in traffic volumes as a percentage of the dominimum scenario. The point locations are shown in Figure 2-2. The table shows the most significant change in traffic volumes between the do-minimum and with project scenarios are predicted occur on Cranford Rd. The highest average daily traffic volumes are also predicted to occur on Cranford St south of the NAE with the Project. Maximum average daily traffic volumes to the south of the NAE are predicted to be 49,900 vehicles per day; 68% higher than traffic flows for the do-minimum traffic scenario. The proportion of vehicles which are heavy commercial vehicles or buses using Cranford St between Innes Rd and the NAE is also predicted to increase slightly from approximately 3.5% to 5% with the development of the Project. The table also shows that traffic volumes are predicted to increase only slightly between the years 2026 and 2041 for both the do-minimum and with project traffic scenarios. Therefore changes in traffic volumes between 2026 and 2041 are not expected to have a significant effect on air pollutant levels. Beca // 19 August 2013 // Page 7
12 Table 2-1. Summary of average daily traffic volumes predicted for the years 2026 and 2041 ID Road Year 2026 Year 2041 Do min With Project % Change Do min With Project % Change 1 NAE NA NA Cranford St north of NAE % % 3 Cranford St south of NAE % % 4 Cranford St north of Innes St % % 5 Cranford St south of Innes St % % 6 Northern Arterial % % 7 Main North Rd north of QEII % % 8 Innes Rd west of Cranford St % % 9 Innes Rd east of Cranford St % % 10 QEII Drive east of Northern Art % % 11 QEII Drive west of Northern Art % % 12 Marshland Rd % % 13 Warrington St % % Figure 2-2. Location of average traffic volumes predicted in Table 2-1 Beca // 19 August 2013 // Page 8
13 2.2 Comparison of Traffic Model Predictions The 2011 air quality assessment assessed air quality effect based on the predicted traffic flows for the years 2016 and The with project traffic scenario assumed the NAE and CSU Project had been completed for both years. The Project is now expected to be complete after 2020; therefore the 2016 predictions assuming the Project has been completed have not been referred to in this assessment. A comparison of the predicted with Project average daily average traffic volumes used the 2011 dispersion modelling assessment and those predicted by the revised CCC s traffic model for the year 2026 is presented in Table 2-2. The table also summarises the percentage of traffic that are predicted to be heavy commercial vehicles (HCVs). HCV emission rates per kilometre travelled basis are generally higher than light commercial vehicle and passenger car emission rates. The table shows the most recent traffic modelling predicts higher traffic volumes than those used in the previous assessment. Substantially higher traffic volumes are predicted on Cranford St, Innes St (east of the Cranford St intersection) and QEII Drive (west of the Northern Arterial). Higher ground level pollutant concentrations would be expected at receptor located near these roads using the updated traffic model predictions compared to those predicted in the 2011 assessment. However, with the exception of QEII Drive, the percentages of traffic which are HCVs are higher for the 2011 assessment compared to the revised CCC traffic model. Therefore, although the revised traffic model predicts higher traffic volumes the average emission rate per vehicle would generally be expected to be higher for the 2011 predictions. Table 2-2. Comparison of annual average daily traffic volumes for 2011 air quality assessment and 2013 traffic modelling 2026 with-project traffic scenarios ID Road 2011 Air Quality Assessment 2013 Traffic Modelling % Difference in Vehicles Vehicles %HCV Vehicles %HCV 1 NAE % % 14% 2 Cranford St north of NAE % % 144% 3 Cranford St south of NAE % % 46% 4 Cranford St north of Innes St % % 44% 5 Cranford St south of Innes St % % 35% 6 Northern Arterial % % 12% 7 Main North Rd north of QEII % % 26% 8 Innes Rd west of Cranford St % % 47% 9 Innes Rd east of Cranford St % % 81% 10 QEII Drive east of Northern Art % % 39% 11 QEII Drive west of Northern Art % % 72% 12 Marshland Rd % % 11% 13 Warrington St % % 13% Beca // 19 August 2013 // Page 9
14 3 Methodology 3.1 Methodology Overview Revised ground level CO, NO 2, PM 10, PM 2.5, and benzene concentrations have been estimated based on the results of the 2011 dispersion modelling assessment. Maximum pollutant concentrations have been estimated at the sensitive receptors defined in the 2011 dispersion model. The effects of changes in daily traffic volumes and vehicle emission rate assumption have been factored into the revised prediction using the calculation procedure shown below. Where; C i,2013 = C i,2011 x (AADT 2013 / AADT 2011 ) x (E i,vepm5.1 / E i,vepm3 ) C i,2013 = The revised concentration of pollutant i C i,2011 = The concentration of pollutant i predicted in the 2011 assessment for the 2026 withproject traffic scenario AADT 2013 = The revised 2013 traffic model s average annual daily traffic volume predicted on the road adjacent to the receptor AADT 2011 = The 2011 traffic model s average annual daily with project traffic volumes on the road adjacent to the receptor E i,vepm5.1 = Average vehicle emission rates predicted for pollutant i using VEPMv5.1 E i,vepm3 = Average vehicle emission rates predicted for pollutant i using VEPMv3 The approach assumes that the ratio of the 2013 and 2011 traffic model s AADT volumes also provides an approximate estimate of the relative variation in traffic flows on an hourly basis and so can also be used to estimate the effect of the predicted changes in traffic flows have on predicted 1- hour and 8-hour average concentrations in addition to 24-hour and annual average concentrations. The New Zealand fleet s average vehicle emission rates are predicted to decrease over time. The decrease associated with the gradual retirement of older vehicle with poor emission control technologies and their replacement new vehicles with improved emission controls. Therefore, average vehicle emission rates in 2026 are expected to higher than those in Since traffic volumes are not predicted to change significantly between the projected years (refer Table 2-1) total vehicle emission rates are also expected to be higher in 2026 than in In this assessment only the effect of vehicle emission for the 2026 emission scenario have been presented. These emission rates reflect expected worse-case emission conditions when vehicle will have the greatest effect on ambient air quality. Also VEPM only estimates vehicle up to the year Beca // 19 August 2013 // Page 10
15 3.2 Sensitive Receptors Due to the predicted increase in traffic volumes, the residential areas located on either side of Cranford St between the NAE and Innes St are expected to be most affected by the Project. Predicted maximum concentrations in Residential Area 5 are expected to be comparable to those which would occur in the residential areas on both sides of Cranford St. The 2011 dispersion model receptors points are therefore also appropriately located to assess the worst case effect of the Project. Other sensitive receptors which may be adversely impacted include the residential area on QEII Drive west of the Northern Arterial (i.e. Residential Area 4), St Bedes School, Owen Park, and the residential area located adjacent to the Northern Arterial (i.e. Residential Area 1 and 2). These areas were also been incorporated in the 2011 dispersion model receptor grid. 3.3 Revised Emission Rates Vehicle emission rates were assessed in the 2011 assessment using the VEPM v3 motor vehicle emission model. VEPM has been developed to specially model the New Zealand vehicle fleet s emission rates and is widely used to assess in New Zealand to assess transportation projects. Since the publication of the 2011 assessment VEPM has been updated to version 5.1. A comparison of average vehicle CO, volatile organic compounds (VOCs), nitrogen oxide (NO X ), PM 10 and PM 2.5 emission rates predicted using VEPM v3 and VEPM v5.1 for the vehicle fleet composition used in the 2011 assessment and assuming 6% of the vehicle fleet is a HCV is presented in Table 3-1. Predicted emission rates are shown for the average vehicle speed of 40, 50, 60, 70 and 80km/hr for the projected year of The ratio of VEPM v3 divided by VEPM v5.1 (i.e. E i,vepm5.1 / E i,vepm3 ) is also presented in the table. The results show there is little difference in VOC and NO X between VEPM v3 and VEPM v5.1. However, VEPM v5 CO emission rates are predicted to be approximately twice those predicted using VEPM v3 and PM 10 emission rates approximately 60% of those predicted using VEPM v3. Table 3-1 also shows the relative difference between the emission models (i.e. the E i,vepm5.1 / E i,vepm3 emission rate ratio) remains relatively constant with respect to average vehicle speed. Therefore, in this assessment the calculation procedure has been simplified by assuming the emission rate ratio is constant for all vehicles speeds and a single pollutant specific emission rate ratio has been used to account for differences between the emission models. A factor of 2.2, 1.05, 1.1, 0.50, and 0.65 have been respectively applied to the predicted CO, VOCs, NO X, PM 2.5 and PM 10 concentrations reported in the 2011 assessment. The emission ratio factors used in the assessment provide a conservative estimate of difference between emission models for the vehicle speed between 40-80km/hr. Beca // 19 August 2013 // Page 11
16 Table 3-1. Predicted average vehicle emission rates (g/km) with VEPM3 and VEPM5.1 for the year 2026 Pollutant Model 40 km/hr 50 km/hr 60 km/hr 70 km/hr 80 km/hr CO (g/km) VEPMv VEPMv Ratio VOC (g/km) VEPMv VEPMv Ratio NO X (g/km) VEPMv PM 2.5 (exhaust) (g/km) PM 10 (exhaust + brake and tyre) (g/km) VEPMv Ratio VEPMv VEPMv Ratio VEPMv VEPMv Ratio Benzene Emission Rates The VEPM emission factors do not directly calculate motor vehicle benzene emission rates, only the emission rate of total VOC emission rates. In this report, benzene emissions have been calculated using the same method used in the 2011 air quality assessment. The percentage of VOCs emitted as benzene has been assumed to be 10.2%. The percentage has been calculated as the sum of the highest percentage of benzene discharged from vehicle exhausts and evaporative emissions presented in Table 8.5 of the MfE GPG Transport (2008). The percentage of VOC emitted as benzene is based on the estimated discharge rate for Australian vehicle fleet between years of 1998 and The percentage is predicted decrease over time. For the year 2006 was the average percentage of VOCs discharged as benzene was estimated to be 6.2%. The modelled benzene emission rates used in this assessment are expected to be conservative. 3.5 Nitrogen Oxide Chemistry Nitrogen oxides are discharged mainly in the form of nitric oxide (NO) and only a small proportion is emitted in the more toxic form of NO 2. Generally, less than 10% of the NO X are emitted in the form NO 2. However, once discharged into the atmosphere NO reacts with ambient ozone to form NO 2. The effect that reaction with NO with ozone has on predicted ground level NO 2 levels was estimated in the 2011 air quality assessment based on the approach detailed in Appendix 1 of the MfE GPG Transport (2008) for receptors located 20-50m from the roadside. The method assumes that 10% of the NO X is emitted in the form of NO 2 and that a further 20% of the NO X emitted in the form of NO has reacted with ozone to form NO 2. Therefore, ground level NO 2 concentrations are estimated to be 28% of predicted ground NO X concentrations. For consistency the same approach has also been used in this assessment. Beca // 19 August 2013 // Page 12
17 3.6 Background Pollutant s Cumulative pollutant concentrations have been calculated as the sum of dispersion model s predicted ground pollutant concentrations and the estimated contribution from other background sources to ambient pollutant levels. The derivation of the background pollutant levels is discussed in the 2011 air quality assessment report and these levels are summarised in Table 3-2. The background CO and NO 2 concentrations were estimated from concentrations recorded at the pre-development ambient air monitoring site located on QEII Drive near the proposed intersection with the Northern Arterial. Background benzene levels were derived from the annual average benzene concentrations recorded by ECan at various site in Christchurch between 2008 and 2009 (ECan, 2010). The same background levels for CO, NO 2, and benzene have also been used in this assessment. Christchurch is classified as polluted air shed under the Resource Management Act (National Environmental Standard for Air Quality) Regulations Recorded annual maximum 24-hour average PM 10 concentrations between 2009 and 2012 varied between 95µg/m 3 and 108µg/m 3. Vehicle emissions make only a small contribution to in Christchurch compared to other emission sources, particularly domestic heating emissions. Since the presentation cumulative pollutants would obscure the relative effect the Project is predicted to have on PM 10 and PM 2.5 level only the maximum predicted contribution from modelled road sources to ambient pollutant level has been presented in this report. The same approach was also adopted in the 2011 assessment. Table 3-2. Summary of background pollutant level used in the 2011 air quality assessment Pollutant Averaging Period Background CO 1-hour 1.2mg/m 3 8-hour NO 2 1-hour 24.8µg/m 3 24-hour Benzene Annual 2.0µg/m 3 PM hour 25µg/m 3 Annual PM hour 22.8µg/m 3 (i.e. 91.2% of PM 10 ) Background Pollutant s Post the 2011 Earthquake Background concentrations were derived from monitoring data recorded prior to the 2011 earthquake. Ambient PM 10 monitoring post the 2011 February earthquake has shown an increase in PM 10 levels and the number of reported exceedances of the NESAQ limit in the air shed. The increase in peak PM 10 levels have been attributed to additional discharges from post-earthquake emission sources, including dust from liquefaction and possibly demolition activities (ECan, 2011b; ESR, 2012). The effect of the earthquake on reported PM 10 levels is shown in Figure 3-1 and Figure 3-2. Figure 3-1 shows the maximum 24-hour PM 10 concentration reported at the St Albans monitoring station (the closest ECan monitoring site to the Project) and for the Christchurch air shed as a whole between 1991 and Figure 3-2 shows the number of high pollutant nights for the same period. Beca // 19 August 2013 // Page 13
18 The effect of the earthquake on air quality is indicated at both the St Albans monitoring site and the Christchurch air shed by the atypical increases in maximum PM 10 levels and number of high pollution nights recorded during The 2012 monitoring results tend to indicate that the contribution from post-earthquake sources has decreased and would be expected to decrease further over time. These emission sources are therefore likely to have a negligible effect on particulate level when the Project is completed. Future PM 10 levels in Christchurch are predicted to be closely correlated to domestic heating emissions (ECan, 2012), which in 2026 are expected to lower than in Emissions of CO and NO X in Christchurch are more strongly correlated to vehicles than home heating or industrial sources (ECan, 2011). The post-earthquake effect of vehicles on ambient pollutant levels are factored into the revised traffic model which take into consideration changes in land-use and population. These changes in traffic flows are subsequently incorporated in the dispersion model predictions. 250 Maximum 24 hour average PM 10 concentration Christchurch airshed St Albans Figure 3-1. Maximum 24-hour PM10 concentrations (data courtesy ECan) Beca // 19 August 2013 // Page 14
19 70 Number of High Pollution Day Per Year Christchurch airshed St Albans Figure 3-2. Number of high pollutant nights per year (data courtesy ECan) 3.7 Assessment Criteria Predicted ground level concentrations have been compared against relevant air quality criteria limits. A summary of the National Environmental Standard for Air Quality (NESAQ) and the Ministry for the Environment (MfE) Ambient Air Quality Guidelines (AAQG) is presented in Table 3-3. The NESAQ prescribe both a criteria concentration and also the number times per year the criteria may be exceeded. The permitted frequency of exceedances is shown in parentheses next to the concentration limit. Table 3-3. Summary of relevant air quality standards and guidelines Pollutant Averaging period Source CO 30 mg/m 3 1-hour AAQG 10 mg/m 3 (1) 8-hour NESAQ NO µg/m 3 (9) 1-hour NESAQ 100 µg/m 3 24-hour AAQG PM µg/m 3 (1) 24-hour NESAQ 20 µg/m 3 Annual AAQG PM µg/m 3 24-hour AAQG Benzene 3.6 µg/m 3 Annual AAQG Beca // 19 August 2013 // Page 15
20 4 Predicted Ground Level s 4.1 Predicted CO s Table 4-1 and Table 4-2 respectively show the maximum cumulative 8-hour and 1-hour average CO concentrations predicted at sensitive receptors in the area identified in Figure 1-1. Predictions are presented for the revised 2026 do-minimum and with project traffic scenarios. Predicted 8-hour and 1-hour average concentrations assume a background concentration of 1.2mg/m 3. The tables also show the predicted concentrations as percentages of the 8-hour average NESAQ limit of 10mg/m 3 and the 1-hour average AAQG of 30mg/m 3. Model predictions excluding the background level are shown Appendix 1. Table 4-1. Predicted maximum cumulative 8-hour average CO concentrations (mg/m 3 ) for the 2026 do minimum and with project traffic scenarios Sensitive Receptor 2026 Do Minimum 2026 With Project (mg/m 3 ) (mg/m 3 ) Residential % % Residential % % Residential % % Residential % % St Bedes College % % Owen Park % % Mairehau High School % % Papanui High School % % Table 4-2. Predicted maximum cumulative 1-hour average CO concentrations (mg/m 3 ) for the 2026 do minimum and with project traffic scenarios Sensitive Receptor 2026 Do Minimum 2026 With Project (mg/m 3 ) (mg/m 3 ) Residential % 1.7 6% Residential % 1.9 6% Residential % 1.8 6% Residential % 2.3 8% St Bedes College 2.1 7% 2.2 7% Owen Park 1.5 5% 1.6 5% Mairehau High School 2.0 7% 1.8 6% Papanui High School 1.9 6% 1.7 6% Beca // 19 August 2013 // Page 16
21 The maximum with project 8-hour average CO concentration of 1.6mg/m 3 is predicted to occur at residential properties located on Cranford St between the NAE and Innes intersection (Residential Area 5). The maximum cumulative concentration is 16% of the NESAQ limit of 10mg/m 3. The maximum contribution from vehicle emissions is predicted to 0.4 mg/m 3, or 4% of the NESAQ limit. The Project is predicted to increase the maximum concentration at the most affected site by approximately 0.2mg/m 3. The maximum with project 1-hour CO concentration is similarly predicted to occur in Residential Area 5. The maximum cumulative concentration is predicted to be 2.3mg/m 3, or 8% of the AAQG. 4.2 Predicted NO 2 s Table 4-3 and Table 4-4 respectively show the maximum cumulative 1-hour and 24-hour average NO 2 concentrations predicted at nearby sensitive receptors. Predictions are presented for the revised 2026 do-minimum and with project traffic scenarios. s have been calculated from predicted NO X levels using the method defined in Section 3.5 and assuming a background NO 2 concentration of 24.8µg/m 3. The tables also show the predicted concentrations as percentages of the 1-hour average NESAQ limit of 200µg/m 3 and the 24-hour average AAQG of 100µg/m 3. Model NO X predictions excluding the background level are shown Appendix 1. The results show that maximum with-project 1-hour and 24-hour average cumulative NO 2 concentrations are predicted to be substantially lower than the NESAQ and AAQG limits. The maximum 1-hour average NO 2 concentration predicted at any location of 67µg/m 3 is 33% of the NESAQ. The maximum 24-hour NO 2 concentration of 34µg/m 3 is 34% AAQG. The Project is predicted to have the largest effect on maximum 1-hour average concentrations in Residential Area 5. At the most affected receptor in Residential Area 5 a 34% increase in maximum 1-hour average concentrations is predicted. Small decreases are predicted at both the Mairehau and Papanui high schools. The Project is predicted to have a small effect on maximum 24-hour average NO 2 levels at affected sensitive receptors. Table 4-3. Predicted maximum cumulative 1-hour average NO 2 concentrations for the 2026 do minimum and with project traffic scenarios Sensitive Receptor 2026 Do Minimum 2026 With Project Residential % 53 26% Residential % 64 32% Residential % 52 26% Residential % 66 33% St Bedes College 63 32% 67 33% Owen Park 42 21% 44 22% Mairehau High School 59 29% 52 26% Papanui High School 56 28% 46 23% Beca // 19 August 2013 // Page 17
22 Table 4-4. Predicted maximum cumulative 24-hour average NO 2 concentrations for the 2026 do minimum and with project traffic scenarios Sensitive Receptor 2026 Do Minimum 2026 With Project Residential % 30 30% Residential % 30 30% Residential % 30 30% Residential % 34 34% St Bedes College 32 32% 32 32% Owen Park 28 28% 29 29% Mairehau High School 30 30% 29 29% Papanui High School 30 30% 28 28% 4.3 Predicted PM 10 s Table 4-5 and Table 4-6 respectively show the maximum 24-hour and annual average PM 10 concentrations predicted at nearby sensitive receptors. Predictions are presented for the revised 2026 do-minimum and with project traffic scenarios. The tables also show the predicted concentrations as percentage of the 24-hour average NESAQ limit of 50µg/m 3 and the annual average AAQG of 20µg/m 3. Only the predicted contribution from the modelled road sources to ground level concentrations are presented in the tables. The results indicate that the maximum contribution from motor vehicle to PM 10 level is predicted to be small relative to the 24-hour average NESAQ limit of 50µg/m 3. The maximum concentration predicted of 1.7µg/m 3 with the Project is 3.4% of the NESAQ limit, and only 0.7µg/m 3 higher than concentrations predicted for the do-minimum traffic scenario. Table 4-5. Predicted maximum 24-hour average PM 10 concentrations for the 2026 do minimum and with project traffic scenarios (excluding background sources) Sensitive Receptor 2026 Do Minimum 2026 With Project Residential % % Residential % % Residential % % Residential % % St Bedes College % % Owen Park % % Mairehau High School % % Papanui High School % % Beca // 19 August 2013 // Page 18
23 Table 4-6. Predicted maximum annual average PM 10 concentrations for the 2026 do minimum and with project traffic scenarios (excluding background sources) Sensitive Receptor 2026 Do Minimum 2026 With Project Residential % % Residential % % Residential % % Residential % % St Bedes College % % Owen Park % % Mairehau High School % % Papanui High School % % The contribution of motor vehicle emissions to annual average PM 10 levels is also predicted to be low relative to the AAQG of 20µg/m 3. The modelling results also show little difference with project and do minimum traffic scenario concentrations. 4.4 Predicted PM 2.5 s Table 4-7 shows the maximum 24-hour PM 2.5 concentrations predicted at nearby sensitive receptors. Predictions are presented for the revised 2026 do-minimum and with project traffic scenarios. The tables also show predicted concentrations as percentage of the 24-hour average AAQG monitoring guideline of 25µg/m 3. Only the predicted contribution from the modelled road sources is presented in the tables. The results show the maximum contribution by motor vehicles to ground level concentrations is small in comparison to the AAQG 24-hour average monitoring guideline value. Predicted increases in maximum 24-hour average PM 2.5 levels similarly small. The maximum increase in PM 2.5 levels with the development of the Project is predicted to be less than 0.3µg/m 3, or 1.2% of the guideline. Table 4-7. Predicted maximum 24-hour average PM 2.5 concentrations for the 2026 do minimum and with project traffic scenarios Sensitive Receptor 2026 Do Minimum 2026 With Project Residential % % Residential % % Residential % % Residential % % St Bedes College % % Owen Park % % Mairehau High School % % Papanui High School % % Beca // 19 August 2013 // Page 19
24 4.5 Predicted Benzene s Table 4-8 shows the maximum cumulative annual average benzene concentrations predicted at nearby sensitive receptors. Predictions are presented for the revised 2026 do-minimum and with project traffic scenarios. The tables also show predicted concentrations as percentage of the annual average AAQG of 3.6µg/m 3. Predicted concentrations assume a background concentration of 2µg/m 3. Model predictions excluding the background level are shown Appendix 1. The maximum with project annual average benzene concentration of 2.31µg/m 3 is predicted to occur in Residential Area 5. The predicted cumulative concentration is 64% of the AAQG value. However, the maximum contribution from nearby road sources is predicted to be 0.31µg/m 3 or less than 9% of the guidelines. The Project is predicted to increase maximum ground level concentration by 0.13µg/m 3 or 3.6% of the guideline. Table 4-8. Predicted maximum annual average benzene concentrations for the 2026 do minimum and with project traffic scenarios Sensitive Receptor 2026 Do Minimum 2026 With Project Residential % % Residential % % Residential % % Residential % % St Bedes College % % Owen Park % % Mairehau High School % % Papanui High School % % A summary of predicted CO, NO X, benzene, PM 10 and PM 2.5 pollutant concentrations excluding the background levels is presented in Appendix 1 for both traffic scenarios. Beca // 19 August 2013 // Page 20
25 5 Summary The results of the assessment indicate maximum pollutant concentrations for the with project traffic scenario are generally predicted to occur in the residential areas adjacent to Cranford St, between the proposed Northern Arterial Extension and Innes St intersections. This is where the greatest difference between concentrations for the with project and do minimum traffic scenarios is predicted. The higher pollutant levels correspond to the predicted increase in traffic volumes from an estimated 29,400 vehicles per day to 49,400 vehicles per day. Pollutant levels are also predicted to increase slightly at sensitive receptors adjacent to the Northern Arterial (i.e. Residential Area 1, Residential Area 2, and Owen Park) and northern end of QEII Drive (St Bedes College and Residential Area 4) where traffic volumes are expected to increase as a consequence of the Project. Slightly lower concentrations are predicted at Mairehau High School and Papanui High School where lower traffic volumes are predicted for the with project traffic scenario. In all cases, the differences in predicted pollutant levels for the do minimum and with project traffic scenarios are small when compared to ambient air quality guideline and standards. Cumulative CO, NO 2, and benzene concentrations are predicted to be less than the NESAQ and AAQG criteria levels for both the with project and do minimum traffic scenarios. The results indicate the pollutant levels associated with the Project would not be expected to have an adverse health effect. The predicted maximum contribution from motor vehicles to PM 10 and PM 2.5 concentrations at sensitive receptors for both traffic scenarios are predicted to be small compared to the NESAQ and AAQG levels (i.e. <3.4%). Predicted concentrations are also significantly less than the Christchurch air shed s existing background PM 10 levels, which currently exceed the NESAQ limit. The results indicate the Project will have a minor effect on particulate level compared to the do minimum option. The results of the update assessment indicate that any adverse effect of CO, NO 2, PM 10, PM 2.5 and benzene discharges from motor vehicle associated with the development of the Project are likely to be minor. This conclusion is consistent with the 2011 assessment. Beca // 19 August 2013 // Page 21
26 6 References Environment Canterbury, Annual ambient air quality monitoring report, ISBN Environment Canterbury, Inventory of emissions to air in Christchurch, ISBN Environment Canterbury, 2011b. Why is the number of high pollution in Christchurch higher in 2011 compared to recent years? Environment Canterbury, Is Christchurch likely to meet the NESAQ target for PM 10? ISBN Institute of Environmental Science and Research Ltd, PM 10 and Christchurch Liquefaction Silt. Ministry for the Environment Ambient Air Quality Guidelines. ISBN Ministry for the Environment, Wellington. Ministry for the Environment Good Practice Guide for Assessing Discharges to Air from Land Transport. ISBN Ministry for the Environment, Wellington. NIWA, Tier 3 air quality assessment for the development of the Christchurch northern arterial and four laning of QEII drive. Report prepared for Opus International Consultants. Beca // 19 August 2013 // Page 22
27 Appendix 1. Summary of Dispersion Model Predictions A summary of maximum predicted CO, NO X, PM 10, PM 2.5 and benzene concentrations excluding background levels is presented in Table A1-1 for the 2026 with project traffic scenario and Table A1-2 for the do minimum traffic scenario. Table A1-1. Predicted pollutant levels for the 2026 with project traffic scenario excluding background concentrations Receptor CO (mg/m 3 ) NO X PM 10 PM 2.5 Benzene 1-hr 8-hr 1-hr 24-hr 24-yr annual 24-hr annual Residential Residential Residential Residential St Bedes College Owen Park Mairehua High School Papanui High School Table A1-2. Predicted pollutant levels for the 2026 do minimum traffic scenario excluding background concentrations Receptor CO (mg/m 3 ) NO X PM 10 PM 2.5 Benzene 1-hr 8-hr 1-hr 24-hr 24-yr annual 24-hr annual Residential Residential Residential Residential St Bedes College Owen Park Mairehua High School Papanui High School Beca // 19 August 2013 // Page 23