Appendix M Land Evaluation and Site Assessment (Calipatria I, Midway I and Midway II)
|
|
|
- Beverly Morrison
- 5 years ago
- Views:
Transcription

1 Appendix M Land Evaluation and Site Assessment (Calipatria I, Midway I and Midway II)
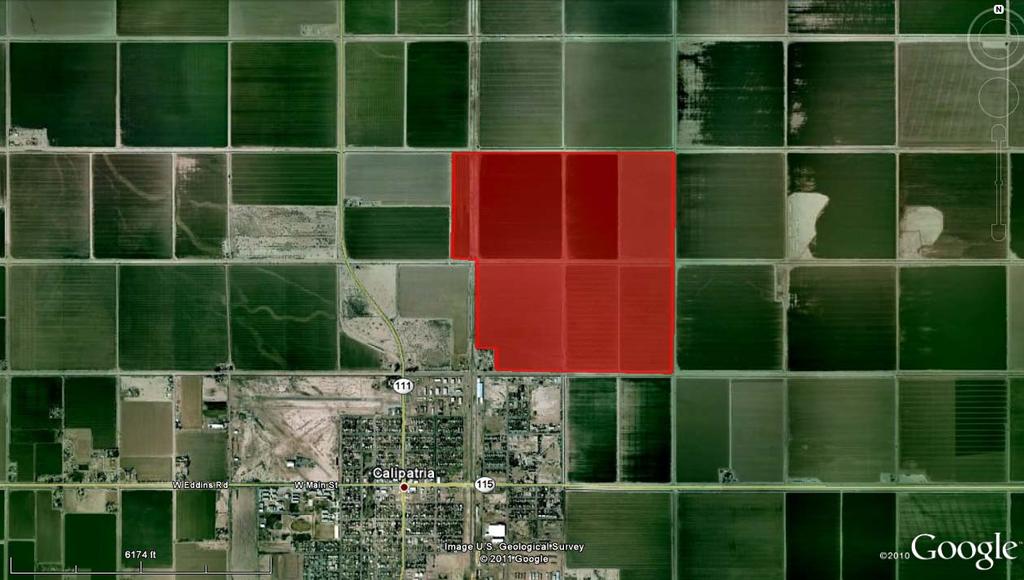
2 LESA ASSESSMENT CALIPATRIA SOLAR FARM I PROJECT AREA CALIPATRIA SOLAR FARM I PROJECT (Section 10 (portion), T12S, R14E, SBB&M) IMPERIAL COUNTY, CALIFORNIA April 2011 EMA Report No Prepared for: 70SM 8ME, LLC Santa Monica Boulevard, Suite 300 Los Angeles, California ENVIRONMENTAL MANAGEMENT ASSOCIATES
3 LAND EVALUATION AND SITE ASSESSMENT MODEL CALIPATRIA SOLAR FARM I PROJECT (Section 10 (portion), T12S, R14E, SBB&M) IMPERIAL COUNTY, CALIFORNIA The Land Evaluation and Site Assessment (LESA) model is an approach for rating the relative quality of land resources based upon specific measurable features. The LESA model was first developed by the federal Natural Resources Conservation Service (NRCS) in It was subsequently adapted in 1990 by the California Department of Conservation to evaluate land use decisions that affect the conversion of agriculture lands in California. The formulation of the California LESA Model is intended to provide lead agencies under the California Environmental Quality Act (CEQA) with an optional methodology to ensure that significant effects on the environment of agricultural land conversions are quantitatively and consistently considered in the environmental review process. For determining the potential CEQA significance resulting from the conversion of agricultural lands to some other purpose, the California Agricultural LESA Model has developed Scoring Thresholds which are used to compare the Final LESA Score and the Weighted Factor Scores for the Project with suggested Scoring Decisions. These LESA Scores do not take into consideration any proposed mitigation measures or other factors that might affect a lead agency s determination of the significance of the agricultural lands conversion impact under CEQA. The information provided on the following pages present documentation of the LESA assessment prepared using the California Agricultural LESA Model for the proposed Calipatria Solar Farm I Project (Project) (APN and [portion]). The proposed Project would be constructed on approximately 577 acres of privately owned land located about one mile north of the city of Calipatria, California (Figure 1). The Project is bounded on the north, east and south by Imperial County roads (Lindsey, Blair and Young Roads, respectively) (Figure 1).
4 LESA ASSESSMENT 70SM 8ME, LLC CALIPATRIA SOLAR FARM I PROJECT IMPERIAL COUNTY, NEVADA TABLE OF CONTENTS SUMMARY... i LIST OF FIGURES... ii LIST OF APPENDICES... ii 1. CALIFORNIA LAND EVALUATION AND SITE ASSESSMENT MODEL... 2 A LAND CAPABILITY CLASSIFICATION ( LCC )...2 B STORIE INDEX RATING...2 C PROJECT SIZE RATING...4 D WATER RESOURCES AVAILABILITY RATING...5 E SURROUNDING AGRICULTURAL LAND RATING...6 F SURROUNDING PROTECTED RESOURCE LAND RATING...6 G WEIGHTING OF FACTORS AND FINAL LESA SCORE...9 Page LIST OF FIGURES Figure 1: Project Area Map on an Aerial Photographic Base... 1 Figure 2: Project Area Soils Map... 3 Figure 3: Zone of Influence... 8 Page LIST OF APPENDICES APPENDIX A: CALIPATRIA SOLAR FARM I SOILS DETAILS
5
6 Land Evaluation Worksheet A B C D E F G H Soil Map Unit* Project Acres Proportion of LCC** LCC Rating LCC Score Storie Storie Index Project Area (irrigated) (irrigated)*** (C x E) Index** Score (C x G) IIIw IIIw Totals LCC Total Storie Index 60 Score Total Score 44 Total Project Area (acres)= * The Soil Map Unit information and acreage were determined from the current soil survey information available at the USDA Natural Resources Conservation Service website: usda aspx (Figure 2). ** The Land Capability Classification and Storie Index information was obtained from the current soil survey information available at the USDA Natural Resources Conservation Service website: (Appendix A). *** The LCC Rating for irrigated land was determined from the LCC Point Rating Table 2 from the LESA Instruction Manual (California Department of Conservation 1997).


7 Adjusted to acres Rounded Percentages
8 Site Assessment Worksheet 1 Project Size Score* I J K LCC Class I-II LCC Class III LCC Class IV-VIII Project Acres per LCC Class Project Acres per LCC Class Project Acres per LCC Class Project Acres per LCC Class Project Acres per LCC Class Total Project Acres per LCC Class * Project Size Scores Highest Project Size Score 100 * Project Size Score was determined from the Project Size Scoring Table from the LESA Instruction Manual (California Department of Conservation 1997).
9 A B C D E Project Portion Water Source Site Assessment Worksheet 2 Water Resources Availability Proportion of Project Area Water Availability Score* Weighted Availability Score (C x D) 1 Irrigation District Only Total Water (Must Sum to 1.0) 100 Resource Score * The Water Availability Score was determined using the Water Resources Availability Scoring Table from the LESA Instruction Manual (California Department of Conservation 1997).
10 Site Assessment Worksheet 3 Surrounding Agricultural Land & Surrounding Protected Resource Land A B C D E F G Zone of Influence* Surrounding Surrounding Total Acres Percent Agricultural Protected Acres of Percent in Protected Land Score Resource Land Acres in Protected Agriculture Resource (From LESA Score (From Agriculture Resource (B/A) Land Manual LESA Manual Land (C/A) Table 6) Table 7)** * In conformance with the instructions in the LESA Instruction Manual (California Department of Conservation 1997), the Zone of Influence was determined by drawing the smallest rectangle that could completely encompass the entire Project Area. A second rectangle was then drawn which extended one quarter mile on all sides beyond the first rectangle. The Zone of Influence is represented by the entire area of all parcels with any lands inside the outer rectangle, less the area of the proposed project (Figure 3). ** The LESA Instruction Manual (California Department of Conservation 1997) describes Protected Resource Land as those lands with long term use restrictions that are compatible with or supportive of agricultural uses of land. Included among them are the following: Williamson Act contracted lands; Publicly owned lands maintained as park, forest, or watershed resources; and Lands with agricultural, wildlife habitat, open space, or other natural resource easements that restrict the conversion of such land to urban or industrial uses. Percent Protected Acres in Percent Surrounding Protected Agricultural Acres of Acres Resource Protected Agricultural Parcels*** Resource Land? Agriculture Land? Land Land Land N 0 0 Y N 0 0 Y N 0 0 Y N 0 0 Y N 0 0 Y N 0 0 Y N 0 0 N N 0 0 N N 0 0 N (portion) 21.6 N 0 0 Y N 0 0 Y N 0 0 Y N 0 0 Y N 0 0 Y
11 Surrounding Parcels*** Acres Protected Resource Land? Percent Protected Resource Land Acres in Protected Land Agricultural Land? Percent Agricultural Land Acres of Agriculture N 0 0 Y N 0 0 N N 0 0 Y N 0 0 Y N 0 0 Y N 0 0 N N 0 0 N N 0 0 N N 0 0 N Urban Parcels N 0 0 N Total Total 0 Total 2154 **The Imperial County Assessors website was accessed to identify the surrounding parcel numbers ( The percentage of agriculture was determined from a map overlay used to estimate the proportion of land in agriculture and the California Department of Conservation Important Farmland Map Series.
12 Scale: 1"=2300 feet Title: Date: 12/21/2010 This map represents a visual display of related geographic information. Data provided hereon is not a guarantee of actual field conditions. To be sure of complete accuracy, please contact IMPERIALCOUNTY_PUBLIC staff for the most up-to-date information.
13 Final LESA Score Sheet Factor Scores Factor Weight Weighted Factor Scores LE Factors Land Capability Classification Storie Index LE subtotal SA Factors Project Size Water Resource Availability Surrounding Agricultural Land Protected Resource Land SA Subtotal Total LESA Score Total LESA Score 0 to 39 Points 40 to 59 Points 60 to 79 Points California LESA Model Scoring Thresholds Not Considered Significant to 100 Points Considered Significant Scoring Decision Considered Significant only if LE and SA subscores are each greater than or equal to 20 points Considered Significant unless either LE or SA subscore is less than 20 points
14 APPENDIX A: CALIPATRIA SOLAR FARM I SOILS DETAILS
15 Map Unit Description: IMPERIAL SILTY CLAY, WET Imperial County, California, Imperial Valley Area Imperial County, California, Imperial Valley Area 114 IMPERIAL SILTY CLAY, WET Map Unit Setting Elevation: -230 to 200 feet Mean annual precipitation: 0 to 3 inches Mean annual air temperature: 72 to 75 degrees F Frost-free period: 300 to 350 days Map Unit Composition Imperial, wet, and similar soils: 85 percent Minor components: 15 percent Description of Imperial, Wet Setting Landform: Basin floors Landform position (three-dimensional): Talf Down-slope shape: Linear Across-slope shape: Linear Parent material: Clayey alluvium derived from mixed sources and/or clayey lacustrine deposits derived from mixed sources Properties and qualities Slope: 0 to 2 percent Depth to restrictive feature: More than 80 inches Drainage class: Moderately well drained Capacity of the most limiting layer to transmit water (Ksat): Moderately low to moderately high (0.06 to 0.20 in/hr) Depth to water table: More than 80 inches Frequency of flooding: None Frequency of ponding: None Calcium carbonate, maximum content: 5 percent Maximum salinity: Very slightly saline to slightly saline (4.0 to 8.0 mmhos/cm) Sodium adsorption ratio, maximum: 20.0 Available water capacity: Moderate (about 8.3 inches) Interpretive groups Land capability classification (irrigated): 3w Land capability (nonirrigated): 7w Typical profile 0 to 12 inches: Silty clay 12 to 60 inches: Silty clay loam Minor Components Glenbar Percent of map unit: 4 percent Meloland Percent of map unit: 4 percent Natural Resources Conservation Service Web Soil Survey National Cooperative Soil Survey 11/12/2010 Page 1 of 2
16 Map Unit Description: IMPERIAL SILTY CLAY, WET Imperial County, California, Imperial Valley Area Holtville Percent of map unit: 4 percent Niland Percent of map unit: 3 percent Data Source Information Soil Survey Area: Imperial County, California, Imperial Valley Area Survey Area Data: Version 5, Jul 25, 2008 Natural Resources Conservation Service Web Soil Survey National Cooperative Soil Survey 11/12/2010 Page 2 of 2
17 Map Unit Description: IMPERIAL-GLENBAR SILTY CLAY LOAMS, WET, 0 TO 2 PERCENT SLOPES Imperial County, California, Imperial Valley Area Imperial County, California, Imperial Valley Area 115 IMPERIAL-GLENBAR SILTY CLAY LOAMS, WET, 0 TO 2 PERCENT SLOPES Map Unit Setting Elevation: -230 to 200 feet Mean annual precipitation: 0 to 3 inches Mean annual air temperature: 72 to 75 degrees F Frost-free period: 300 to 350 days Map Unit Composition Glenbar, wet, and similar soils: 40 percent Imperial, wet, and similar soils: 40 percent Minor components: 20 percent Description of Imperial, Wet Setting Landform: Basin floors Landform position (three-dimensional): Talf Down-slope shape: Linear Across-slope shape: Linear Parent material: Clayey alluvium derived from mixed sources and/or clayey lacustrine deposits derived from mixed sources Properties and qualities Slope: 0 to 2 percent Depth to restrictive feature: More than 80 inches Drainage class: Moderately well drained Capacity of the most limiting layer to transmit water (Ksat): Moderately high (0.20 to 0.57 in/hr) Depth to water table: More than 80 inches Frequency of flooding: None Frequency of ponding: None Calcium carbonate, maximum content: 5 percent Maximum salinity: Very slightly saline to slightly saline (4.0 to 8.0 mmhos/cm) Sodium adsorption ratio, maximum: 20.0 Available water capacity: Moderate (about 8.6 inches) Interpretive groups Land capability classification (irrigated): 3w Land capability (nonirrigated): 7w Typical profile 0 to 12 inches: Silty clay loam 12 to 60 inches: Silty clay loam Description of Glenbar, Wet Setting Landform: Basin floors Landform position (three-dimensional): Talf Natural Resources Conservation Service Web Soil Survey National Cooperative Soil Survey 11/12/2010 Page 1 of 2
18 Map Unit Description: IMPERIAL-GLENBAR SILTY CLAY LOAMS, WET, 0 TO 2 PERCENT SLOPES Imperial County, California, Imperial Valley Area Down-slope shape: Linear Across-slope shape: Linear Parent material: Alluvium derived from mixed Properties and qualities Slope: 0 to 2 percent Depth to restrictive feature: More than 80 inches Drainage class: Moderately well drained Capacity of the most limiting layer to transmit water (Ksat): Moderately high (0.20 to 0.57 in/hr) Depth to water table: More than 80 inches Frequency of flooding: None Frequency of ponding: None Calcium carbonate, maximum content: 5 percent Maximum salinity: Nonsaline to slightly saline (2.0 to 8.0 mmhos/cm) Sodium adsorption ratio, maximum: 15.0 Available water capacity: High (about 10.8 inches) Interpretive groups Land capability classification (irrigated): 3w Land capability (nonirrigated): 7w Typical profile 0 to 13 inches: Silty clay loam 13 to 60 inches: Clay loam Minor Components Holtville Percent of map unit: 10 percent Meloland Percent of map unit: 10 percent Data Source Information Soil Survey Area: Imperial County, California, Imperial Valley Area Survey Area Data: Version 5, Jul 25, 2008 Natural Resources Conservation Service Web Soil Survey National Cooperative Soil Survey 11/12/2010 Page 2 of 2
19 California Revised Storie Index Rating (CA) Imperial County, California, Imperial Valley Area California Revised Storie Index Rating (CA) The Storie Index is a soil rating based on soil properties that govern a soil's potential for cultivated agriculture in California. The Storie Index asseses the productivity of a soil from the following four characteristics: Factor A, degree of soil profile development; factor B, texture of the surface layer; factor C, slope; and factor X, manageable features, including drainage, microrelief, fertility, acidity, erosion, and salt content. A score ranging from 0 to 100 percent is determined for each factor, and the scores are mukltiplied together to derive an index rating. For simplification, Storie Index ratings have been combined into six grades classes as follows: Grade 1 (excellent), 100 to 80; grade 2 (good), 79 to 60; grade 3 (fair), 59 to 40; grade 4 (poor), 39 to 20; grade 5 (very poor), 19 to 10; and grade 6 (nonagricultural), less than 10. Report California Revised Storie Index Rating (CA) The Storie Index is a soil rating based on soil properties that govern a soil map unit component's potential for cultivated agriculture. [Absence of an entry indicates that a Storie Index rating is not applicable or was not estimated]. For simplification, Storie Index ratings have been combined into six grades as follows: Grade 1 (Excellent): Soils that rate between 80 and 100 and which are suitable for a wide range of crops. Grade 2 (Good) Soils that rate between 60 and 79 and which are suitable for a wide range of crops. Grade 3 (Fair): Soils that range between 40 and 59. Soils in this grade may give good results with certain specialized crops. Grade 4 (Poor): Soils that rate between 20 and 39 and which have a narrow range in their agricultural potential. Grade 5 (Very Poor): Soil that rate between 10 and 19 and are of very limited agricultural use except for pasture because of adverse soil conditions. Grade 6 (Nonagricultural): Soils that rate less than 10. [The numbers in the "Limiting feature value" column range from 0.01 to Soils with a smaller the value have a lower potential for cultivated agriculture. The table shows each of the sub-factors used to generate the Storie Index rating for each soil component]. California Revised Storie Index Rating (CA) Imperial County, California, Imperial Valley Area Map symbol and soil name Pct. of map unit Storie index rating California Revised Storie Index (CA) Storie index grade and limiting features Limiting feature value 114 IMPERIAL SILTY CLAY, WET Imperial, wet Grade Three - Fair Rated Soil Order 1.00 Profile Group 1.00 Nearly level to gently sloping Wetness, flooding, ponding, drainage, erosion Toxicity 0.80 Natural Resources Conservation Service Web Soil Survey National Cooperative Soil Survey 12/20/2010 Page 1 of 2
20 California Revised Storie Index Rating (CA) Imperial County, California, Imperial Valley Area California Revised Storie Index Rating (CA) Imperial County, California, Imperial Valley Area Map symbol and soil name Pct. of map unit Storie index rating California Revised Storie Index (CA) Storie index grade and limiting features Limiting feature value 115 IMPERIAL-GLENBAR SILTY CLAY LOAMS, WET, 0 TO 2 PERCENT SLOPES Glenbar, wet Grade Two - Good Rated Soil Order 1.00 Profile Group 1.00 Nearly level to gently sloping 0.98 USDA Texture 0.95 Wetness, flooding, ponding, drainage, erosion 0.90 Imperial, wet Grade Two - Good Rated Soil Order 1.00 Profile Group 1.00 Nearly level to gently sloping 0.98 USDA Texture 0.95 Wetness, flooding, ponding, drainage, erosion 0.90 Data Source Information Soil Survey Area: Imperial County, California, Imperial Valley Area Survey Area Data: Version 5, Jul 25, 2008 Natural Resources Conservation Service Web Soil Survey National Cooperative Soil Survey 12/20/2010 Page 2 of 2
21 LESA ASSESSMENT MIDWAY SOLAR FARM I PROJECT AREA MIDWAY SOLAR FARM I PROJECT (NE/4 Section 31 (portion) and SE/4 Section 31, T11S, R14E, SBB&M) IMPERIAL COUNTY, CALIFORNIA December 2010 EMA Report No Prepared for: 83WI 8ME, LLC Santa Monica Boulevard, Suite 300 Los Angeles, California ENVIRONMENTAL MANAGEMENT ASSOCIATES
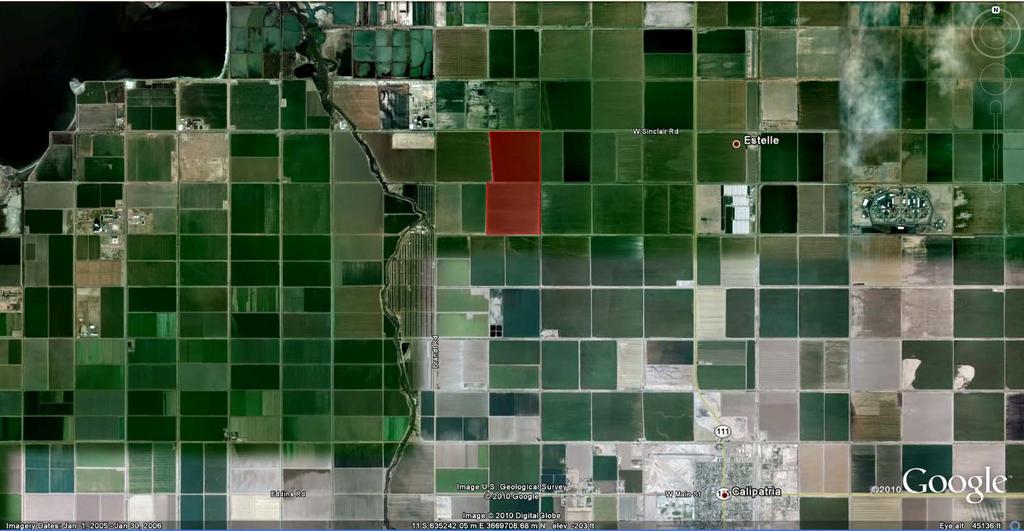
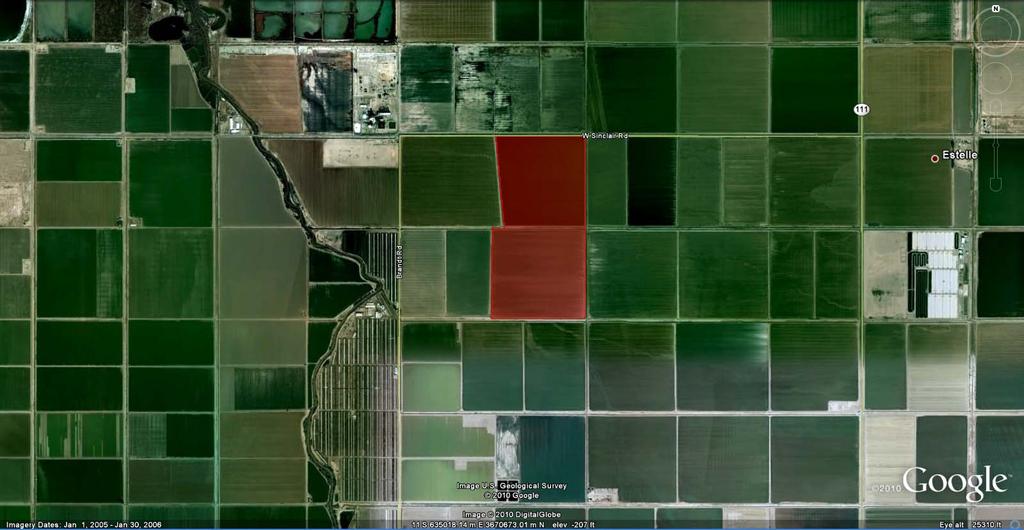
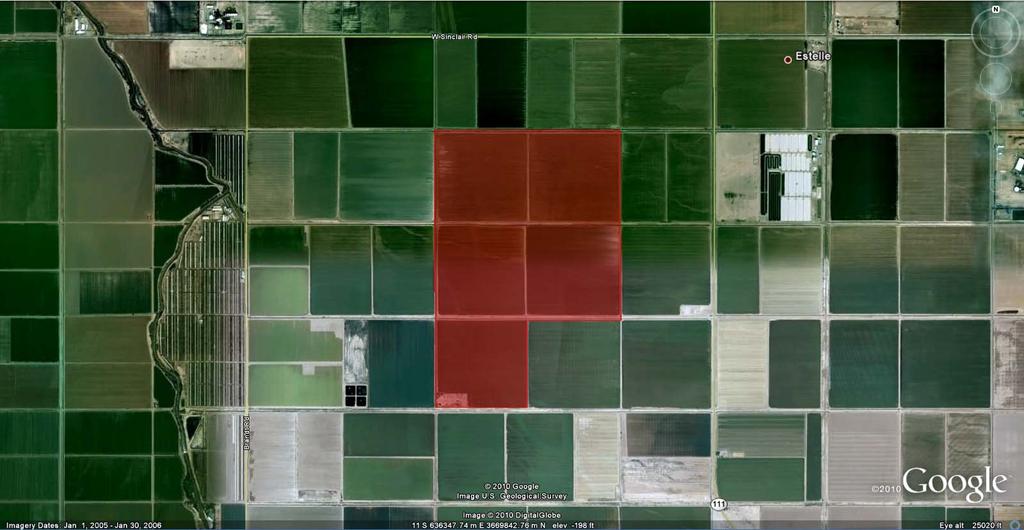
22 LAND EVALUATION AND SITE ASSESSMENT MODEL MIDWAY SOLAR FARM I PROJECT (NE/4 Section 31 (portion) and SE/4 Section 31, T11S, R14E, SBB&M) IMPERIAL COUNTY, CALIFORNIA The Land Evaluation and Site Assessment (LESA) model is an approach for rating the relative quality of land resources based upon specific measurable features. The LESA model was first developed by the federal Natural Resources Conservation Service (NRCS) in It was subsequently adapted in 1990 by the California Department of Conservation to evaluate land use decisions that affect the conversion of agriculture lands in California. The formulation of the California LESA Model is intended to provide lead agencies under the California Environmental Quality Act (CEQA) with an optional methodology to ensure that significant effects on the environment of agricultural land conversions are quantitatively and consistently considered in the environmental review process. For determining the potential CEQA significance resulting from the conversion of agricultural lands to some other purpose, the California Agricultural LESA Model has developed Scoring Thresholds which are used to compare the Final LESA Score and the Weighted Factor Scores for the Project with suggested Scoring Decisions. These LESA Scores do not take into consideration any proposed mitigation measures or other factors that might affect a lead agency s determination of the significance of the agricultural lands conversion impact under CEQA. The information provided on the following pages present documentation of the LESA assessment prepared using the California Agricultural LESA Model for the proposed Midway Solar Farm I Project (Project) (APN ). The proposed Project would be constructed on approximately 326 acres of privately owned land located about three and one half miles northwest of the city of Calipatria, California (Figure 1 and Figure 2). The Project is bounded on the north, east and south by Imperial County roads (West Sinclair, English and East Peterson Roads, respectively).
23 LESA ASSESSMENT 83WI 8ME LCC MIDWAY SOLAR FARM I PROJECT IMPERIAL COUNTY, NEVADA TABLE OF CONTENTS SUMMARY... i LIST OF FIGURES... ii LIST OF APPENDICES... ii 1. CALIFORNIA LAND EVALUATION AND SITE ASSESSMENT MODEL... 3 A LAND CAPABILITY CLASSIFICATION ( LCC )...3 B STORIE INDEX RATING...3 C PROJECT SIZE RATING...5 D WATER RESOURCES AVAILABILITY RATING...6 E SURROUNDING AGRICULTURAL LAND RATING...7 F SURROUNDING PROTECTED RESOURCE LAND RATING...7 G WEIGHTING OF FACTORS AND FINAL LESA SCORE...9 Page LIST OF FIGURES Figure 1: Location Map... 1 Figure 2: Project Area Map on an Aerial Photographic Base... 2 Figure 3: Project Area Soils Map... 4 Figure 4: Zone of Influence... 8 Page LIST OF APPENDICES APPENDIX A: MIDWAY SOLAR FARM I SOILS DETAILS
24
25
26 Land Evaluation Worksheet A B C D E F G H Soil Map Unit* Project Acres Proportion of LCC** LCC Rating LCC Score Storie Storie Index Project Area (irrigated) (irrigated)*** (C x E) Index** Score (C x G) IIIw IIIw Totals LCC Total Storie Index 60 Score Total Score 42 Total Project Area (acres)= 326 * The Soil Map Unit information and acreage were determined from the current soil survey information available at the USDA Natural Resources Conservation Service website: usda aspx (Figure 3). ** The Land Capability Classification and Storie Index information was obtained from the current soil survey information available at the USDA Natural Resources Conservation Service website: (Appendix A). *** The LCC Rating for irrigated land was determined from the LCC Point Rating Table 2 from the LESA Instruction Manual (California Department of Conservation 1997).


27 Adjusted to acres Rounded Percentages
28 Site Assessment Worksheet 1 Project Size Score* I J K LCC Class I-II LCC Class III LCC Class IV-VIII Project Acres per LCC Class Project Acres per LCC Class 3.26 Project Acres per LCC Class Project Acres per LCC Class Project Acres per LCC Class Total Project Acres per LCC Class * Project Size Scores Highest Project Size Score 100 * Project Size Score was determined from the Project Size Scoring Table from the LESA Instruction Manual (California Department of Conservation 1997).
29 A B C D E Project Portion Water Source Site Assessment Worksheet 2 Water Resources Availability Proportion of Project Area Water Availability Score* Weighted Availability Score (C x D) 1 Irrigation District Only Total Water (Must Sum to 1.0) 100 Resource Score * The Water Availability Score was determined using the Water Resources Availability Scoring Table from the LESA Instruction Manual (California Department of Conservation 1997).
30 Site Assessment Worksheet 3 Surrounding Agricultural Land & Surrounding Protected Resource Land A B C D E F G Zone of Influence* Surrounding Surrounding Total Acres Percent Agricultural Protected Acres of Percent in Protected Land Score Resource Land Acres in Protected Agriculture Resource (From LESA Score (From Agriculture Resource (B/A) Land Manual LESA Manual Land (C/A) Table 6) Table 7)** * In conformance with the instructions in the LESA Instruction Manual (California Department of Conservation 1997), the Zone of Influence was determined by drawing the smallest rectangle that could completely encompass the entire Project Area. A second rectangle was then drawn which extended one quarter mile on all sides beyond the first rectangle. The Zone of Influence is represented by the entire area of all parcels with any lands inside the outer rectangle, less the area of the proposed project (Figure 4). ** The LESA Instruction Manual (California Department of Conservation 1997) describes Protected Resource Land as those lands with long term use restrictions that are compatible with or supportive of agricultural uses of land. Included among them are the following: Williamson Act contracted lands; Publicly owned lands maintained as park, forest, or watershed resources; and Lands with agricultural, wildlife habitat, open space, or other natural resource easements that restrict the conversion of such land to urban or industrial uses. Surrounding Parcels*** Acres Protected Resource Land? Percent Protected Resource Land Acres in Protected Land Agricultural Land? Percent Agricultural Land Acres of Agriculture N 0 0 Y N 0 0 Y N 0 0 Y N 0 0 Y N 0 0 Y N 0 0 Y N 0 0 Y N 0 0 Y N 0 0 Y N 0 0 Y N 0 0 Y N 0 0 Y N 0 0 Y Total Total 0 Total 2267 **The Imperial County Assessors website was accessed to identify the surrounding parcel numbers ( The percentage of agriculture was determined from a map overlay used to estimate the proportion of land in agriculture and the California Department of Conservation Important Farmland Map Series.
31 Scale: 1"=2800 feet Title: Date: 12/20/2010 This map represents a visual display of related geographic information. Data provided hereon is not a guarantee of actual field conditions. To be sure of complete accuracy, please contact IMPERIALCOUNTY_PUBLIC staff for the most up-to-date information.
32 Final LESA Score Sheet Factor Scores Factor Weight Weighted Factor Scores LE Factors Land Capability Classification Storie Index LE subtotal SA Factors Project Size Water Resource Availability Surrounding Agricultural Land Protected Resource Land SA Subtotal Total LESA Score Total LESA Score 0 to 39 Points 40 to 59 Points 60 to 79 Points California LESA Model Scoring Thresholds Not Considered Significant to 100 Points Considered Significant Scoring Decision Considered Significant only if LE and SA subscores are each greater than or equal to 20 points Considered Significant unless either LE or SA subscore is less than 20 points
33 APPENDIX A: MIDWAY SOLAR FARM I SOILS DETAILS
34 Map Unit Description: IMPERIAL-GLENBAR SILTY CLAY LOAMS, WET, 0 TO 2 PERCENT SLOPES Imperial County, California, Imperial Valley Area Imperial County, California, Imperial Valley Area 115 IMPERIAL-GLENBAR SILTY CLAY LOAMS, WET, 0 TO 2 PERCENT SLOPES Map Unit Setting Elevation: -230 to 200 feet Mean annual precipitation: 0 to 3 inches Mean annual air temperature: 72 to 75 degrees F Frost-free period: 300 to 350 days Map Unit Composition Glenbar, wet, and similar soils: 40 percent Imperial, wet, and similar soils: 40 percent Minor components: 20 percent Description of Imperial, Wet Setting Landform: Basin floors Landform position (three-dimensional): Talf Down-slope shape: Linear Across-slope shape: Linear Parent material: Clayey alluvium derived from mixed sources and/or clayey lacustrine deposits derived from mixed sources Properties and qualities Slope: 0 to 2 percent Depth to restrictive feature: More than 80 inches Drainage class: Moderately well drained Capacity of the most limiting layer to transmit water (Ksat): Moderately high (0.20 to 0.57 in/hr) Depth to water table: More than 80 inches Frequency of flooding: None Frequency of ponding: None Calcium carbonate, maximum content: 5 percent Maximum salinity: Very slightly saline to slightly saline (4.0 to 8.0 mmhos/cm) Sodium adsorption ratio, maximum: 20.0 Available water capacity: Moderate (about 8.6 inches) Interpretive groups Land capability classification (irrigated): 3w Land capability (nonirrigated): 7w Typical profile 0 to 12 inches: Silty clay loam 12 to 60 inches: Silty clay loam Description of Glenbar, Wet Setting Landform: Basin floors Landform position (three-dimensional): Talf Natural Resources Conservation Service Web Soil Survey National Cooperative Soil Survey 11/12/2010 Page 1 of 2
35 Map Unit Description: IMPERIAL-GLENBAR SILTY CLAY LOAMS, WET, 0 TO 2 PERCENT SLOPES Imperial County, California, Imperial Valley Area Down-slope shape: Linear Across-slope shape: Linear Parent material: Alluvium derived from mixed Properties and qualities Slope: 0 to 2 percent Depth to restrictive feature: More than 80 inches Drainage class: Moderately well drained Capacity of the most limiting layer to transmit water (Ksat): Moderately high (0.20 to 0.57 in/hr) Depth to water table: More than 80 inches Frequency of flooding: None Frequency of ponding: None Calcium carbonate, maximum content: 5 percent Maximum salinity: Nonsaline to slightly saline (2.0 to 8.0 mmhos/cm) Sodium adsorption ratio, maximum: 15.0 Available water capacity: High (about 10.8 inches) Interpretive groups Land capability classification (irrigated): 3w Land capability (nonirrigated): 7w Typical profile 0 to 13 inches: Silty clay loam 13 to 60 inches: Clay loam Minor Components Holtville Percent of map unit: 10 percent Meloland Percent of map unit: 10 percent Data Source Information Soil Survey Area: Imperial County, California, Imperial Valley Area Survey Area Data: Version 5, Jul 25, 2008 Natural Resources Conservation Service Web Soil Survey National Cooperative Soil Survey 11/12/2010 Page 2 of 2
36 Map Unit Description: IMPERIAL SILTY CLAY, WET Imperial County, California, Imperial Valley Area Imperial County, California, Imperial Valley Area 114 IMPERIAL SILTY CLAY, WET Map Unit Setting Elevation: -230 to 200 feet Mean annual precipitation: 0 to 3 inches Mean annual air temperature: 72 to 75 degrees F Frost-free period: 300 to 350 days Map Unit Composition Imperial, wet, and similar soils: 85 percent Minor components: 15 percent Description of Imperial, Wet Setting Landform: Basin floors Landform position (three-dimensional): Talf Down-slope shape: Linear Across-slope shape: Linear Parent material: Clayey alluvium derived from mixed sources and/or clayey lacustrine deposits derived from mixed sources Properties and qualities Slope: 0 to 2 percent Depth to restrictive feature: More than 80 inches Drainage class: Moderately well drained Capacity of the most limiting layer to transmit water (Ksat): Moderately low to moderately high (0.06 to 0.20 in/hr) Depth to water table: More than 80 inches Frequency of flooding: None Frequency of ponding: None Calcium carbonate, maximum content: 5 percent Maximum salinity: Very slightly saline to slightly saline (4.0 to 8.0 mmhos/cm) Sodium adsorption ratio, maximum: 20.0 Available water capacity: Moderate (about 8.3 inches) Interpretive groups Land capability classification (irrigated): 3w Land capability (nonirrigated): 7w Typical profile 0 to 12 inches: Silty clay 12 to 60 inches: Silty clay loam Minor Components Glenbar Percent of map unit: 4 percent Meloland Percent of map unit: 4 percent Natural Resources Conservation Service Web Soil Survey National Cooperative Soil Survey 11/12/2010 Page 1 of 2
37 Map Unit Description: IMPERIAL SILTY CLAY, WET Imperial County, California, Imperial Valley Area Holtville Percent of map unit: 4 percent Niland Percent of map unit: 3 percent Data Source Information Soil Survey Area: Imperial County, California, Imperial Valley Area Survey Area Data: Version 5, Jul 25, 2008 Natural Resources Conservation Service Web Soil Survey National Cooperative Soil Survey 11/12/2010 Page 2 of 2
38 California Revised Storie Index Rating (CA) Imperial County, California, Imperial Valley Area California Revised Storie Index Rating (CA) The Storie Index is a soil rating based on soil properties that govern a soil's potential for cultivated agriculture in California. The Storie Index asseses the productivity of a soil from the following four characteristics: Factor A, degree of soil profile development; factor B, texture of the surface layer; factor C, slope; and factor X, manageable features, including drainage, microrelief, fertility, acidity, erosion, and salt content. A score ranging from 0 to 100 percent is determined for each factor, and the scores are mukltiplied together to derive an index rating. For simplification, Storie Index ratings have been combined into six grades classes as follows: Grade 1 (excellent), 100 to 80; grade 2 (good), 79 to 60; grade 3 (fair), 59 to 40; grade 4 (poor), 39 to 20; grade 5 (very poor), 19 to 10; and grade 6 (nonagricultural), less than 10. Report California Revised Storie Index Rating (CA) The Storie Index is a soil rating based on soil properties that govern a soil map unit component's potential for cultivated agriculture. [Absence of an entry indicates that a Storie Index rating is not applicable or was not estimated]. For simplification, Storie Index ratings have been combined into six grades as follows: Grade 1 (Excellent): Soils that rate between 80 and 100 and which are suitable for a wide range of crops. Grade 2 (Good) Soils that rate between 60 and 79 and which are suitable for a wide range of crops. Grade 3 (Fair): Soils that range between 40 and 59. Soils in this grade may give good results with certain specialized crops. Grade 4 (Poor): Soils that rate between 20 and 39 and which have a narrow range in their agricultural potential. Grade 5 (Very Poor): Soil that rate between 10 and 19 and are of very limited agricultural use except for pasture because of adverse soil conditions. Grade 6 (Nonagricultural): Soils that rate less than 10. [The numbers in the "Limiting feature value" column range from 0.01 to Soils with a smaller the value have a lower potential for cultivated agriculture. The table shows each of the sub-factors used to generate the Storie Index rating for each soil component]. California Revised Storie Index Rating (CA) Imperial County, California, Imperial Valley Area Map symbol and soil name Pct. of map unit Storie index rating California Revised Storie Index (CA) Storie index grade and limiting features Limiting feature value 114 IMPERIAL SILTY CLAY, WET Imperial, wet Grade Three - Fair Rated Soil Order 1.00 Profile Group 1.00 Nearly level to gently sloping Wetness, flooding, ponding, drainage, erosion Toxicity 0.80 Natural Resources Conservation Service Web Soil Survey National Cooperative Soil Survey 12/20/2010 Page 1 of 2
39 California Revised Storie Index Rating (CA) Imperial County, California, Imperial Valley Area California Revised Storie Index Rating (CA) Imperial County, California, Imperial Valley Area Map symbol and soil name Pct. of map unit Storie index rating California Revised Storie Index (CA) Storie index grade and limiting features Limiting feature value 115 IMPERIAL-GLENBAR SILTY CLAY LOAMS, WET, 0 TO 2 PERCENT SLOPES Glenbar, wet Grade Two - Good Rated Soil Order 1.00 Profile Group 1.00 Nearly level to gently sloping 0.98 USDA Texture 0.95 Wetness, flooding, ponding, drainage, erosion 0.90 Imperial, wet Grade Two - Good Rated Soil Order 1.00 Profile Group 1.00 Nearly level to gently sloping 0.98 USDA Texture 0.95 Wetness, flooding, ponding, drainage, erosion 0.90 Data Source Information Soil Survey Area: Imperial County, California, Imperial Valley Area Survey Area Data: Version 5, Jul 25, 2008 Natural Resources Conservation Service Web Soil Survey National Cooperative Soil Survey 12/20/2010 Page 2 of 2
40 LESA ASSESSMENT MIDWAY SOLAR FARM II PROJECT AREA MIDWAY SOLAR FARM II PROJECT (S/2 Section 32, T11S, R14E, SBB&M; N/2 Section 5 and SW/4 Section 5, T12S, R14E, SBB&M) IMPERIAL COUNTY, CALIFORNIA December 2010 EMA Report No Prepared for: 97WI 8ME, LLC Santa Monica Boulevard, Suite 300 Los Angeles, California ENVIRONMENTAL MANAGEMENT ASSOCIATES
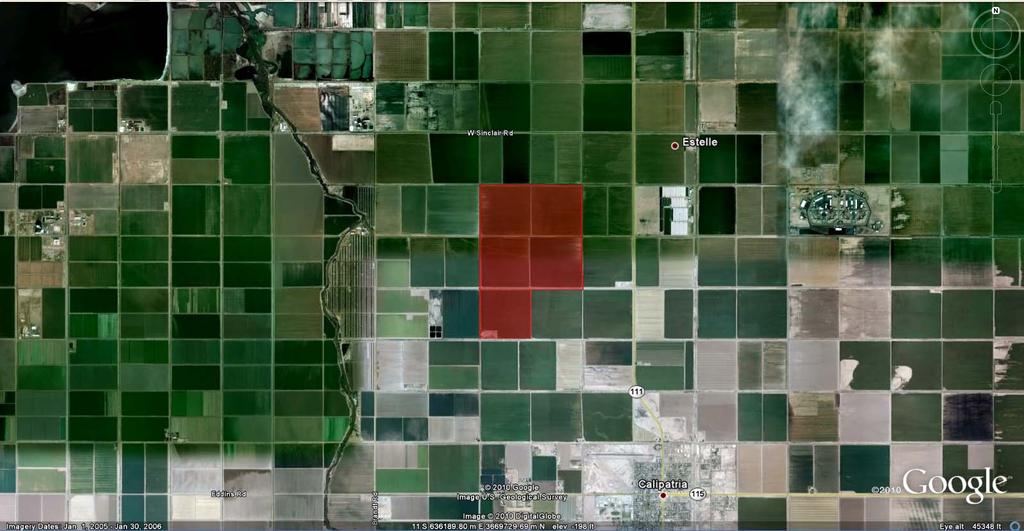
41 LAND EVALUATION AND SITE ASSESSMENT MODEL MIDWAY SOLAR FARM II PROJECT (S/2 Section 32, T11S, R14E, SBB&M; N/2 Section 5 and SW/4 Section 5, T12S, R14E, SBB&M) IMPERIAL COUNTY, CALIFORNIA The Land Evaluation and Site Assessment (LESA) model is an approach for rating the relative quality of land resources based upon specific measurable features. The LESA model was first developed by the federal Natural Resources Conservation Service (NRCS) in It was subsequently adapted in 1990 by the California Department of Conservation to evaluate land use decisions that affect the conversion of agriculture lands in California. The formulation of the California LESA Model is intended to provide lead agencies under the California Environmental Quality Act (CEQA) with an optional methodology to ensure that significant effects on the environment of agricultural land conversions are quantitatively and consistently considered in the environmental review process. For determining the potential CEQA significance resulting from the conversion of agricultural lands to some other purpose, the California Agricultural LESA Model has developed Scoring Thresholds which are used to compare the Final LESA Score and the Weighted Factor Scores for the Project with suggested Scoring Decisions. These LESA Scores do not take into consideration any proposed mitigation measures or other factors that might affect a lead agency s determination of the significance of the agricultural lands conversion impact under CEQA. The information provided on the following pages present documentation of the LESA assessment prepared using the California Agricultural LESA Model for the proposed Midway Solar Farm II Project (Project) (APN and ). The proposed Project would be constructed on approximately 803 acres of privately owned land located about three miles northwest of the city of Calipatria, California (Figure 1 and Figure 2). The Project is bounded on the north, west and south by Imperial County roads (West Hoober, English and Lindsey Roads, respectively).
42 LESA ASSESSMENT 97WI 8ME LCC MIDWAY SOLAR FARM II PROJECT IMPERIAL COUNTY, NEVADA TABLE OF CONTENTS SUMMARY... i LIST OF FIGURES... ii LIST OF APPENDICES... ii 1. CALIFORNIA LAND EVALUATION AND SITE ASSESSMENT MODEL... 3 A LAND CAPABILITY CLASSIFICATION ( LCC )...3 B STORIE INDEX RATING...3 C PROJECT SIZE RATING...5 D WATER RESOURCES AVAILABILITY RATING...6 E SURROUNDING AGRICULTURAL LAND RATING...7 F SURROUNDING PROTECTED RESOURCE LAND RATING...7 G WEIGHTING OF FACTORS AND FINAL LESA SCORE...9 Page LIST OF FIGURES Figure 1: Location Map... 1 Figure 2: Project Area Map on an Aerial Photographic Base... 2 Figure 3: Project Area Soils Map... 4 Figure 4: Zone of Influence... 8 Page LIST OF APPENDICES APPENDIX A: MIDWAY SOLAR FARM II SOILS DETAILS
43
44
45 Land Evaluation Worksheet A B C D E F G H Soil Map Unit* Project Acres Proportion of LCC** LCC Rating LCC Score Storie Storie Index Project Area (irrigated) (irrigated)*** (C x E) Index** Score (C x G) IIIw IIIw IIIw Totals LCC Total Storie Index 60 Score Total Score 42 Total Project Area (acres)= 803 * The Soil Map Unit information and acreage were determined from the current soil survey information available at the USDA Natural Resources Conservation Service website: (Figure 3). ** The Land Capability Classification and Storie Index information was obtained from the current soil survey information available at the USDA Natural Resources Conservation Service website: (Appendix A). *** The LCC Rating for irrigated land was determined from the LCC Point Rating Table 2 from the LESA Instruction Manual (California Department of Conservation 1997).


46 Adjusted to acres Rounded Percentages
47 Site Assessment Worksheet 1 Project Size Score* I J K LCC Class I-II LCC Class III LCC Class IV-VIII Project Acres per LCC Class Project Acres per LCC Class 8.03 Project Acres per LCC Class 8.03 Project Acres per LCC Class Project Acres per LCC Class Total Project Acres per LCC Class * Project Size Scores Highest Project Size Score 100 * Project Size Score was determined from the Project Size Scoring Table from the LESA Instruction Manual (California Department of Conservation 1997).
48 A B C D E Project Portion Water Source Site Assessment Worksheet 2 Water Resources Availability Proportion of Project Area Water Availability Score* Weighted Availability Score (C x D) 1 Irrigation District Only Total Water (Must Sum to 1.0) 100 Resource Score * The Water Availability Score was determined using the Water Resources Availability Scoring Table from the LESA Instruction Manual (California Department of Conservation 1997).
49 Site Assessment Worksheet 3 Surrounding Agricultural Land & Surrounding Protected Resource Land A B C D E F G Zone of Influence* Surrounding Surrounding Percent Agricultural Protected Acres of Percent in Protected Land Score Resource Land Acres in Protected Total Acres Agriculture Resource (From LESA Score (From Agriculture Resource (B/A) Land Manual LESA Manual Land (C/A) Table 6) Table 7)** * In conformance with the instructions in the LESA Instruction Manual (California Department of Conservation 1997), the Zone of Influence was determined by drawing the smallest rectangle that could completely encompass the entire Project Area. A second rectangle was then drawn which extended one quarter mile on all sides beyond the first rectangle. The Zone of Influence is represented by the entire area of all parcels with any lands inside the outer rectangle, less the area of the proposed project (Figure 4). ** The LESA Instruction Manual (California Department of Conservation 1997) describes Protected Resource Land as those lands with long term use restrictions that are compatible with or supportive of agricultural uses of land. Included among them are the following: Williamson Act contracted lands; Publicly owned lands maintained as park, forest, or watershed resources; and Lands with agricultural, wildlife habitat, open space, or other natural resource easements that restrict the conversion of such land to urban or industrial uses. Surrounding Parcels*** Acres Protected Resource Land? Percent Protected Resource Land Acres in Protected Land Agricultural Land? Percent Agricultural Land Acres of Agriculture N 0 0 Y N 0 0 Y N 0 0 Y N 0 0 Y N 0 0 Y N 0 0 Y N 0 0 Y N 0 0 Y N 0 0 Y N 0 0 Y N 0 0 Y N 0 0 Y N 0 0 Y N 0 0 Y N 0 0 Y N 0 0 Y N 0 0 Y N 0 0 Y Total Total 0 Total 2587 **The Imperial County Assessors website was accessed to identify the surrounding parcel numbers ( The percentage of agriculture was determined from a map overlay used to estimate the proportion of land in agriculture and the California Department of Conservation Important Farmland Map Series.
50 Scale: 1"=2600 feet Title: Date: 12/21/2010 This map represents a visual display of related geographic information. Data provided hereon is not a guarantee of actual field conditions. To be sure of complete accuracy, please contact IMPERIALCOUNTY_PUBLIC staff for the most up-to-date information.
51 Final LESA Score Sheet Factor Scores Factor Weight Weighted Factor Scores LE Factors Land Capability Classification Storie Index LE subtotal SA Factors Project Size Water Resource Availability Surrounding Agricultural Land Protected Resource Land SA Subtotal Total LESA Score Total LESA Score 0 to 39 Points 40 to 59 Points 60 to 79 Points California LESA Model Scoring Thresholds Not Considered Significant to 100 Points Considered Significant Scoring Decision Considered Significant only if LE and SA subscores are each greater than or equal to 20 points Considered Significant unless either LE or SA subscore is less than 20 points
52 APPENDIX A: MIDWAY SOLAR FARM II SOILS DETAILS
53 Map Unit Description: IMPERIAL SILTY CLAY, WET Imperial County, California, Imperial Valley Area Imperial County, California, Imperial Valley Area 114 IMPERIAL SILTY CLAY, WET Map Unit Setting Elevation: -230 to 200 feet Mean annual precipitation: 0 to 3 inches Mean annual air temperature: 72 to 75 degrees F Frost-free period: 300 to 350 days Map Unit Composition Imperial, wet, and similar soils: 85 percent Minor components: 15 percent Description of Imperial, Wet Setting Landform: Basin floors Landform position (three-dimensional): Talf Down-slope shape: Linear Across-slope shape: Linear Parent material: Clayey alluvium derived from mixed sources and/or clayey lacustrine deposits derived from mixed sources Properties and qualities Slope: 0 to 2 percent Depth to restrictive feature: More than 80 inches Drainage class: Moderately well drained Capacity of the most limiting layer to transmit water (Ksat): Moderately low to moderately high (0.06 to 0.20 in/hr) Depth to water table: More than 80 inches Frequency of flooding: None Frequency of ponding: None Calcium carbonate, maximum content: 5 percent Maximum salinity: Very slightly saline to slightly saline (4.0 to 8.0 mmhos/cm) Sodium adsorption ratio, maximum: 20.0 Available water capacity: Moderate (about 8.3 inches) Interpretive groups Land capability classification (irrigated): 3w Land capability (nonirrigated): 7w Typical profile 0 to 12 inches: Silty clay 12 to 60 inches: Silty clay loam Minor Components Glenbar Percent of map unit: 4 percent Meloland Percent of map unit: 4 percent Natural Resources Conservation Service Web Soil Survey National Cooperative Soil Survey 11/12/2010 Page 1 of 2
54 Map Unit Description: IMPERIAL SILTY CLAY, WET Imperial County, California, Imperial Valley Area Holtville Percent of map unit: 4 percent Niland Percent of map unit: 3 percent Data Source Information Soil Survey Area: Imperial County, California, Imperial Valley Area Survey Area Data: Version 5, Jul 25, 2008 Natural Resources Conservation Service Web Soil Survey National Cooperative Soil Survey 11/12/2010 Page 2 of 2
55 Map Unit Description: IMPERIAL-GLENBAR SILTY CLAY LOAMS, WET, 0 TO 2 PERCENT SLOPES Imperial County, California, Imperial Valley Area Imperial County, California, Imperial Valley Area 115 IMPERIAL-GLENBAR SILTY CLAY LOAMS, WET, 0 TO 2 PERCENT SLOPES Map Unit Setting Elevation: -230 to 200 feet Mean annual precipitation: 0 to 3 inches Mean annual air temperature: 72 to 75 degrees F Frost-free period: 300 to 350 days Map Unit Composition Glenbar, wet, and similar soils: 40 percent Imperial, wet, and similar soils: 40 percent Minor components: 20 percent Description of Imperial, Wet Setting Landform: Basin floors Landform position (three-dimensional): Talf Down-slope shape: Linear Across-slope shape: Linear Parent material: Clayey alluvium derived from mixed sources and/or clayey lacustrine deposits derived from mixed sources Properties and qualities Slope: 0 to 2 percent Depth to restrictive feature: More than 80 inches Drainage class: Moderately well drained Capacity of the most limiting layer to transmit water (Ksat): Moderately high (0.20 to 0.57 in/hr) Depth to water table: More than 80 inches Frequency of flooding: None Frequency of ponding: None Calcium carbonate, maximum content: 5 percent Maximum salinity: Very slightly saline to slightly saline (4.0 to 8.0 mmhos/cm) Sodium adsorption ratio, maximum: 20.0 Available water capacity: Moderate (about 8.6 inches) Interpretive groups Land capability classification (irrigated): 3w Land capability (nonirrigated): 7w Typical profile 0 to 12 inches: Silty clay loam 12 to 60 inches: Silty clay loam Description of Glenbar, Wet Setting Landform: Basin floors Landform position (three-dimensional): Talf Natural Resources Conservation Service Web Soil Survey National Cooperative Soil Survey 11/12/2010 Page 1 of 2
56 Map Unit Description: IMPERIAL-GLENBAR SILTY CLAY LOAMS, WET, 0 TO 2 PERCENT SLOPES Imperial County, California, Imperial Valley Area Down-slope shape: Linear Across-slope shape: Linear Parent material: Alluvium derived from mixed Properties and qualities Slope: 0 to 2 percent Depth to restrictive feature: More than 80 inches Drainage class: Moderately well drained Capacity of the most limiting layer to transmit water (Ksat): Moderately high (0.20 to 0.57 in/hr) Depth to water table: More than 80 inches Frequency of flooding: None Frequency of ponding: None Calcium carbonate, maximum content: 5 percent Maximum salinity: Nonsaline to slightly saline (2.0 to 8.0 mmhos/cm) Sodium adsorption ratio, maximum: 15.0 Available water capacity: High (about 10.8 inches) Interpretive groups Land capability classification (irrigated): 3w Land capability (nonirrigated): 7w Typical profile 0 to 13 inches: Silty clay loam 13 to 60 inches: Clay loam Minor Components Holtville Percent of map unit: 10 percent Meloland Percent of map unit: 10 percent Data Source Information Soil Survey Area: Imperial County, California, Imperial Valley Area Survey Area Data: Version 5, Jul 25, 2008 Natural Resources Conservation Service Web Soil Survey National Cooperative Soil Survey 11/12/2010 Page 2 of 2