SHERPA and SHERPA-city: screening tools for air quality modelling in Europe
|
|
|
- Ross Boone
- 5 years ago
- Views:
Transcription

1 SHERPA and SHERPA-city: screening tools for air quality modelling in Europe B. Degraeuwe, E. Peduzzi, E. Pisoni, P. Thunis The European Commission s science and knowledge service Joint Research Centre


2 The Joint Research Centre at a glance 3000 staff Almost 75% are scientists and researchers. Headquarters in Brussels and research facilities located in 5 Member States. 2
3 FASST, SHERPA and SHERPA city The 3 models covering different scales: FASST: global scale (international organizations) SHERPA: EU urban background concentration (local authorities) SHERPA-city: traffic stations (city managers) 3

4 The European Commission s science and knowledge service Joint Research Centre SHERPA: modelling urban background concentrations in EU 4


5 Beijing Paris Milan EU directive (25 μg/m3) WHO guideline (10 μg/m3) 5
 Source: EEA Need for a tool to support local and regional authorities in")
6 Urban air quality remains an issue in Europe PM Premature deaths (EU28) Source: EEA Need for a tool to support local and regional authorities in designing and assessing the impact of AQ plans 6 6
7 Need for SHERPA As a local Authority, can I do something to abate air pollution in my city/region? To which level? NO YES With whom should I collaborate? Which sector? Which pollutant is priority? Design and assessment of my air quality plan 7


8 The SHERPA screening tool AQ model Simplified model (SHERPA) 8
9 Source receptor relationships (I) Grid-to-grid SRR?? Unknowns = N grid = 23 Nb scenarios = 23 C/ E N grid C j E i 1 ij i 9 Distance

10 Source receptor relationships (II) Country-to-grid SRR C/ E Sea Germany Czech R France Poland Unknowns = N country = 6 Ukraine Unknowns = N count = 6 Nb scenarios = 6 N count C j E i 1 ij i 10 Distance
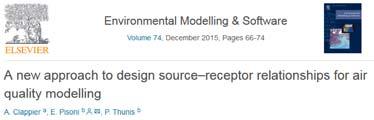
![Source receptor relationships (III) SHERPA grid-to-grid SRR Unknowns = [σ,ω] = 2](/docs-images/93/113261803/images/11-3.jpg "Nb scenarios = 2 C/ E ω σ C j N grid i 1 1 d j ij j E i Unknowns = 2 11 Distance")
11 Source receptor relationships (III) SHERPA grid-to-grid SRR Unknowns = [σ,ω] = 2 Nb scenarios = 2 C/ E ω σ C j N grid i 1 1 d j ij j E i Unknowns = 2 11 Distance


12 SHERPA training & validation SRR identification SRR validation 12

13 13 SHERPA validation


14 5 % Input Output CTM 14 SHERPA


15 Supporting regional and local air quality planning London Agriculture With whom to coordinate? What can I control 15

: city and commuting zone, containing the surrounding")

16 SHERPA application in EU cities Definition of a city (OECD EU) City: local administrative unit where the majority of the population lives in an urban centre of at least inhabitants Functional urban area (FUA): city and commuting zone, containing the surrounding travel-towork areas of a city where at least 15% of employed residents are working in the city. Antwerp Berlin Paris 0.5 -> > >
 PM 2.")
17 SHERPA output: an example in Paris Sectoral allocation Total Agri Industry Residential Traffic Paris city Paris FUA France EU Spatial allocation Mass percentage (%) PM 2.5 annual average concentration in Paris 17


18 SHERPA application in EU cities London Bruxelles Stockholm Paris Berlin Madrid Milan Vienna 18

19 19

20 20

21 21

22 22
23 23 Link with the CoM
24 The SHERPA screening tool Sherpa mimics the behavior of a CTM for emission scenarios over any given geographical area and activity sector with an accuracy of 5 to 10%. SHERPA SHERPA can be configured with any CTM but the quality of the results obviously depends on the chosen CTM. o Domain: Europe o Meteorology: ECMWF 2012 o AQ model: CHIMERE o Emissions: EC4MACS o Resolution: 7km o Domain: Europe o Meteorology: ECMWF 2014 o AQ model: EMEP o Emissions: JRC o Resolution: 10km o Urban & rural background o Yearly PM 2.5, PM 10, NO 2 o Urban & rural background o Yearly/Seasonal PM 2.5, PM 10, NO 2, O 3 24
25 Conclusions SHERPA can be used to evaluate the effect of local policies on background air quality. It mostly serves as a screening tool. Interesting tool to foster discussion about quality assurance of modelling approaches and quality of input data (emissions) -> FAIRMODE SHERPA covers the entire EU at 7km resolution with default data (CHIMERE based) but it can be fed by other AQ model /emissions. It currently works for yearly averaged PM 10, PM 2.5 and NO 2 concentrations. The approach is not valid for episodes. SHERPA is freely available at 25
26 The European Commission s science and knowledge service Joint Research Centre SHERPA-city: Impact of traffic measures on urban air quality 26

27 Background Especially in cities the annual average NO 2 concentration exceeds the EU limit value and WHO guideline. 27


28 NO2 is a local problem An analysis with SHERPA shows that the street and urban contributions are dominant the urban areas can solve their NO 2 problem
, typically")


29 What can cities do? Introduction of a low emission zone (LEZ), typically a ban for older diesels and trucks. Stuttgart will ban all pre Euro 6 diesels in 2018 Reduce the amount of traffic with a tax. Congestion charge in London Area C in Milan Promote a modal shift to public transport, walking and cycling. bike streets, where cyclists have priority over cars But how to design these measures and assess their effectiveness? 29 29
 to the concentration. 3.")
30 Urban Air Quality Modelling The classical model chain: 1. A chemical transport model gives the background concentration, i.e. the pollution coming from outside the city. 2. A Gaussian dispersion model gives the contribution of the local sources (roads) to the concentration. 3. A street canyon model gives the concentration increment due to pollution trapped in narrow busy roads
 Big cities can afford doing such studies, smaller ones lack the means.")
31 Urban Air Quality Modelling Advantages: Precise Hourly concentrations for a whole year High pollutions episodes are modelled Inconveniences: Long computation times Expensive Difficult to analyse many scenario's Large amount of data needed (traffic, weather, ) Big cities can afford doing such studies, smaller ones lack the means. There is a need for a simple modelling to assess the impact of traffic measures on urban air quality


32 The SHERPA-city approach A webtool accessible to everyone (under development) To improve user friendliness: Selection of the study area on a map A default road network with traffic flows is provided Predefined vehicle fleets per country: Current and future fleets Typical LEZ fleets: e.g. no heavy duty vehicles, no pre Euro 4 diesels Fast calculation of concentrations with a kernel approach

33 From urban background to the street Air Quality Model simulations IFDM / OSPM Impacts Simplified relation between emissions and concentration,,, Yearly averaged NO 2 concentrations at meters resolution Street network Traffic fleet Highway intensity Emission factors OpenStreetmap Tremove Transtools Copert & PEMS 33 33
 Roadnetwork based on OpenStreetMap Traffic flows assigned with Omnitrans, a macroscopic traffic model, on motorways, 1 st, 2 nd and 3 rd class roads.")
34 Default traffic data Data from OpenTransportMaps are used (hiip://opentransportmap.info/) Roadnetwork based on OpenStreetMap Traffic flows assigned with Omnitrans, a macroscopic traffic model, on motorways, 1 st, 2 nd and 3 rd class roads. No traffic on 4 th class roads (grey on map) Vehicle kilometres are underestimated compared to other sources (TREMOVE, TRACCS) traffic has to be scaled to the national totals. Den Haag (NL) road classes with traffic volume Den Haag (NL) coloring by traffic volume 34 34


35 Kernel method For policy makers the annual average concentration is of more interest than the hourly concentration. We calculate the annual average concentration around a unit source. This concentration depends on the local weather (wind speed, direction, temperature) Wind rose and kernel for Marseille, FR 35 35
 36")
36 Kernel method Dispersion kernels are calculated in advance for the whole of Europe Low concentrations and uniform kernels in windy coastal areas High concentration and high variability in mountainous areas Maximum concentration of dispersion kernels over Europe for the same unit emission (1 kg/h) 36 36
37 Kernel method The annual average concentration for a scenario is calculated by summing the kernels scaled with the magnitude of the emissions in each grid cell Calculation time for a 5 by 5 km area at 20 m resolution is in the order of minutes. The user can easily calculate the contribution of each measure and compose an air quality action plan tailored for his/her city


38 An example Low emission zone in the city centre Dispersion kernel applied on emission to obtain concentrations Emissions without LEZ Local contribution to the concentrations without LEZ 38 38

39 An example Low emission zone in the city centre Dispersion kernel applied on emission to obtain concentrations Emissions with LEZ Local contribution to the concentrations with LEZ 39 39
40 Conclusions SHERPA city can be used to test traffic scenarios effect on air quality It works at 20m resolution, through a kernel approach approximating full models It is going to be ready soon for EU can be adapted to other domains 40 40
41 Stay in touch EU Science Hub: ec.europa.eu/jrc Facebook: EU Science Hub - Joint Research Centre LinkedIn: Joint Research Centre YouTube: EU Science Hub 41