Foundations in Microbiology Seventh Edition
|
|
|
- Buck Horton
- 5 years ago
- Views:
Transcription

1 Lecture PowerPoint to accompany Foundations in Microbiology Seventh Edition Talaro Chapter 26 Environmental Microbiology Copyright The McGraw-Hill Companies, Inc. Permission required for reproduction or display.
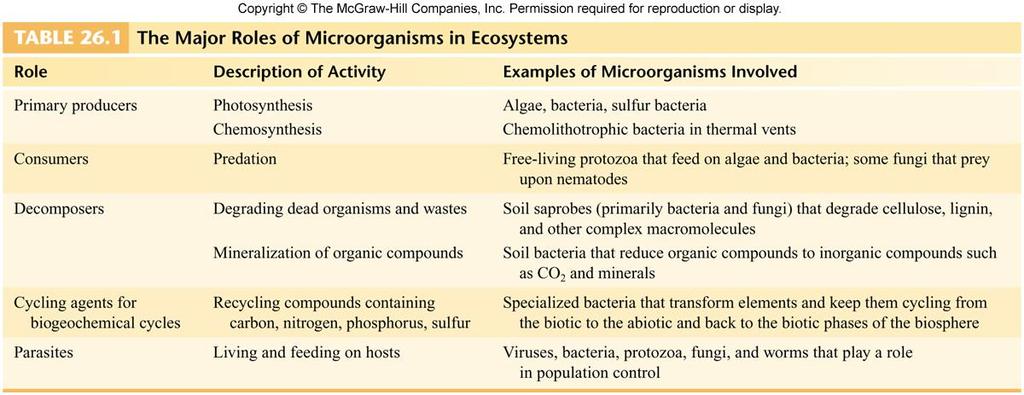
2 26.1 Ecology: The Interconnecting Web of Life Microbial ecology microbes in their natural habitats Applied microbiology study of practical uses of microbes in food processing, industrial production, and biotechnology Biotic any living or dead organisms that occupy an organism s habitat Abiotic nonliving components Ecosystem collection of organisms and the surrounding physical and chemical factors 2
3 Organization of Ecosystems Biosphere thin envelope of life that surrounds the earth s surface Made up of: Hydrosphere (water) Lithosphere (soil) Atmosphere (air) Maintains and creates the conditions of temperature, light, gases, moisture, and minerals required for life processes Biomes particular climatic regions 3
4 Communities the association of organisms that live together and that exhibit well-defined nutritional or behavioral interrelationships Population a group of organisms of the same kind Habitat the physical location in the environment to which an organism has adapted Niche overall role that a species, or population, serves in a community; nutritional intake, position in the community, and rate of population growth 4

5 Figure 26.1 Levels of organization 5
6 Energy and Nutritional Flow in Ecosystems Food chain or energy pyramid summarizes the feeding levels: Producers Consumers Autotrophs Decomposers Mineralization Bioremediation Consortium 6
7 7

8 Figure 26.2 Trophic and energy pyramid Insert figure 26.3 Trophic and energy pyramid Microorganisms are the only living beings at all three levels 8
9 Figure 26.3 Food chain 9
10 Food Web: feeding relationships in communities Energy does not cycle As energy is transferred to the next level, a large proportion of the energy will be lost that cannot be utilized in the system Feeding relationships are represented by a food web which represents the actual nutritional structure of a community 10
11 Figure 26.4 Food web 11
12 Ecological Interactions Between Organisms in a Community Dynamic interrelationships based on nutrition and shared habitat Mutualism beneficial to both members Commensalism one member benefits while the other does not benefit nor is it harmed Syntrophism metabolic products of one are useful nutrients for another Synergism two usually independent organisms cooperate to break down a nutrient neither one could have metabolized alone 12
13 Parasitism one derives its nutrients and habitat from a host that is usually harmed in the process Competition one member gives off antagonistic substances that inhibit or kill susceptible species sharing its habitat Predator consumer that actively seeks out and ingests live prey Scavengers feed on a variety of food sources 13
14 26.2 The Natural Recycling of Bioelements Processes by which bioelements and essential building blocks of protoplasm are recycled between biotic and abiotic environments Essential elements are cycled through biological, geologic, and chemical mechanisms biogeochemical cycles Microorganisms remove elements from their inorganic reservoirs and convey them into the food web Gaia theory: the biosphere contains a diversity of habitats and niches favorable to life because living things made it that way 14
15 Atmospheric Cycles Carbon cycle Nitrogen cycle 15
16 The Carbon Cycle Intimately associated with the energy transfers and trophic patterns of the biosphere Carbon is recycled through ecosystems via photosynthesis, respiration, and fermentation of organic molecules, limestone decomposition, and methane production 16
17 The Carbon Cycle Principle users of atmospheric CO 2 are photosynthetic autotrophs Carbon is returned to the atmosphere as CO 2 by respiration, fermentation, decomposition of marine deposits, and burning fossil fuels Methanogens reduce CO 2 and give off methane (CH 4 ) 17

18 Figure 26.6 The carbon cycle Insert figure 26.6 The carbon cycle 18
19 The Nitrogen Cycle N 2 gas is the most abundant gas in the atmosphere, 79% of air volume Involves several types of microbes 4 types of reactions: Nitrogen fixation atmospheric N 2 gas is converted to NH 4 salts; nitrogen-fixing bacteria live free or in symbiotic relationships with plants Root nodules: symbiosis between rhizobia and legumes Ammonification bacteria decompose nitrogencontaining organic compounds to ammonia Nitrification convert NH 4 + to NO 2 - and NO 3 - Denitrification microbial conversion of NO 3 - back to atmospheric N 2 19

20 Figure 26.7 Nitrogen Cycle 20

21 Figure 26.8 Nitrogen fixation through symbiosis Insert figure Nitrogen fixation through symbiosis 21

22 Figure 26.9 Inoculating legume seeds with Rhizobium bacteria 22
23 Sedimentary Cycles Sulfur cycle Phosphorous cycle 23
24 The Sulfur Cycle Sulfur originates from rocks, oceans, and lakes Sulfur exists in the elemental form and as hydrogen sulfide gas, sulfate, and thiosulfate Plants and many microbes can assimilate only SO 4 and animals require an organic source amino acids: cystine, cysteine, and methionine Bacteria convert environmental sulfurous compounds into useful substrates (sulfates) 24
25 The Phosphorous Cycle Chief inorganic reservoir of phosphate (PO 4 ) is phosphate rock PO 4 must be converted into a useable form (PO 4-3 ) by the action of acid; sulfuric acid is naturally released by some bacteria Organic phosphate is returned to soluble phosphate by decomposers 25

26 Figure The phosphorous cycle 26
27 Other Forms of Cycling Introduction of toxic substances escalates cycling of elements Some are converted to less harmful ones Some persist and flow in biosphere Bioaccumulation: when a pollutant is accumulated by living things through the natural trophic flow of the ecosystem Mercury compounds 27
28 26.3 Microbes on Land and in Water 28
29 Soil Microbiology: The Composition of the Lithosphere Soil is a dynamic ecosystem that supports interactions between geologic, chemical, and biological factors Humus rich moist layer of soil containing plant and animal debris being decomposed by microbes Rhizosphere zone of soil around plant roots contains associated bacteria, fungi, and protozoa Mycorrhizae symbiotic relationship formed between fungi and certain plant roots 29

30 Figure The soil habitat 30

31 Figure Mycorrhizae, symbiotic associations between fungi and plant roots 31
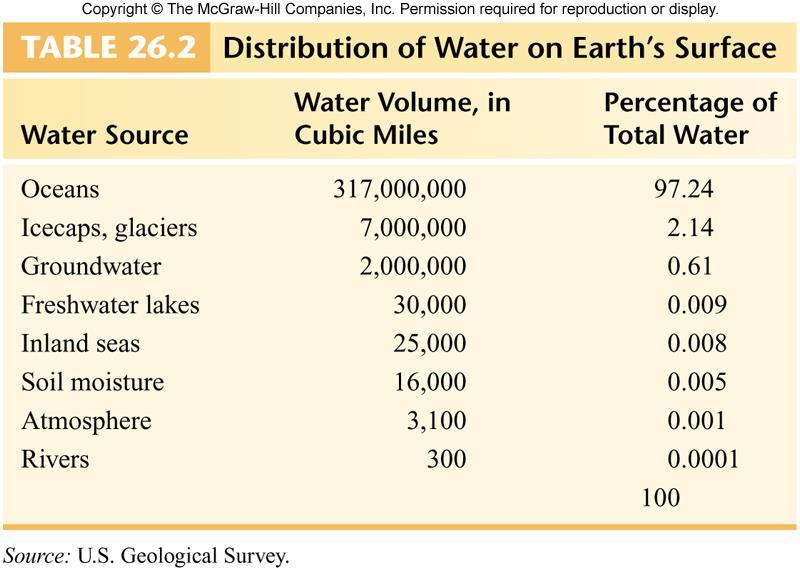
32 Aquatic Microbiology Water is the dominant compound on the earth; it occupies ¾ of the earth s surface Water is continuously cycled between hydrosphere, atmosphere, and lithosphere hydrologic cycle Water evaporates, accumulates in the atmosphere, and returns to the earth through condensation and precipitation Surface water collects in subterranean pockets forming groundwater source, called an aquifer resurfaces through springs, geysers, and hot vents, also tapped as primary supply for ¼ of water for human consumption 32

33 Figure Hydrologic cycle Insert figure Hydrologic cycle 33
34 34
35 The Structure of Aquatic Ecosystems Surface waters differ considerably in size, geographic location, and physical and chemical character Sunlight, temperature, aeration, and dissolved nutrient content are factors that contribute to the development of zones Lake is stratified vertically into 3 zones or strata: Photic zone surface to lowest limit of sunlight penetration Profundal zone edge of the photic zone to lake sediment Benthic zone organic debris and mud forming the basin Stratified horizontally into 2 zones: Littoral zone shoreline, relatively shallow water Limnetic zone open, deeper water 35

36 Figure Stratification in a freshwater lake 36
37 Marine Environments Resembles profile of lake but has variations in salinity, depth, temperature, hydrostatic pressure, and mixing Contains a zone, called an estuary, where river meets the sea; fluctuates in salinity, is very high in nutrients Tidal wave action subjects the coastal habitat to alternate period of submersion and exposure Abyssal zone extends to a depth of 10,000 m; supports communities with extreme adaptations including: Halophilic, psychrophilic, barophilic, and anaerobic 37
38 Aquatic Communities Microbial distribution is associated with sunlight, temperature, oxygen levels, and available nutrients Photic zone is most productive contains plankton Phytoplankton variety of photosynthetic algae and cyanobacteria Zooplankton microscopic consumers; filter feed, prey, or scavenge Benthic zone supports variety of organisms including aerobic and anaerobic bacterial decomposers 38
39 Large bodies of standing water develop thermal stratification Epilimnion upper region, warmest Hypolimnion deeper, cooler Thermocline buffer zone between warmest and coolest layers; ordinarily prevents the mixing of the two Currents, brought on by temperature change, cause upwelling of nutrient-rich benthic sediments and outbreaks of abundant microbial growth red tides 39

40 Figure Profiles of a lake Insert figure Profiles of a lake 40

41 Figure Red Tides 41
42 Nutrient range is variable Oligotrophic nutrient-deficient aquatic ecosystem; supports few microorganisms; many bacteriophage Eutrophication addition of excess quantities of nutrients; naturally or by effluents from sewage, agriculture, or industry; encourages heavy surface growth of algae (bloom) which cuts off the O 2 supply; disturbs the ecological balance Only anaerobic and facultative anaerobes will survive 42

43 Figure Heavy surface growth of algae and cyanobacteria in a eutrophic pond 43
44 Microbiology of Drinking Water Supplies Potable (drinkable) water free of pathogens, toxins, turbidity, odor, color, and taste Most prominent water-borne pathogens Giardia, Cryptosporidium, Campylobacter, Salmonella, Shigella, Vibrio, Mycobacterium, HAV, and Norwalk viruses Most assays of water purity focus on detecting fecal contamination indicator bacteria E. coli, Enterobacter, Citrobacter 44
45 Water Quality Assays Standard plate count number of colonies that develop provide estimate of the total population Membrane filter method after filtration, filter is placed on selective and differential media, incubated, colonies are presumptively identified and counted Most probable number (MPN) presumptive, confirmatory and completed tests No acceptable level for fecal coliforms, enterococci, viruses, or pathogenic protozoans in drinking water 45

46 Figure Insert figure Methods of water analysis 46