Water Quality Indicators
|
|
|
- Piers Tyler
- 5 years ago
- Views:
Transcription

1 Water Quality Indicators Ashley T. Slagle PVSC NJ Water Monitoring Council Meeting NJDEP Headquarters Trenton, NJ Wednesday, January 25, 2012
2 Who is the New Jersey Harbor Dischargers Group? 9 Sewerage Agencies, operating 11 Wastewater Treatment Plants discharging to the NY/NJ Harbor Estuary and treating 614 mgd of wastewater Bergen County Utilities Authority now includes Edgewater Municipal Utilities Authority Joint Meeting of Essex and Union Counties Linden Roselle Sewerage Authority Middlesex County Utilities Authority North Bergen Municipal Utilities Authority North Hudson Sewerage Authority Passaic Valley Sewerage Commission Rahway Valley Sewerage Authority Secaucus Municipal Utilities Authority
3 NJHDG Ambient Water Quality Monitoring Program Initiated late Monitoring Sites throughout NJ portion of NY/NJ Harbor Estuary Modeled after NYCDEP Harbor Survey Program Completely Volunteer Effort No outside funding Not mandated in any permit
4 NJHDG Ambient Water Quality Goals: Monitoring Program Provide information on ambient water quality for conventional pollutants Document seasonal changes Document improvements resulting from implementation of pollution control programs Validate water quality model results Foster appropriate regulatory decisions based on current water quality measurements Collectively utilize the agencies resources to best meet water quality objectives for the Harbor

5 L o c a t i o n s

6 L o c a t i Red = NJHDG sites Black = NYCDEP sites o n s


7 Sampling Fleet SAMPLING VESSEL MOBILE LAB
8 Sampling Approach Grab samples taken at each location Sample for all parameters at each site Exception: E.coli only in freshwaters Shallow sites (bridge sites) are sampled mid depth at mid river Remaining deep water sites (boat sites) are sampled at 1 meter below surface and 1 meter above substrate Depth > 15 feet
9 Sampling Frequency Summer May September Weekly Winter October April Monthly Weather Permitting Tributary sites monitored twice/month in summer & once/month in winter
10 NJHDG Cooperating Laboratories Passaic Valley Sewerage Commission Middlesex County Utilities Authority Bergen County Utilities Authority
11 Parameters Measured Temperature ph Salinity Dissolved Oxygen (DO) Secchi Depth (boat sites only) Fecal coliform Bacteria Enterococcus Bacteria (2007) E.coli Bacteria (2011 FW only) Chlorophyll a (2007) Total Suspended Solids (TSS) Total Kjeldahl Nitrogen (TKN) Ammonia Nitrogen (NH3 N) Nitrate Nitrogen (NO3 N) Nitrite Nitrogen (NO2 N) Total Phosphorus (TP) Orthophosphate (OP) 5 day Carbonaceous Biochemical Oxygen Demand (CBOD 5) Dissolved Organic Carbon (DOC)
12 In Situ Measurements Temperature ph Salinity Dissolved Oxygen (DO) YSI 556 Multiparameter handheld meter Secchi Depth Measure of water clarity or transparency Secchi Disk Boat Sites only
13 Pathogen Indicators Bacteria Fecal coliform bacteria All NJHDG Sites Enterococcus bacteria All NJHDG Sites E.coli bacteria Only Freshwater NJHDG Sites
14 Nutrients Nitrogen Ammonia Nitrogen (NH3 N) Rapidly oxidized by bacteria to NO2 & NO3 in the presence of DO Source of nitrogen essential nutrient for growth of aquatic plants and animals NH3 toxic to fish blocks O2 transfer to gills Total Kjeldahl Nitrogen (TKN) TKN = Organic Nitrogen + NH3 N Total Nitrogen (TN) = TKN + NO2 N + NO3 N Attributed to decay of organic matter
15 Nutrients Nitrogen Nitrite Nitrogen (NO2 N) NH3 NO2 NO3 (Nitrification) NH3 NO2 NO3 (Nitrogen Reduction) Levels of NO2 N above 0.55 mg/l can cause nitrite poisoning in fish ( brown blood disease) Increased methemoglobin causes blood to turn brown & makes blood unable to carry O2 fish suffocate Nitrate Nitrogen (NO3 N) Not particularly toxic to fish Essential nutrient for growth of aquatic plants and animals Too much increased algae growth, depletion of DO Eutrophication
16 Nutrients Phosphorus Total Phosphorus (TP) Total of 3 forms of phosphates: orthophosphate, metaphosphate (or polyphosphate), and organic phosphate Essential nutrient for growth of aquatic plants and animals Too much increased algae growth, depletion of DO Eutrophication Orthophosphate (OP) Formed by natural processes Phosphorus cycle Meta/Polyphosphate converted to Orthophosphate in water Reactive phosphorus Most readily available to aquatic plants and animals
17 Organic Matter 5 day Carbonaceous Biochemical Oxygen Demand (CBOD 5) Amount of O2 consumed by microorganisms during decomposition of organic matter Microorganisms use O2 to breakdown organic molecules (cellulose, sugars, etc) into CO2 + H2O Dissolved Organic Carbon (DOC) Organic material dissolved in water from decomposition of plant and animal material Food source for microorganisms indicator of organic loadings Forms strong complexes with metals decreases bioavailability to phytoplankton Can cause toxic disinfection byproducts when chlorinated
18 Solids / Chlorophyll Total Suspended Solids (TSS) Organic and mineral particles suspended in the water column Reduces light penetration lower photosynthesis rate lower DO concentrations P0llutants can bind to small silt particles move to other areas by sediment transport Chlorophyll a Most abundant form of chlorophyll within photosynthetic organisms (algae & phytoplankton) Indirect measure of nutrients excess nutrients (N & P) lead to overgrowth of algae and depletion of DO Eutrophication
19 Data Shared w/ NJDEP NJHDG water quality monitoring program fills data gap in NY/NJ Harbor monitors NJ waters not currently monitored by any other agency All NJHDG data entered into NJDEP s Water Quality Data Exchange (WQDE) system publically available NJHDG data used by NJDEP Bureau of Water Quality Standards and Assessment to determine attainment of designated uses based on compliance with SWQS
 www.harborestuary.org Biennial NJHDG Water Quality Reports www.pvsc.")
20 Regional Water Quality Reports Focus on Pathogen Indicators and Dissolved Oxygen (DO) Joint Publications with NYCDEP through NY NJ Harbor Estuary Program (HEP) Biennial NJHDG Water Quality Reports New York New Jersey Harbor Estuary Program
21 Surface Water Classifications for NJHDG Monitoring Locations NJHDG monitoring locations are under various NJ Surface Water Classifications FW2 NT: Sites 1 9 (Passaic R. and Tribs) Site 25 (Raritan R. Head of Tide) SE1: Site 13 (Hackensack R. Head of Tide) Sites (Raritan R.) SE2: Sites (Hackensack R.) Sites (Hudson R.) SE3: Sites (Passaic R.) Sites (Hackensack R. / Newark Bay) Sites (Arthur Kill & Tribs) Shellfish Waters (SE1): Sites (Raritan Bay)
22 NJ Surface Water Quality Standards (SWQS) Class Bacteria DO FW2-NT Sites 1-9, 25 E.coli Geometric Mean cfu/100ml Never >235 cfu/100ml 24hr Avg 5.0 mg/l Never <4.0 mg/l SE1 Sites 13, Enterococcus Geometric Mean 1 35 cfu/100ml Never >104 cfu/100ml 24hr Avg 5.0 mg/l Never <4.0 mg/l SE2 Sites 14-15, Fecal Coliform Geometric Mean cfu/100ml Never <4.0 mg/l SE3 Sites 10-12, Fecal Coliform Geometric Mean cfu/100ml Never <3.0 mg/l Shellfish Waters (SE1) Sites Fecal Coliform 2 Enterococcus Geometric Mean 1 14 cfu/100ml 90% 3 49 cfu/100ml Geometric Mean 1 35 cfu/100ml Never >104 cfu/100ml 24hr Avg 5.0 mg/l Never <4.0 mg/l 1 Based on Geometric Mean of a minimum of 5 samples in 30 days 2 Based on National Shellfish Sanitation Program standards for shellfish waters, direct harvest 3 Based on total number of samples taken in a 30-day period


23 Fecal Coliform


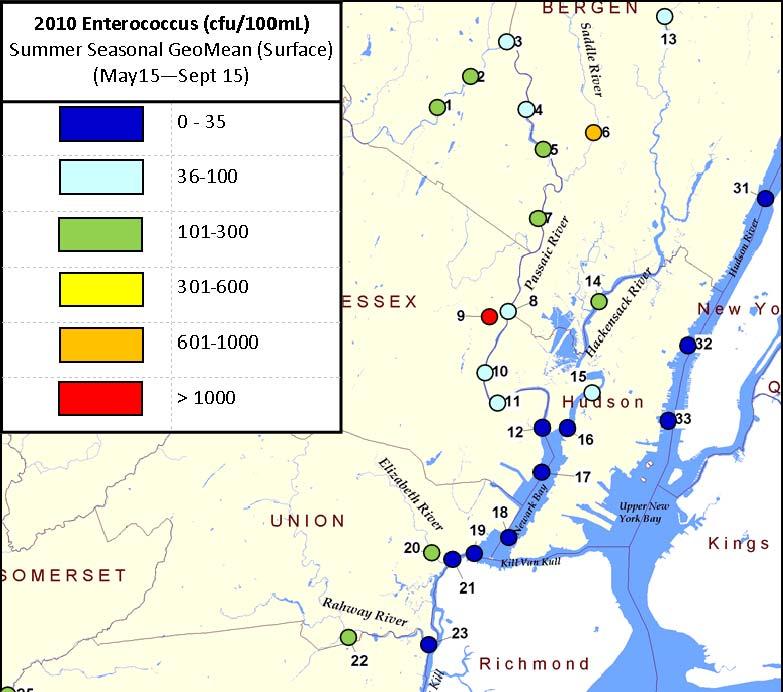
24 Enterococcus


25 Dissolved Oxygen


26 Questions Ashley Slagle