APPENDIX M VANDEN MEADOWS PROJECT WATER MODELING STUDY AND TECHNICAL MEMORANDUM
|
|
|
- Darleen Nichols
- 5 years ago
- Views:
Transcription
1 APPENDIX M VANDEN MEADOWS PROJECT WATER MODELING STUDY AND TECHNICAL MEMORANDUM
2 TECHNICAL MEMORANDUM Date: March 16, 2011 FROM: Victor M. Alaniz, P.E. Nolte Associates, Inc Natomas Park Drive, Fourth Floor Sacramento, CA TO: Ryan Lee, AICP Analytical Environmental Services th Street, Suite 100 Sacramento, CA SUBJECT: VANDEN MEADOWS EIR WATER MODELING STUDY DRAFT BACKGROUND This memorandum is intended to provide a summary of the water modeling tasks completed by Nolte as they pertain to the Vanden Meadows Specific Plan Development Project (Project). Water system modeling and analysis was conducted to assess the impact of the Project on the existing water distribution system for the City of Vacaville (City). WATER DEMAND SUMMARY Phillippi Engineering, Inc. (PEI) prepared the Vanden Meadows Water Modeling Study, dated January 2011 (PEI Study). A copy of the PEI Study is attached for reference. Included in the PEI Study is a summary of the proposed land uses and corresponding quantities. The Project is subdivided in to 13 sub-areas that comprises an area of approximately 260± acres. Figure 1 is a schematic representation of the Project subareas and land use summary. Table 1 is a summary of the total Project water demand. Included in Table 1 is a comparison of the Project water demand summarized in the City of Vacaville SB610 Water Supply Assessment Report for Vanden Meadows (SB610 Report), dated January 2011 prepared by Nolte Associates, Inc. to the Project water demand estimated by the PEI Study. Both demand estimates are in agreement in the total land use quantities and sub-area land uses. In summary, the SB610 Report includes a total potable water demand for the Project of approximately 481,390 gallons per day (gpd). The PEI Study includes a total water demand for the Project of approximately 481,435 gpd. There is a difference of approximately 45 gpd between the different summaries, for the most part due to rounding off estimates in the SB610 Report. Vanden Meadows EIR Water Modeling Study 1 SAB March 2011 (Draft) N:\SAB043901\Documents\Memos\TM_Draft.doc
3 Technical Memorandum March 16, 2011 TABLE 1 VANDEN MEADOWS PROJECT LAND USE AND DEMAND SUMMARY Sub Area a Estimated Water Demand Demand Factors PEI Study SB610 Report Potable Irrigation Potable Irrigation Total Potable Irrigation Total Land Use a Quantity a Unit gpd/unit gpd/unit gpd gpd gpd gpd gpd gpd A Residential Estates 26 DU , ,600 15, ,600 B Residential Estates 25 DU , ,000 15, ,000 C Residential Low Density 52 DU , ,040 27, ,040 D Residential Low Density 74 DU , ,480 38, ,480 E Residential High Density 192 DU , ,600 57, ,600 F Residential Low Density 50 DU , ,000 26, ,000 G Residential Medium Density 97 DU , ,950 33, ,950 H Residential Low/Medium Density 209 DU , ,780 87, ,780 I Residential Low Density 157 DU , ,640 81, ,640 J Residential Estates 11 DU , ,600 6, ,600 K Residential Estates 46 DU , ,600 27, ,600 L Park b 7.42 AC 0 2, ,600 0 M School c AC 0 1, ,600 42,600 M School 2,000 STU , ,000 60, ,000 N Trails & Landscaping d,e AC 170 2,500 4, ,145 4,100 61,000 4,100 N Agriculture Buffer d 6.93 AC 0 3, ,800 0 O Detention Basin AC Total Demand - Vanden Meadows Project 481, , , , ,990 a b c d e Sub-area, land use and quantities from Vanden Meadows Specific Plan [8] and confirmed with PEI Study. Irrigation demand for Park, Trails and Landscaping, and Agriculture Buffer land uses are assumed to be supplied by SID. Irrigation demand for School land use is assumed to be supplied by the City. Irrigation demand for School land use is assumed to be supplied by the City. Assumed to include potable demand supplied by the City for potential bathroom facilities. The irrigation demand for the proposed park, school, agricultural buffer, and trails/landscaping is estimated at approximately 143,000 gpd in the SB610 Report. The SB610 Report assumes that only the school irrigation demand would be supplied by the City all other irrigation demand would be supplied by the Solano Irrigation District (SID). The irrigation demand for the proposed school is approximately 42,600 gpd (28.41 acres at 1,500 gpd/ac). Thus, the total City supplied water demand for the Project is approximately 523,990 gpd (481,390 gpd (potable) plus 42,600 gpd (irrigation). WATER MODELING ASSUMPTIONS The existing city-wide water distribution system hydraulic computer model was updated to include the Vanden Meadows subdivision including the proposed water mains as suggested in the PEI Study. The potable water demand of 481,390 gpd and school irrigation demand of 42,600 gpd (from Table 1) was distributed among junction nodes for the proposed water system. Vanden Meadows EIR Water Modeling Study 2 SAB March 2011 (Draft) N:\SAB043901\Documents\Memos\TM_Draft.doc
4 Technical Memorandum March 16, 2011 As suggested by the PEI Study, the following modeling assumptions are part of this modeling study: Southtown Phase 1A and Southtown Commons water mains are in operation. Southtown Phase 2 water mains are in operation. Southtown Phase 3 water mains are in operation. Extension of 18-inch water main along Leisure Town Road from Alamo Creek to the northern boundary of Vanden Meadows Project (Southtown Commons/Southtown Phase 1/1A) is in operation. If these future water mains are not in operation at the time the Project is constructed further studies will be necessary to confirm the impacts to the City water distribution system. Figure 2 is a schematic representation of the proposed water distribution system for the Vanden Meadows Project. The City s Water Master Plan fire flow requirement for low density residential land uses (RE and RLD) is 1,500 gpm. For RLMD land use, the fire flow requirement is 3,000 gpm. However, this requirement is reduced to 1,500 gpm if dwelling units are constructed with a minimum eave to eave separation of 6 feet. The PEI Study indicates that the developer will meet this requirement, so the fire flow for RLMD land uses is reduced to 1,500 gpm. For the RMD and School land uses, the fire flow requirement is 3,000 gpm. For the RHD land use, the fire flow requirement is 4,500 gpm. WATER MODELING RESULTS The following simulations were executed using the City s water distribution system model (including Vanden Meadows): Maximum Day Demand Maximum Day Demand and 1,500 gpm fire flow at J-VM30 Maximum Day Demand and 4,500 gpm fire flow at J-VM67 Peak Hour Demand Junction node J-VM30 was selected as the representative residential fire flow simulation for the Project because it corresponds to the longest dead-end water main proposed for the Project (approximately 410 lineal feet). Junction node J-VM67 was selected as the representative 4,500 gpm fire flow because it is located within Sub-area E with proposed residential high density (RHD) land uses. For Maximum Day Demand, the model predicts acceptable results for residual pressures and pipe flow velocities. Pressures within the Project area range from 63 psi to 76 psi. In addition, all pipe flow velocities are anticipated to be less than 10 feet/second (ft/s) in accordance with the City s Water Master Plan. Vanden Meadows EIR Water Modeling Study 3 SAB March 2011 (Draft) N:\SAB043901\Documents\Memos\TM_Draft.doc
5 Technical Memorandum March 16, 2011 For the Maximum Day Demand and 1,500 gpm fire flow at J-VM30 simulation, the model predicts residual pressures in the Project area ranging from 75 psi to 89 psi. In addition the maximum pipe flow velocity was 9.7 ft/s. A fire flow location of J-VM67 was selected because it is located within Sub-Area E with proposed residential high density (RHD) housing. The PEI Study (Figure 4.1) illustrates a water main loop within this proposed high density housing development with only one connection. For Maximum Day Demand and 4,500 gpm fire flow at J-VM67, the model predicts residual pressures in the Project area ranging from 65 psi to 77 psi. However, the pipe flow velocity is estimated at approximately 12.9 ft/s which is unacceptable, the maximum flow velocity must be 10 ft/sec. To mitigate this deficiency in the system, it is recommended that the 12-inch loop have two connections to the 12-inch water main on Vanden Road. Figure 2 includes the recommended additional connection schematically. Additional fire flow simulations corresponding to the school and other residential land use zones were also included in the analysis and the proposed water distribution system is capable of providing adequate service acceptable per the City s Water Master Plan design criteria (minimum residual pressure, headloss, and velocity). For Peak Hour Demand, the model predicts acceptable results for residual pressures and pipe flow velocities. Pressures in the Project area ranged from 67 psi to 77 psi with maximum pipe flow velocity at 7.2 ft/s. FINDINGS AND RECOMMENDATIONS The following is a summary of the findings and recommendations concluded from this modeling study: The Vanden Meadows Project assumes the following projects are complete (including their water mains): o Southtown Phase 1A o Southtown Commons o Southtown Phase 3 If any of the projects listed above are not completed at the time the Vanden Meadows Project is constructed additional studies will be required to identify the impact to the distribution system and the findings and recommendations listed here shall be confirmed. Only the complete buildout of the Project was analyzed in this Technical Memorandum. Any phasing plan proposed for the Project will require a modeling analysis to confirm it can be served by the City s water distribution system. The RLMD land uses areas are assumed to have dwelling units with a minimum eave to eave separation of 6 ft to qualify for the reduced fire flow requirement of 1,500 gpm. If Vanden Meadows EIR Water Modeling Study 4 SAB March 2011 (Draft) N:\SAB043901\Documents\Memos\TM_Draft.doc
6 Technical Memorandum March 16, 2011 the eave to eave separation cannot be achieved, additional studies are necessary to confirm the impact of the proposed water system at the 3,000 gpm fire flow requirement. The proposed 12-inch water main loop for the high density housing on the northeast corner of Vanden Road and Foxboro Parkway has only one connection. The fire flow requirement (4,500 gpm) cannot be met with only one connection. An additional connection will be necessary. The portion of 12-inch water main proposed east of Nut Tree Road on Foxboro Parkway is knows as Development Impact Fee (DIF) project 88B. It is originally aligned to extend south on Leisure Town Road and connect to existing 12-inch on Foxboro Parkway near Nut Tree Road. The proposed section of 12-inch as suggested by PEI east of Nut Tree Road can provide adequate service to the area, however, it should be upsized to 18-inch to complete the DIF 88B project and the intended purpose to convey water to the Leisure Town Road transmission system in the future. Vanden Meadows EIR Water Modeling Study 5 SAB March 2011 (Draft) N:\SAB043901\Documents\Memos\TM_Draft.doc
7
8

9 City of Vacaville Vanden Meadows Project Water Modeling Study January 2011
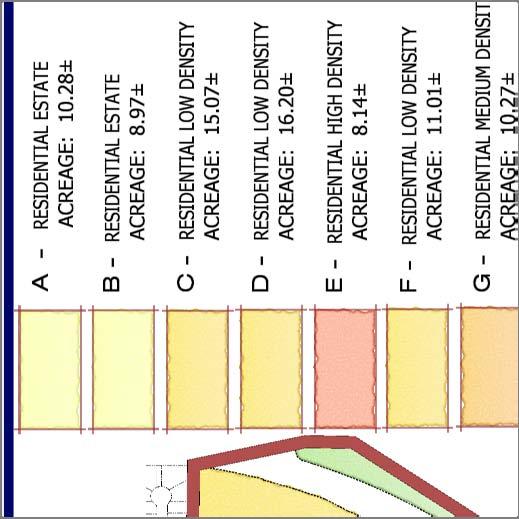
10 City of Vacaville Vanden Meadows Project Water Modeling Study January 2011 The City of Vacaville existing conditions water model will be modified to include the following projects: The Villages at Vanden Meadows The Estates at Vanden Meadows The modified existing conditions water model will be executed to identify any operational impacts as a result of these proposed projects. A summary of the modeling study findings is presented below. 1.0 BACKGROUND The total Vanden Meadows area comprises 260 ± acres and is bounded by Nut Tree Road on the west, the Southtown Project to the north, the railroad property to the east and the Vacaville/ Fairfield buffer to the south. The property comprises 5 land owners (See Figure 1.1). The Vanden Meadows Specific Plan establishes a comprehensively planned community that is designed to work with the Southtown project to the north. The Land Use component of the Specific Plan is primarily residential with the non-residential uses comprising the school(s) and park. The Vanden Meadows area is divided into 13 subareas (See Figure 1.2). Each subarea has a different land use designation. Table 3.1 details each of the subareas. Subareas A, B, C, D, and E comprise approximately 59± acres and are owned by the Hockett group. This property is located between Nut Tree Road and Vanden Road with the Travis Unified School District (TUSD) property comprising a portion of its northern boundary and the Montgomery property, SID canal, and Fairfield-Vacaville buffer comprising its southern boundary. Subarea F is approximately 11± acres and is owned by Evon Papin. The property is bounded by Southtown to the north, the TUSD property to the west, Vanden Road to the east and the Hockett property to the south. Subareas G, H, and I are owned by Belmont Homes and Park Lane Apartments (collectively referred to as the Zocchi Property). These areas are bounded by Southtown to the north, Vanden Road to the west and Leisure Town Road (Jepson Parkway) to the east and south. Subareas J and K comprise approximately 21± acres, are owned by the Montgomery group and are bounded by the Fairfield-Vacaville buffer to the south, Nut Tree Road to the west, and the Hockett property to the north and east. Subarea L comprises approximately 7± acres, is designated as a future park and is currently owned by the Hockett group. Subarea M is owned by the TUSD and is designated for future
11 school(s). Subarea N is currently owned by various entities and is designated as trails, landscaping and agricultural buffer. Lastly, Subarea O is designated as Detention Basin (Community Facility). TABLE 1.1 VANDEN MEADOWS LAND USE SUMMARY (Refer to Figures 1.1 and 1.2 for Location of Areas) Sub Area Land Use Proposed Zoning Approximate Area (Acres) Residential Units Density (Units/Acre) Non Residential Uses A RE RE B RE RE C RLD RLD D RLD RLD E RHD RH F RLD RLD G RMD RMD H RLMD RLMD I RLD RLD J RE RE K RE RE L CF CF 7.42 PARK M CF CF SCHOOL N CF CF TRAILS & LANDSCAPING (including AG Buffer) O CF CF DETENTION BASIN TOTAL * * - Total Land Use Density Excludes the School Property (28.41 Ac), the Ag Buffer (6.93 Ac), and the Detention Basin (17.01 Ac).


12


13
14 2.0 CONSISTENCY WITH LAND USE PLAN The build out of the Vanden Meadows project is to be consistent with the Specific Plan for the Vanden Meadows project as well as the City of Vacaville General Plan. The fire flow requirement stated in the Water Master Plan for RLD land use is 1,00 gpm, 3,000 gpm for RLMD land use, and 4,500 gpm for RHD and CS land use. The 3,000 gpm fire flow requirement for RLMD land uses is typically reduced to 1,500 gpm if it can be verified that an eave to eave separation between structures is at least 6 ft. The developers for the projects have guaranteed that the proposed RLMD dwelling units will maintain an eave to eave separation of at least 6 ft. In conclusion, all the proposed residential units with the exception of the apartment sight will be subjected to a fire flow requirement of 1,500 gpm.
15 3.0 WATER DEMANDS The water demand for the proposed Vanden Meadows project was estimated using the water demand factors published in Table 11 of SB 610 Water Supply Assessment Report for Vanden Meadows, and are as follows: 420 gpd/du for RLMD land use, 520 gpd/du for RLD land use, 600 gpd/du for RE land use, 350 gpd/du for RMD land use, 300 gpd/du for RHD land use, 170 gpd/acre for Trails and Landscaping land use, and 30 gpd/student for School land use. A summary of the Vanden Meadows project water demand can be found in Table 12 of SB 610 Water Supply Assessment Report for Vanden Meadows and is summarized in Table 3.0 found below. Table 3.0 Vanden Meadows Land Use and Demand Summary at Year 2015 Demand Facor Estimated Water Demand Sub Area Land Use Quantity Unit gpd/unit gpd gpm A RE DU 15, B RE DU 15, C RLD DU 27, D RLD DU 38, E RHD DU 57, F RLD DU 26, G RMD DU 33, H RLMD DU 87, I RLD DU 81, J RE DU 6, K RE DU 27, M SCHOOL Student 60, N TRAILS Acre 4,
16 4.0 WATER DISTRIBUTION SYSTEM MODEL The water distribution system near the vicinity of the proposed Vanden Meadows project includes existing 12-inch water mains in Vanden Road and Foxboro Parkway terminating at the project boundary. Additionally, an existing 12-inch water main runs parallel to the project boundary in Nut tree Road. This study assumes that the 18-inch water main within Leisure Town Road, from New Alamo Creek to the Northern Vanden Meadows Boundary, which is conditioned to be built by Southtown Phase 1A and Southtown Commons, has been constructed and is in operating condition at the time of construction of the Vanden Meadows Project. If the 18-inch water main is not in operating condition at the time Vanden Meadows is preparing for construction, further studies will be required to determine what mitigation might be necessary. This study further assumes that the water network within Southtown Phase 1A and 3 have been installed and are operable at the time that Vanden Meadows is preparing for construction. If the respective water systems within the Southtown Phase 1A & 3 developments are not in operating condition at the time Vanden Meadows is preparing for construction, further studies will be required to determine what mitigation might be necessary. The Vanden Meadows project includes a distribution system consisting of 8-inch, 12-inch and 18-inch water mains. The project water system will include connections to existing adjacent water mains in locations around the project boundary at the intersection of Foxboro Parkway and Nut Tree Road, in Nut Tree Road, in Vanden Road, in Street X, in Street Y, and in Leisure Town Road. An 18-inch distribution main outlined in DIF 88 is proposed in Leisure Town Road from the connection point at the northern project boundary with Southtown Phase 1A, to the current intersection of Leisure Town Road and Vanden Road. A 12-inch main is proposed in the following locations: in Foxboro Parkway from the intersection of Foxboro Parkway and Nut Tree Road to the existing intersection of Vanden Road and Leisure Town Road, and in the realigned Vanden Road, A Street, G Street, H Street, N Street, O Street, P Street, and Q street. 8-inch mains are planned to be located in all other public streets. See Figure 4.1 for the proposed location of potable water facilities. Connections at Nut Tree Road and the TUSD site, Vanden Road and Leisure Town Road are used to provide the water supply to the model. 4.1 Modeling Assumptions A summary of the assumptions used in this water modeling study is presented in Table A-1, which can be found in Appendix A. 4.2 Modeling Scenarios Modeling simulations including average day, maximum day, maximum day and fire flow, and peak hour were executed for the following scenarios: Scenario 1: The Villages at Vanden Meadows Scenario 2: The Estates at Vanden Meadows Scenario 3: Build out of all projects within the Vanden Meadows specific plan area south of Southtown and east of Nut Tree Road.


17
18 5.0 THE VILLAGES AT VANDEN MEADOWS PROJECT MODELING ANALYSIS This modeling analysis assumes the proposed The Villages at Vanden Meadows project is the only development constructed. The proposed pipe and node map for this project, Scenario 1, is presented in figure THE VILLAGES AT VANDEN MEADOWS MODELING RESULTS For Scenario 1, a total of 6 simulations were executed: 1. Average Day 2. Maximum Day 3. Maximum Day with 1,500 gpm fire flow at J-74 (RLMD site) 4. Maximum Day with 1,500 gpm fire flow at J-63 (Fire Hydrant) 5. Maximum Day with 1,500 gpm fire flow at J-96 (Fire Hydrant) 6. Peak Hour Results follow in Figure 5.1 and Table 5. The model was run through 40 trials and generated the following results: 1. Average Day 1.1 Minimum Node Pressure = 94.9 J-54 and J Maximum Pipe Velocity = 2.16 fps in P-76, P-155 and P Maximum Day 2.1 Minimum Node Pressure = 93.5 J Maximum Pipe Velocity = 2.25 fps in P-76, P-155 and P Maximum Day with 1,500 gpm fire flow at J-74 (RLMD site) 3.1 Minimum Node Pressure = 73.9 J Maximum Pipe Velocity = 6.87 fps in P-76, P-155 and P Maximum Day with 1,500 gpm fire flow at J-63 (Fire Hydrant) 4.1 Minimum Node Pressure = 77.2 J Maximum Pipe Velocity = 9.68 fps in P Maximum Day with 1,500 gpm fire flow at J-96 (Fire Hydrant) 5.1 Minimum Node Pressure = 79.6 J Maximum Pipe Velocity = 9.62 fps in P Peak Hour 6.1 Minimum Node Pressure = 78.8 J-54 and J Maximum Pipe Velocity = 2.21 fps in P-76, P-155 and P-169
19 Table 5 Scenario 1 - Villages at Vanden Meadows Node Pressure and Pipe Flow Velocity Results Node Pressure Results Pipe Flow Velocity Results Residual Pressure, psi Flow Velocity, ft/sec Node Elev., Avg. Max Max Day and Fire at Peak Pipe Size Avg. Max Max Day and Fire at Peak ID FT Day Day J-74 1 J-63 1 J-96 1 Hour ID (in) Day Day J-74 1 J-63 1 J-96 1 Hour J P J P J P J P J P J P J P J P J P J P J P J P J P J P J P J P J P J P J P J P J P J P J P J P J P J P J P J P J P J P J P J P J P J P J P J P J P J P J P Calculated with fire flow at J-74, J-63 and J-96 of 1500 gpm. P P P P P P
20
21 6.0 THE ESTATES AT VANDEN MEADOWS PROJECT MODELING ANALYSIS This modeling analysis assumes the proposed The Estates at Vanden Meadows project is the only development constructed. The proposed pipe and node map for this project, Scenario 2, is presented in figure THE ESTATES AT VANDEN MEADOWS MODELING RESULTS For Scenario 2, a total of 6 simulations were executed: 1. Average Day 2. Maximum Day 3. Maximum Day with 4,500 gpm fire flow at J-32 (RHD Site) 4. Maximum Day with 1,500 gpm fire flow at J-47 (Fire Hydrant) 5. Maximum Day with 1,500 gpm fire flow at J-107 (Fire Hydrant) 6. Peak Hour Results follow in Figure 6.1 and Table 6. The model was run through 40 trials and generated the following results: 1. Average Day 1.1 Minimum Node Pressure = 85.0 J Maximum Pipe Velocity = 3.48 fps in P Maximum Day 2.1 Minimum Node Pressure = 83.7 J Maximum Pipe Velocity = 3.62 fps in P Maximum Day with 4,500 gpm fire flow at J-32 (RHD site) 3.1 Minimum Node Pressure = 66.7 J Maximum Pipe Velocity = 8.04 fps in P Maximum Day with 1,500 gpm fire flow at J-47 (Fire Hydrant) 4.1 Minimum Node Pressure = 75.2 J Maximum Pipe Velocity = 9.57 fps in P Maximum Day with 1,500 gpm fire flow at J-107 (Fire Hydrant) 5.1 Minimum Node Pressure = 73.0 J Maximum Pipe Velocity = 9.60 fps in P Peak Hour 6.1 Minimum Node Pressure = 68.9 J Maximum Pipe Velocity = 3.69 fps in P-169
22 Table 6 Scenario 2 - Estates at Vanden Meadows Node Pressure and Pipe Flow Velocity Results Node Pressure Results Pipe Flow Velocity Results Residual Pressure, psi Flow Velocity, ft/sec Node Elev., Avg. Max Max Day and Fire at Peak Pipe Size Avg. Max Max Day and Fire at Peak ID FT Day Day J-32 1 J-47 2 J Hour ID (in) Day Day J-32 1 J-47 2 J Hour J P J P J P J P J P J P J P J P J P J P J P J P J P J P J P J P J P J P J P J P J P J P J P J P J P J P J P J P J P J P J P J P J P J P J P J P J P Calculated with fire flow at J-32 of 4500 gpm. P Calculated with fire flow at J-47 and J-107 of 1500 gpm. P P P P P P P P P P P
23
24 7.0 ALL PROJECTS MODELING ANALYSIS This modeling analysis includes all Vanden Meadows projects. The proposed pipe and node map for this project, Scenario 3, is presented in figure ALL PROJECTS MODELING RESULTS For Scenario 3, a total of 7 simulations were executed: 1. Average Day 2. Maximum Day 3. Maximum Day with 4,500 gpm fire flow at J-32 (RHD Site) 4. Maximum Day with 1,500 gpm fire flow at J-74 (RLMD Site) 5. Maximum Day with 1,500 gpm fire flow at J-47 (Fire Hydrant) 6. Maximum Day with 1,500 gpm fire flow at J-63 (Fire Hydrant) 7. Peak Hour Results follow in Figure 7.1 and Table 7. The model was run through 40 trials and generated the following results: 1. Average Day 1.1 Minimum Node Pressure = 85.2 J Maximum Pipe Velocity = 3.60 fps in P Maximum Day 2.1 Minimum Node Pressure = 83.8 J Maximum Pipe Velocity = 3.78 fps in P Maximum Day with 4,500 gpm fire flow at J-32 (RHD Site) 3.1 Minimum Node Pressure = 64.3 J Maximum Pipe Velocity = 8.28 fps in P Maximum Day with 1,500 gpm fire flow at J-74 (RLMD Site) 4.1 Minimum Node Pressure = 70.6 J Maximum Pipe Velocity = 7.58 fps in P Maximum Day with 1,500 gpm fire flow at J-47 (Fire Hydrant) 5.1 Minimum Node Pressure = 76.1 J Maximum Pipe Velocity = 9.57 fps in P Maximum Day with 1,500 gpm fire flow at J-63 (Fire Hydrant) 6.1 Minimum Node Pressure = 76.2 J Maximum Pipe Velocity = 9.68 fps in P Peak Hour 7.1 Minimum Node Pressure = 69.0 J Maximum Pipe Velocity = 3.90 fps in P-169
25 Table 7 Scenario 3 - Total Buildout of Vanden Meadows Node Pressure and Pipe Flow Velocity Results Node Pressure Results Pipe Flow Velocity Results Residual Pressure, psi Flow Velocity, ft/sec Node Elev., Avg. Max Max Day and Fire at Peak Pipe Size Avg. Max Max Day and Fire at Peak ID FT Day Day J-32 1 J-74 2 J-47 3 J-63 3 Hour ID (in) Day Day J-32 1 J-74 2 J-47 3 J-63 3 Hour J P J P J P J P J P J P J P J P J P J P J P J P J P J P J P J P J P J P J P J P J P J P J P J P J P J P J P J P J P J P J P J P J P J P J P J P J P J P J P J P J P J P J P J P J P J P J P J P J P J P J P J P J P J P J P J P J P J P Calculated with fire flow at J-32 of 4500 gpm. P Calculated with fire flow at J-74 of 1500 gpm. P Calculated with fire flow at J-47 and J-63 of 1500 gpm. P Note: nodes well in excess of minimum pressure are excluded to fit this page. Note: pipes well below the maximum velocities are excluded to fit this page.
26
27 8.0 PRELIMINARY FINDINGS The City s Advance Planning Department will revise the WBLUDMS to incorporate the proposed land uses for the Vanden Meadows Project. The fire flow requirement for RLD land use is 1,500 gpm, 4,500 gpm for RHD land use, and 3,000 gpm for RLMD land uses. Because the proposed RLMD units will have eave to eave separation of 6 ft or more, the fire flow requirement for this land use is reduced to 1,500 gpm. The water model results (Scenario 1) conclude that the proposed The Villages at Vanden Meadows Project can be properly served by the Main Zone with acceptable results. The residual pressures and velocities are acceptable per the design criteria of the Water Master Plan. The water model results (Scenario 2) conclude that the proposed The Estates at Vanden Meadows Project can be properly served by the Main Zone with acceptable results. The residual pressures and velocities are acceptable per the design criteria of the Water Master Plan. The water model results (Scenario 3) conclude that the proposed The Vanden Meadows Project can be properly served by the Main Zone with acceptable results. The residual pressures and velocities are acceptable per the design criteria of the Water Master Plan. The projects in this modeling study are as shown in the Vanden Meadows Specific Plan prepared by Phillippi Engineering, Inc. Future revisions to maps and/or adjacent lands would warrant updates to this study.