August 22, City of Gooding. Public Meeting. Keller Associates, Inc. 305 N. 3 rd, Suite A Pocatello, ID Water System Evaluation
|
|
|
- Melina Walters
- 5 years ago
- Views:
Transcription


1 August 22, 2012 City of Gooding Public Meeting Water System Evaluation Keller Associates, Inc. 305 N. 3 rd, Suite A Pocatello, ID 83201


2 Existing Conditions The City maintains two water systems: Non-potable irrigation system Drinking water system 2

 4,039 gallons")

3 Non-potable Irrigation System Water Rights: 9 cubic feet per second (cfs) 4,039 gallons per minute (gpm) 5,820,000 gallons per day (gpd) 3
4 Non-potable Irrigation System Area Served: 360 acres Diversion Area Serviced (acre) Rel. Size Fraction of City Limits Fraction of Built-up area % 21% 32% Beehive 7.5 2% 1% 1% 1.9 1% 0% 0% Pump 7.0 2% 1% 1% Pump % 6% 8% Woodworth % 11% 16% TOTAL % 40% 60% 4


5 Non-potable Irrigation System Piping Network: 21 miles of piping and ditches 5

6 Non-potable Irrigation System Current Charges: $39.91 per lot per year Maintenance: hours per day, 6 days per week 11 people 5 months/year 6

7 Rotted Pipe 7
")
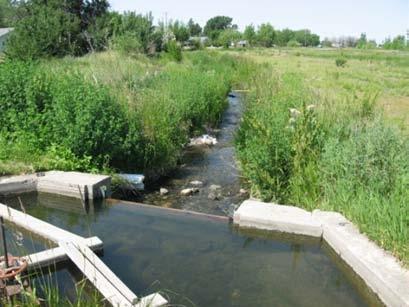
8 Irrigation Ditch (1) 8
")
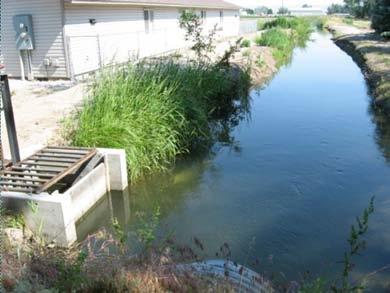
9 Irrigation Ditch (2) 9
")
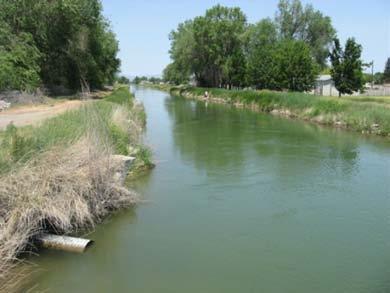
10 Irrigation Ditch (3) 10
")
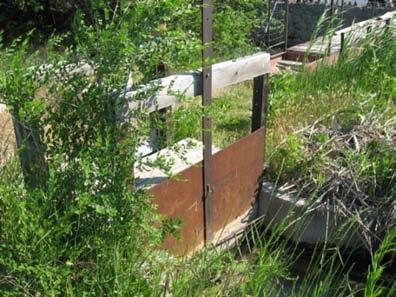
11 Irrigation Ditch (4) 11
")
12 Irrigation Ditch (5) 12

13 Irrigation Pipe Problems 13

14 Irrigation System Summary: Continued breakdown and collapse of system Increasing operational and management effort City has determined continued system use in current state is not practical 14

")
15 Drinking Water System Water Rights: 7.05 cubic feet per second (cfs) 3,164 gallons per minute (gpm) 4,560,000 gallons per day (gpd) 15

16 Drinking Water System Well Pumping Capacity: 4 th Avenue Well 13 th Avenue Well Senior Avenue Well Total 925 gpm 1,100 gpm 1,518 gpm 3,543 gpm 16

17 Drinking Water System Total Redundant Supply - {IDAPA } Total Supply Less Largest Well Total Redundant Supply 3,543 gpm -1,518 gpm 2,025 gpm 17
18 Drinking Water System Maximum Day Demand, Summers 2007 & ,900 gpm 18
19 Drinking Water System What if we do nothing? Population Growth 7,000 6,500 6,000 5,500 Population 5,000 4,500 4,000 3,500 3% Annual Growth Rate Historical Growth Rate (1.2%) 0.5% Annual Growth Rate 3,000 2,500 2,000 1, Year Planning purposes assume: 1.2% growth rate per year 19
20 Potable Current water system Potable Water System Year Population Max Day Demand (gpm) Redundant Well Supply (gpm) Surplus/Deficiency (gpm) ,567 1,900 2, ,653 2,001 2, ,878 2,264 2, ,637 3,154 2,025-1, ,225 3,842 2,025-1, ,887 4,617 2,025-2,592 By 2017, demand is greater than Redundant Supply while using gravity irrigation system 20
21 Typical Potable Water Demand Patterns: 12 Lots Using Irrigation Water 12 Lots Without Irrigation Water 60,000 Monthly Water Usage, Gallons 50,000 40,000 30,000 20,000 10,000 Average =26,014 gal/month Average =7,329 gal/month 0 Access to Flood Irrigation No Access to Flood Irrigation 21
22 Typical Monthly Potable Water Costs $60.00 Average Monthly Water Cost, $ $50.00 $40.00 $30.00 $20.00 $10.00 Average = $32.06/month Average = $14.39/month $0.00 Access to Flood Irrigation No Access to Flood Irrigation 22
23 Considered Alternatives: Alternative Description 1 Maintain existing gravity irrigation system 2 Install pressurized irrigation system 3 Abandon irrigation system and use existing potable water system 3a Augment potable water system by drilling new wells 3b Augment potable water system by constructing potable water treatment plant to treat surface water rights 3c Augment potable water system by constructing potable water treatment plant to treat surface water and by drilling an additional well 23
24 Summary of Alternatives Utilize Surface Water for Irrigation Alternative Description Estimated Cost* 1 Replace existing gravity irrigation system $14,125,000 2 Install pressurized irrigation system $12,052,000 Augment Potable Water System Alternative Description Estimated Cost* 3a Drill additional wells & upgrade distribution system $9,454,000** 3b Construct surface water treatment plant & upgrade distribution system $19,053,000 3c Construct surface water treatment plant & a new well & upgrade distribution system $14,736,000 *Cost estimates are considered to be order of magnitude for alternative comparison purposes. More refined cost estimates will be prepared during the pre-design process. **Total Alternative 3a cost is $12,169,000 to compete all anticipated improvements. City decided to tackle $9,454,000 of the $12,169,
25 Irrigation Committee Recommendation Letter, 12/15/2009 Alternative 3a - Most cost effective approach Augment current potable system Upgrade undersized water lines Abandon existing irrigation system Protect existing surface water rights Anticipated Costs $9,454,000 25
26 Alternative 3: Abandon Existing Irrigation System and Only Utilize Drinking Water System Large deficiency when considering redundant well supply and total current well supply not a viable alternative Year Population Max Day Demand (gpm) Redundant Supply (gpm) Deficiency (gpm) ,567 4,178 2,025-2, ,653 4,279 2,025-2, ,878 4,542 2,025-2, ,637 5,431 2,025-3,406 Year Population Max Day Demand (gpm) Total Well Supply (gpm) Deficiency (gpm) ,567 4,178 3, ,653 4,279 3, ,878 4,542 3, ,637 5,431 3,543-1,888 26
27 Alternative 3a: Augment Potable Water System by Drilling New Wells Abandon existing flood irrigation system Acquire additional water rights Drill two new wells immediately and one well in 2017 Upgrade under-sized water lines Costs charged on a usage basis Year Population Max Day Demand (gpm) Redundant Well Supply (gpm) Surplus/Deficiency (gpm) ,567 4,178 5, ,653 4,279 5, ,878 4,542 6,579 2, ,637 5,431 6,579 1,148 Anticipated Costs - $9,454,000 27
28 Alternative 3a: Augment Potable Water System by Drilling New Wells Implementation of Alternative 3a will eliminate yearly gravity irrigation charge of $
29 Alternative 3a: Water Charges vs. Usage $120 $110 $100 $90 $80 Monthly Fees, $ $70 $60 $50 $40 $30 $20 $10 $0 0 10,000 20,000 30,000 40,000 50,000 60,000 70,000 80,000 Monthly Water Usage, Gallons Current Rate Anticipated rate 29
30 Alternative 3a: Current and Projected Water Rates $100 $90 $80 Monthly Water Costs, $ $70 $60 $50 $40 $30 $20 Anticipated typical rates Anticipated monthly average = $64.01 Current monthly rates WITHOUT flood irrigation Current monthly average water rates = $32.06 Current monthly rates WITH flood irrigation $10 $0 Aug 08 Jul 08 Jun 08 May 08 Apr 08 Mar 08 Feb 08 Jan 08 Dec 07 Nov 07 Oct 07 Sept 07 Aug 07 Jul 07 Jun 07 May 07 30
31 Alternative 3a Addresses Health and Safety Issues No backup supply: DEQ requirement for a redundant water supply in the event a well goes out of service Low fire flows in town: Need to increase fire flow for fire hydrants and building fire sprinkler systems maintained by some of our larger users such as our schools, Walker Center, and hospital Low pressure: Need ability to maintain pressure during peak demands to prevent possible back flow contamination Supply deficiency: Within 24 gpm of our redundant water needs now and in 5 years we could be -239 gpm 31
32 Recommendations Implement Alternative 3a City should pursue financial assistance to help finance project Received Idaho DEQ loan ($7M, 1%, 20 years) Idaho Department of Commerce (up to $350,000 in grants) Others City will pursue judicial confirmation to enable indebtedness City should acquire additional groundwater rights 32
33 Next Steps Town Hall meeting: September 11, 2012 Public hearing for comment: September 26,


34 Thank You Mayor William Morton Michael Arkoosh Vern France Diane Houser Mel Magnelli th Avenue West City of Gooding, ID (208) Jim Mullen, P.E. Oksana Roth, E.I. Keller Associates, Inc. 305 N. 3 rd Avenue, Suite A Pocatello, ID (208) DEQ Twin Falls Regional Office 1363 Fillmore St. Twin Falls, ID (208)