Ecosystem effects of ocean acidification. Prof. Jason M Hall-Spencer
|
|
|
- Candace Doyle
- 5 years ago
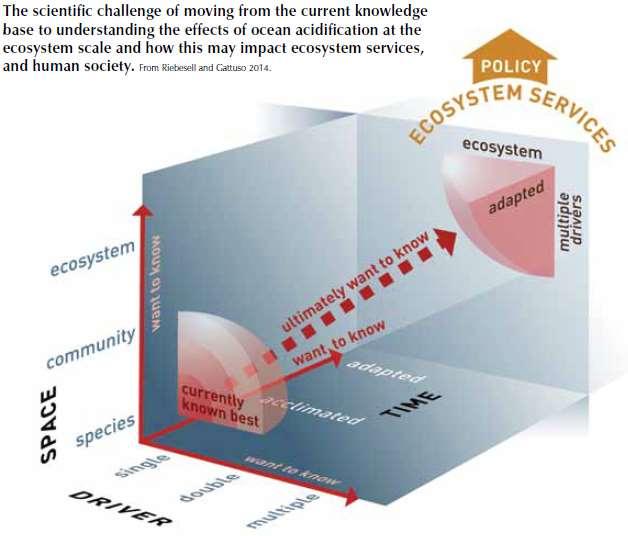
- Views:
Transcription


1 Ecosystem effects of ocean acidification Prof. Jason M Hall-Spencer 28 October 2018

2 Less ocean acidification research in Asia than US, UK and Australia. Japan is a regional leader


3 We know that seawater ph is falling rapidly off Japan Midorikawa (2010)

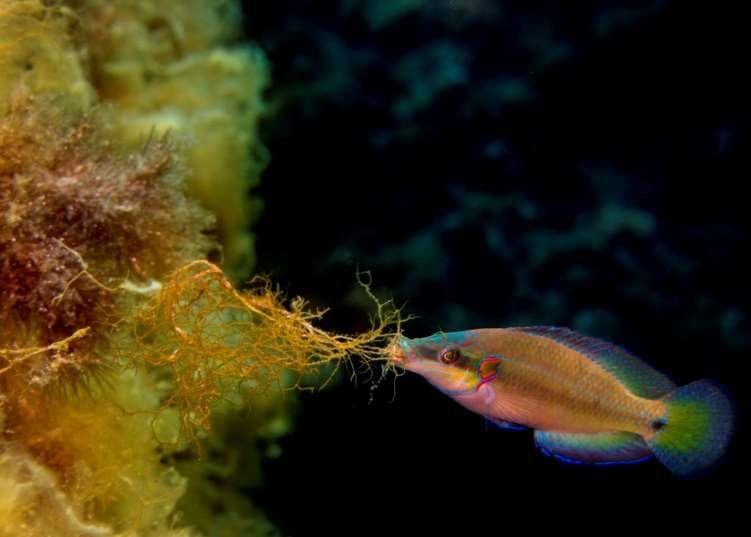
4 Monitoring ocean acidification is now starting in SE Asia
5


6 Problem.. Last IPCC report says that we do not yet know what the ecological effects will be as it is difficult to scale-up from laboratory experiments. Solution.. Areas with naturally high CO 2 can help show ecosystem responses to ocean acidification
7 Ecosystem effects of ocean acidification and warming We have new data on 100s of species including Bacteria, Cyanobacteria, Diatoms, Coccolithophores, Seaweeds, Seagrasses, Sponges, Corals, Polychaetes, Crustaceans, Molluscs, Echinoderms & Fish

8 Hall-Spencer et al Nature

9 Coastal CO 2 seeps worldwide


10
11 Fish reproduction is affected by acidification Paternity tests of the eggs show that sneaker males were less successful at high CO 2 (Milazzo et al Proc Roy Soc)

12 Fish reproduction is affected by acidification


13 Large increase in diatom productivity on slides, on rock and on sediment. Not much increase in cyanobacteria until extremely high CO 2 levels Johnson VR et al. (2015) J. Mar. Sci. Eng. 3,

 Nature Climate Change Allen et al.")
14 Recruitment from the plankton severely disrupted at high CO 2 Cigliano et al. (2010) Marine Biology, Smith et al. (2016) Nature Climate Change Allen et al. (2017) Mar. Poll. Bull.
15 increase Atmospheric CO 2 and seawater ph are linked by the 'carbonate chemistry system' Ocean acidification is not just ph change It is a multiple stressor

16 increase Atmospheric CO 2 and seawater ph are linked by the 'carbonate chemistry system' increase increase decrease Increased DIC can be a resource for primary producers. Decreased carbonate saturation can corrode shells and skeletons.

 Nature Climate")
17 OA mediates biodiversity shifts via biogenic habitat modifications Sunday et al. (2017) Nature Climate Change
18 Seagrass is carbon limited; it grows well at the seeps
")

19 Russell BD et al. (2013) Marine Pollution Bulletin 73,
 Biology")
20 Martin et al. (2008) Biology Letters

21 We used δ13c values as a proxy for CO 2 :HCO 3- use Porzio et al J Exp Mar Biol Ecol Cornwall et al. (2017) Scientific Reports
 Is Climate")


22 Garilli et al. (2015) Is Climate Change Making Animals Smaller? Metabolism, Reproduction and Growth are adversely affected by stress


23 High CO 2 High CO 2 plus warming Warming makes many organisms more susceptible to ocean acidification (Rodolfo-Metalpa et al Nature Climate Change)

24 Shikine-jima
 Sci Rep 300 ppm 350 ppm 450 ppm 450 ppm 2000")
25 CO 2 seeps at Shikine-Jima Agostini et al. (2018) Sci Rep 300 ppm 350 ppm 450 ppm 450 ppm 2000 ppm 900 ppm

26 Carbonate chemistry Complexity Rugosity of physical substrata Chain method Canopy height every 50 cms along 100m transects % Cover Photosampling method


27 Using computed tomography (CT) scanning, we measured the thickness, density and structure of the shells. Shell thickness was halved in areas with raised CO2 while average shell length was reduced from 178 mm in sites with present day levels to 112 mm. In some cases, body tissue exposed, with the corrosive effects of acidification far more pronounced around the oldest parts of the shell. Harvey et al Frontiers in Marine Science


28 300 ppm 300 ppm September ppm ppm May 2017 >900 ppm >900 ppm

29 Present day CO 2 levels

30 CO 2 levels 900 ppm in 2090 BAU
 June surveys N=90 transects September surveys N=45 transects Baited Underwater Videos systems (BUVs) 2 sites (900 ppm vs 300 ppm) September surveys N=")
31 Fish assemblages are affected by biogenic habitat shifts Underwater Visual Censuses (UVC) 3 sites along the gradient (from 1200 to 500 ppm) and 2 ambient sites (300 ppm) June surveys N=90 transects September surveys N=45 transects Baited Underwater Videos systems (BUVs) 2 sites (900 ppm vs 300 ppm) September surveys N= 12


32 Ambient CO 2 Canopy Corals Fish diversity Fish abundance 900 ppm CO 2 In 2090 if follow BAU Total of ca. 70 fish spp. 94% in Ambient CO 2 only 56% in Elevated CO 2
33 Current cuts are not enough! CO 2 emissions Δ sea surface temperature ( o C) Δ surface ocean ph Present day RCP NDCs* 2.0 to to RCP Paris World NDCs BAU Global mean values in relative to *Nationally Determined Contributions from Climate Action Tracker and Climate Interactive Amended from Magnan et al (2016) Nature Climate Change


34 Can we produce a 4-page information pamphlet, tailored to Japanese and/or Asian stakeholders?