Analysis of Runoff Impact by Land Use Change Scenarios in an Urbanizing Watershed Using SWAT Model
|
|
|
- Amanda Anderson
- 5 years ago
- Views:
Transcription
1 2012 SWAT International Conference Analysis of Runoff Impact by Land Use Change Scenarios in an Urbanizing Watershed Using SWAT Model July 20, 2012 YU, Young-Seok* Graduate Student KIM, Sang-Ho / LEE, Joon-Woo PhD Candidate / Researcher KIM, Seong-Joon Professor
2 Contents Introduction Land Use Change model, CLUE-s The Future Land Use scenarios SWAT Calibration and Validation The Impact on Watershed Hydrology Conclusion
3 Urban Role in World Mess 2% 2 % of world s surface area is made up by cities. 80 % of world s economic output is produced by cities. Cities are responsible for more than 70% of global greenhouse gas emissions. Cities account for % of the world s energy consumption. 200 yrs ago, just 3 of 100 lived in cities. In 2020, 80 % of the population in developed counties and 51 % in developing counties will live in cities. 80% THE TIMES OF INDIA NEW DELHI WEDNESDAY, JULY 18, 2012


4 The cities, Seoul & others South Korea Ilsan Uijeongbu Incheon Gwacheon SEOUL Anshan Suwon Dongtan Osan Seongnam Pangyo Anseong (Study area) Cheonan Satellite Town New Town Sejong Administration City
5 Purpose of this Study In South Korea, half of the populations (25 million) lives in and near around Seoul metropolitan area. For decades, the urbanization has been progressed with Seoul as the center of politics, economy, culture, and education etc. As Seoul has been already saturated, the government has tried to build new cities as a satellite function. Notwithstanding those efforts, because there are still many problems to be solved, recently the government determined to move the administration function to other place (Sejong) from Seoul by the political decision. Seoul has been expanding mainly to the South direction. The study area, Anseong is located between Seoul and Sejong. We try the possible land use changes of future Anseong and evaluate the hydrologic impacts of the area.
6 Flowchart of this study Study Watershed Anseong-Cheon Urbanizing watershed (5.7 % of km 2 ) (urban of the total area) Landsat Landuse data 1975, 1980, 1985, 1990, 1995, 2000 Meteorological Data Weather Data AWS Rainfall Data Observed Data Streamflow (Gongdo) Outflow (2 reservoirs) SWAT Model Setup GIS Data DEM (30m) NGIS Land use (30m) ME 1:50,000 Soil (30m) KRDA 1:25,000 Calibration( ) / Validation( ) CLUE-s model Driving Factors Aspect, DEM, Distance to highway, Distance to local road, Distance to national road, Slope, Soil depth, Soil group, Soil type Land use Demand Prediction of Land use Statistical Analysis Future Land use change Impact Assessment Hydrological responses - evapotranspiration, streamflow, groundwater, surface runoff Comparison of impacts between subwatersheds Prediction of Future Land use 2040s, 2080s

7 Study Area China Suwon Icheon Weonsam South Korea Japan Gosam Water level Gong-Do Station / Outlet Yangseong Anseong Geumgwang Seoun Watershed area : km 2 Annual average precipitation : 1,231 mm Annual average temperature : 11.7 Urban area : 5.7 % (20.4 km 2 ) Cheonan


8 Study Area 2020 LU plan by LC 2020 s Anseong Urban Planning Yongin Jungbu Highway Icheon Hwaseong Anseong Anseong 1~4 Industrial park Pyeongtaek-Eumseong Highway Eumseong Pyeongtaek Gyeongbu Highway 20km Cheonan Jincheon 40km 60km

9 Land Use Change Prediction Model CLUE-s (Conversion of Land Use and its Effects) The Conversion of Land Use and its Effects at Small regional extent(clue-s) was developed to simulate land use change. The model is subdivided into two distinct modules, namely a non-spatial demand module and a spatially explicit allocation procedure. The non-spatial module calculates the area change for all and use types The spatial module are translated in to land use changes at different locations with in the study region <case study> - Oh et al. (2010) : Prediction of paddy field change based on climate change scenarios using the CLUE model, Paddy and Water Envion. - Park et al. (2011) : Assessment of MIROC3.2 Hires climate and CLUE-S land use change impacts on watershed hydrology using SWAT, Trans. ASABE


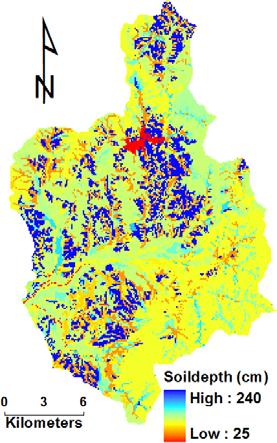

10 CLUE-s data Driving Factors
11 CLUE-s regression results The probability maps of each land use type were prepared from the logistic regression results. Forward stepwise logistics regression and relative operating characteristics analysis between 6 land use types and 9 driving factors. Driving Factor Land Use Type Water Urban Bare Field Grass Forest Agriculture Aspect DEM Distance to Highway Distance to Local road Distance to Nat l road Slope Soil depth Soil group Soil type Constant
12 The past land uses (Baseline) The past land use changes by suing Landsat image classification The expanding urban area (red color)
13 Three Land use Change Scenarios Past Future Predict future land use changes Using 3 possible scenarios (Logarithmic, Linear, Exponential)
 Exponential (High) 2040s 2000 (Baseline)")
14 2040s & 2080s spatial land uses Year Logarithmic (Low) Linear (Medium) Exponential (High) 2040s 2000 (Baseline) 2080s
15 2040s & 2080s Land uses summary km 2 (%) Scenarios Water Urban Bare field Grass Forest Agriculture Past (-2.1) 9.9 (-51.5) 2.6 (-70.2) 6.2 (-62.9) (+3.0) (+28.5) Baseline Logarithmic (Low) Linear (Medium) Exponential (High) (+0.0) 30.9 (+51.4) 24.6 (+101.5) 46.9 (+180.4) (-15.8) (-19.7) (+0.0) 32.9 (+61.2) 40.0 (+227.6) 73.8 (+341.1) (-27.5) 78.8 (-38.3) (+0.0) 42.7 (+109.0) 24.6 (+101.5) 46.9 (+180.4) (-14.7) 88.7 (-30.5) (+0.0) 65.4 (+220.1) 40.0 (+227.6) 73.8 (+341.1) (-29.8) 50.4 (-60.5) (+0.0) 44.6 (+118.5) 24.6 (+101.5) 36.9 (+120.6) (-15.8) 98.7 (-22.6) (+0.0) 90.8 (+344.7) 25.0 (+104.8) 43.8 (+161.7) (-41.0) 89.7 (-29.7)
 Linear 2040s (Medium) Exponential 2040s (High) 58.9 59.9 59.6 62.")
16 2040s & 2080s SCS Curve Number Curve Number CN : Logarithmic 2040s (Low) Linear 2040s (Medium) Exponential 2040s (High) Logarithmic 2080s (Low) Linear 2080s (Medium) Exponential 2080s (High)


17 SWAT Model SWAT (Soil and Water Assessment Tool) SWAT is a continuous, long-term, and distributed-parameter model designed to predict the impact of land management practices on the hydrology. SWAT subdivides a watershed into sub-basin connected by a stream network, and further delineates HRUs (hydrologic Response Unit) Consisting of unique combinations of land cover and soils within each sub-basins Reservoir water balance V = V stored + V flowin V flowout + V pcp V evap V seep V flowout = q out [runoff ratio, m 3 /s] (m 3 H 2 O)

18 Preparation of input data Data Set Source Scale Properties DEM Korea National Geography Institute 1/5,000 Digital Elevation Model (DEM) ; 100 X 100 m Soil Korea Rural Development Administration 1/25,000 Soil classifications and physical properties such as bulk density, texture, and saturated conductivity. Land use Landsat TM Satellite Image in m Land use classifications such as paddy, grass, and forest. Land Use Soil type DEM


19 Two agricultural reservoirs included in SWAT SWAT reservoir operation Daily release data for the two reservoirs were used. ( ) Gosam reservoir Total storage : 16, m 3 Usable storage : 15, m 3 Area of full water : 2.79 km 2 Benefit area : 29.8 km 2 Geumgwang reservoir Total storage : 12, m 3 Usable storage : 12, m 3 Area of full water : 1.51 km 2 Benefit area : 19.3 km 2
20 SWAT Calibration and Validation Calibration period : / Validation period : Calibration Validation Evaluation criteria Statistic RMSE (mm/d) Calibration Validation Avg R NSE
21 Future Impact on Watershed Hydrology Sub Watersh ed (km 2 ) 2000 (Baseline) 1 (66.2) (-10.4) 2 ( 6.3) (-6.9) 3 (13.9) (-2.3) 4 (24.9) (-4.7) 5 (36.3) (+2.2) 6 (47.2) (-3.2) 7 (17.8) (+1.1) 8 (74.4) (-0.1) 9 ( 7.4) (+0.3) 10 (5.6) (+3.1) Logarithmic (Low) Curve Number Value Linear (Medium) Exponential (High) 2040s 2080s 2040s 2080s 2040s 2080s 45.0 (-11.1) 57.4 (-10.3) 59.4 (-5.0) 50.5 (-8.5) 68.7 (+3.7) 54.1 (-4.9) 64.5 (+2.1) 61.4 (-0.6) 74.1 (+1.3) 75.0 (+4.1) 68.8 (+3.3) 45.7 (-10.4) 60.8 (-6.9) 62.1 (-2.3) 53.8 (-5.2) 67.2 (+2.2) 55.8 (-3.2) 63.5 (+1.1) 61.9 (-0.1) 73.1 (+0.3) 74.0 (+3.1) 42.9 (-13.2) 56.5 (-11.2) 59.3 (-5.1) 50.2 (-8.8) 68.7 (+3.7) 54.4 (-4.6) 64.8 (+2.4) 63.0 (+1.0) 72.4 (-0.4) 74.2 (+3.3) 68.7 (+3.2) 47.5 (-8.6) 61.2 (-6.5) 65.8 (+1.4) 57.1 (-1.9) 67.6 (+2.6) 57.2 (-1.8) 64.1 (+1.7) 61.9 (-0.1) 74.6 (+1.8) 75.2 (+4.3) 45.2 (-10.9) 60.2 (-7.5) 68.8 (+4.4) 58.3 (-0.7) 71.6 (+6.6) 57.5 (-1.5) 66.9 (+4.5) 66.2 (+4.2) 73.4 (+0.6) 76.3 (+5.4) 71.7 (+6.2) 11 (60.4) (+2.2) 67.7 (+2.2) 68.3 (+2.8) Average

22 Future Impact on Watershed Hydrology Subwatershed 6 Runoff ratio : %, Exponential 58.2% Subwatershed 7 Runoff ratio : %, Exponential 56.4%
23 Future Impact on Watershed Hydrology Predicted hydrologic components Surface Runoff, Groundwater Recharge Surface Runoff (mm) -2.3 % +5.4 % % Groundwater Recharge (mm) +0.5 % -1.3 % % Logarithmic (Low) Linear (Medium) Exponential (High)
24 Future Impact on Watershed Hydrology Predicted hydrologic components Evapotrasspiration, Streamflow Evapotranspiration (mm) -0.2 % -1.6 % -1.3 % +0.1 % +1.1 % +1.2 % Streamflow (mm) Logarithmic (Low) Linear (Medium) Exponential (High)
25 Future Impact on Watershed Hydrology Years (Baseline) Logarithmic (Low) Linear (Medium) Exponential (High) 2040s 2080s 2040s 2080s 2040s 2080s Curve number 57.1 (-1.8) ET (mm) (+0.7) Surface Runoff (mm) (-0.5) Groundwater Recharge (mm) (-0.8) Streamflow (mm) (-0.5) (+0.0) 59.9 (+1.0) 59.1 (+0.2) 59.6 (+0.7) 60.7 (+1.8) 62.5 (+3.6) (-0.2) (-0.3) (-0.9) (-2.1) (-0.7) (-1.9) (-0.9) (-3.7) (+1.0) (+4.3) (+5.2) (+22.6) (-1.2) (+2.3) (-1.2) (-1.4) (-6.0) (-16.6) (+0.1) (+0.1) (+0.7) (+1.5) (+0.6) (+1.6)
26 Conclusion For the 3 scenarios of future land use, the followings are the key summaries for the study watershed. Land Use Change Scenario Curve Number Urban Area (km 2 ) Surface Runoff (mm) Groundwater Recharge (mm) 2000 (Baseline) Logarithmic (Low) Linear (Medium) Exponential (High) 2040s 58.9 (+0.0) 30.9 (+51.4) (-0.9) (-1.2) 2080s 59.9 (+1.0) 32.9 (+61.2) (-3.7) (+2.3) 2040s 59.1 (+0.2) 42.7 (+109.0) (+1.0) (-1.2) 2080s 59.6 (+0.7) 65.4 (+220.1) (+4.3) (-1.4) 2040s 60.7 (+1.8) 44.6 (+118.3) (+5.2) (-6.0) 2080s 62.5 (+3.6) 90.8 (+344.7) (+22.6) (-16.6) For the whole watershed, the linear scenario seems marginal. The exponential scenario should be escaped. If we look at the subwatershed scale, even logarithmic, the subwatersheds 5, 7, 10, 11 become more vulnerable for flood and stream baseflow.
27 Thank You For further information, please contact: Yu, Young Seok Master Course, Dept. of Rural Engineering, Konkuk University Dr. Kim, Seong Joon Professor, Dept. of Civil & Environmental System Engineering, Konkuk University We re on the Web! See us at: Earth Information Engineering Laboratory