AoH Report Update. Joint DEJF & AoH Meeting, Las Vegas November 15-18, Air Resource Specialists, Inc.
|
|
|
- Pamela Wheeler
- 5 years ago
- Views:
Transcription
1 AoH Report Update Joint DEJF & AoH Meeting, Las Vegas November 15-18, 2004 Air Resource Specialists, Inc.
2 Overview WRAP Strategic Plan, Phases 1 & 2 Review of Phase I report structure Review of Phase I data sets Review of products generated to date
3 WRAP Strategic Plan Purpose: Scale: Apportionment: Strategies: Communication: Major State/Tribal submittals: Regional. Phase I Dry run for Phase II. 96/02 source contributions. Areas each plan to address. Identify options, screen. Public education emissions inventory. Phase II Refine and apply Phase I approaches for SIP/TIP purposes. Regional and subregional source contributions. Reduction obligations. Cost/benefit, select, design. Public acceptance. Modeling run specifications.
4 AoH Phase I Report Structure Summary Report (Hardcopy and Web-based) Supporting Reports (Web-based)

5 AoH Phase I Web Page
6 AoH Phase I Data Sets Emissions Inventories EPA 2002 NEI not available until 12/05; WRAP facilitated development of interim 2002 Emissions Modeling Data RMC to present TSSA results Thursday (11/18) Monitoring Data IMPROVE aerosol data available. DRI to present regression analysis results Wednesday (11/17)
7 2002 Emissions Data Point and Area includes U.S., Can., Mex. Mobile (On-Road & Non-Road) Road Dust (Paved & Unpaved) U.S., Can., Mex estimated emissions VOC, NOx, PM2.5 and SO2 overestimated for off-road CA provided estimates directly, so these errors don t apply to CA Fire WRAP states only Actual 2002 wildland and prescribed fire emission inventories Windblown Dust Modeling domain Modeled emissions Biogenics U.S. Modeled emissions Modeling Domain Boundary Conditions
8 WRAP States NO X Emissions WRAP NO X Emissions Summary tons/yr 1,400,000 1,200,000 1,000, , ,000 Biogenics Road Dust Non-Road Mobile On-Road Mobile Fires Area Point 400, ,000 0 AZ CA CO ID MT NV NM ND OR SD UT WA WY
9 WRAP States SO 2 Emissions WRAP SO 2 Emissions Summary tons/yr 300, , , ,000 Biogenics Road Dust Non-Road Mobile On-Road Mobile Fires Area Point 100,000 50,000 0 AZ CA CO ID MT NV NM ND OR SD UT WA WY
10 California Emissions Comparison EI comparison: WRAP interim 2002 and CA reported 2003 Differences in EI reporting: Differences in point and area binning CA reports reactive organic gases (ROG), WRAP reports volatile organic compounds (VOC) - specific pollutants differ in some cases CA reports SOx, WRAP reports SO2 EI comparison reasonable, consistent with known differences
11 California Emissions Comparison California 2002 "Interim" vs Reported Emissions 1,400 Thousand Tons/Year 1,200 1, Road Dust Off-Road Mobile On-Road Mobile Fires Area Point NOX Interim NOX Reported VOC Interim ROG Reported SO2 Interim SOX Reported PM2.5 Interim PM2.5 Reported PMC Interim PMC Reported
12

13

14
15
 Sequoia NP (CA)")
16 Redwood NP (CA) Spokane Indian Reservation (WA) Sequoia NP (CA) Sawtooth W (ID)

17 Rocky Mountain NP Haze Simulation Based on 20% Worst Days, 2002 Based on 20% Worst Days, 2002

18 Yosemite NP Haze Simulation Based on 20% Worst Days, 2002 Based on 20% Worst Days, 2002

19 Grand Canyon NP Haze Simulation Based on 20% Worst Days, 2002 Based on 20% Worst Days, 2002
20 2002 WRAP Species Extinction Sulfate Nitrate Organics Coarse Mass
 Same general patterns Different colors due to differences in")
21 2002 WRAP Extinction and Deciviews Aerosol Extinction Deciviews Both maps based on the same data (deciview map includes Rayleigh scattering for deciview calculation) Same general patterns Different colors due to differences in scales
22 Two Interpolation Methods 1/R 2 Method Kriging Method The 1/R 2 method tends to generate islands around monitoring sites; probably more applicable to AoH needs The Kriging method generates patterns where there are no monitoring sites, inferring values that may not be real (northern WY, northern UT)
23 Sulfate Mass and SO 2 Emissions SO2 Emissions (tons/year) ,000 1,000-1,500 1,500-2,000 2,000-2,500 2,500-3,000 3,000-3,500 3,500-4,000 4,000-4,500 4,500-5,000 5,000-5,500 5,500-6,000 >6,000 Sulfate Mass SO 2 Emissions Hot spots of SO 2 emissions do not correspond with measured hot spots of sulfate mass
24 Nitrate Mass and NO X Emissions NOX Emissions (tons/year) 1,000-2,000 2,000-3,000 3,000-4,000 4,000-5,000 5,000-6,000 6,000-7,000 7,000-8,000 8,000-9,000 9,000-10,000 10,000-11,000 11,000-12,000 12,000-13,000 >13,000 Nitrate Mass NO X Emissions Hot spots of NO X emissions do not correspond with measured hot spots of nitrate mass
25 Coarse Mass and Coarse Mass Emissions PMC Emissions (tons/year) ,000 1,000-1,250 1,250-1,500 1,500-1,750 1,750-2,000 2,000-2,250 2,250-2,500 2,500-2,750 2,750-3,000 3,000-3,250 >3,250 Coarse Mass Coarse Mass Emissions Hot spots of coarse mass emissions do not correspond with measured hot spots of coarse mass

26 Sample State Emissions Summary for NOx State map with 36 x 36 km gridded emissions Brief text description of NOx Breakdown of statewide NOx emissions by source type
27 The following TSSA results do not represent a full year and should not be used to draw final conclusions!

28 Sample Raw TSSA and Trajectory Regression Results Tagged Species Source Apportionment TSSA attributes to Point and Mobile, WRAP states, eastern U.S., others Trajectory Regression attributes to various states, quadrants, others (unique by site) Some grouping must be done to compare results 0.2% 19% 3.1% 2.9% Trajectory Regression
29 Sample Raw TSSA and Trajectory Regression Results TSSA attributes to Point and Mobile, WRAP states, eastern U.S., others Trajectory Regression attributes to various states, quadrants, others (unique by site) Some grouping must be done to compare results 35% 30% 25% 20% 15% 10% 5% 0% 35% 30% 25% 20% 15% 10% 5% 0% CO CO WY WY Source Attribution Comparison for SO 4 at Rocky Mountain National Park, CO Point Sources Mobile Sources UT AZ CMAQ Tagged Specied Source Apportionment (TSSA) NM ID MT OR WA In the current CMAQ modeled analysis, source attribution is defined only for mobile and point source emissions. SO 4 not attributed to mobile or points sources is labeled "Other". Emissions not included in the identified categories are grouped as "Rest". NE Colorado SE Colorado SW Colorado NW Colorado UT AZ NM OK CA NV ND SD Trajectory Regression Analysis KS NB Trajectory regression analysis attributes monitoring results using back trajectories and residence times. NWUS SWUS SEUS NEUS East Canada Canada Mexico Mexico Pacific Coast Initial Conditions Pacific Ocean Boundary Conditions Other Gulf Rest Atlantic
30 Sample Comparison for Rocky Mountain NP 35% 30% 25% 20% 15% Source Attribution Comparison for SO 4 at Rocky Mountain National Park, CO Boundary States 57% Point Sources Mobile Sources CMAQ Tagged Specied Source Apportionment (TSSA) US Regions 14% International 0% Other Sources 29% Review similarities and differences between regions CO indicated as major contributor in both methods Gray bars represent categories that do not correspond between methods 10% 5% 0% CO WY UT AZ NM ID, MT, OR, WA In the current CMAQ modeled analysis, source attribution is defined only for mobile and point source emissions. SO 4 not attributed to mobile or points sources is labeled "Other". Emissions not included in the identified categories are grouped as "Rest". 35% 30% 25% 20% 15% 10% 5% 0% CO WY Boundary States 44% UT AZ NM CA, NV East Canada Trajectory Regression Analysis ID, MT, OR, WA US Regions 27% CA, NV East Mexico International 5% Canada Mexico Initial Pacific Coast Boundary Other Other Sources 24% Pacific Ocean Gulf Rest Atlantic Trajectory regression analysis attributes monitoring results using back trajectories and residence times. Categories in grey do not directly correspond to categories listed in CMAQ TSSA analysis.
31 Sample Comparison for Mesa Verde NP 35% 30% 25% 20% 15% Source Attribution Comparison for SO 4 at Mesa Verde National Park, CO Boundary States 74% Point Sources Mobile Sources CMAQ Tagged Specied Source Apportionment (TSSA) US Regions 7% International 0% Other Sources 19% NM indicated as major contributor by TSSA 4 states indicated as equal contributors by Trajectory Regression 10% 5% 0% CO WY UT AZ NM ID, MT, OR, WA In the current CMAQ modeled analysis, source attribution is defined only for mobile and point source emissions. SO 4 not attributed to mobile or points sources is labeled "Other". Emissions not included in the identified categories are grouped as "Rest". 35% 30% 25% 20% Boundary States 60% CA, NV East Canada Trajectory Regression Analysis US Regions 7% Mexico International 10% Initial Boundary Other Other Sources 22% Rest 15% 10% 5% 0% CO WY UT AZ NM ID, MT, OR, WA CA, NV East Canada Mexico Pacific Coast Pacific Ocean Gulf Atlantic Trajectory regression analysis attributes monitoring results using back trajectories and residence times. Categories in grey do not directly correspond to categories listed in CMAQ TSSA analysis.

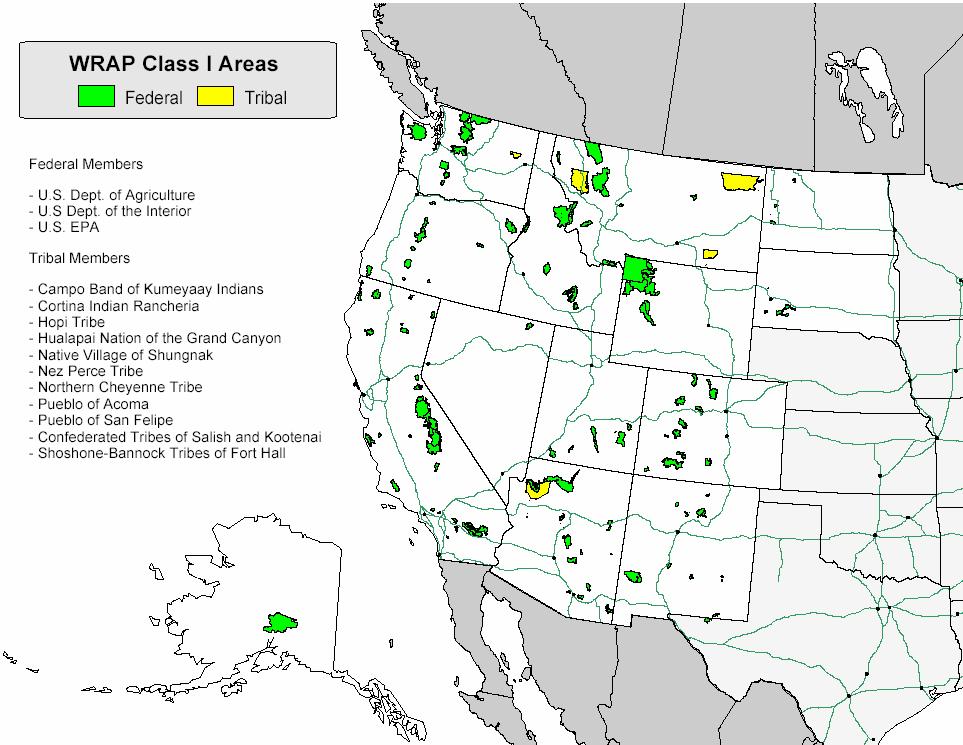
32 Sample Regional Grouping of CIAs

33 Sample Regional Emissions, Mass, Extinction Summary Lower left map identifies CIAs and major NOx and SO2 source region Upper pie displays mass regional mass budget Lower right pie displays regional extinction budget (also expressed in deciviews)
34 Assessment of Class I Areas Tagged Species Source Apportionment from Colorado to indicated Class I Areas Affected by CO Emissions NO3 SO4 EC Mount Zirkel W Mesa Verde NP Rocky Mountain NP Great Sand Dunes NP Maroon Bells- Weminuche W Canyonlands NP Chiricahua NM Saguaro NP - West Saguaro NP - East Superstition W Mazatzal W Salt Creek W White Mountain W San Pedro Parks W Bandelier NM Bosque del Apache W Gila W Badlands NP Wind Cave NP CO UT AZ NM SD Concentration (ug/m3)
35 Next Steps DRI and RMC to present results (Wed./Thu.) ARS to review report details with AoH (Thu.) Synthesize all Trajectory Regression and TSSA results Set schedule with AoH subcommittee to review report sections Draft report to AoH by mid-december