Draft Lake Winona TMDL Phase 1 Report Data Summary and Modeling Strategy
|
|
|
- Dinah Meagan Ward
- 5 years ago
- Views:
Transcription

1 Draft Lake Winona TMDL Phase 1 Report Data Summary and Modeling Strategy Prepared for: Minnesota Pollution Control Agency 520 Lafayette Road North St. Paul, Minnesota Prepared by: Earth Tech, Inc Campus Drive North, Suite E290 Minneapolis, Minnesota April 2008


2


3

4

5
6
7
8
9

10
11
12
13
14
15
16
17
18
19
20
21
22
23
24
25
26
27
28
29
30
31
32
33
34
35
36
37
38
39
40
41
42
43
44 DRAFT LAKE WINONA TMDL PHASE 1 REPORT DATA SUMMARY AND MODELING STRATEGY April 2008 Prepared for: Minnesota Pollution Control Agency 520 Lafayette Road North St. Paul, Minnesota Prepared by: Earth Tech, Inc Campus Drive North, Suite E290 Minneapolis, Minnesota 55441
45 Draft Lake Winona TMDL Phase 1 Report Data Summary and Modeling Strategy Minnesota Pollution Control Agency TABLE OF CONTENTS Section Page 1.0 PROJECT OVERVIEW INTRODUCTION PROJECT GOALS EXISTING DATA REVIEW SOURCES OF DATA LAKE WINONA WATER QUALITY DATA Overview Data Review LAKE AGNES AND HENRY DATA LAKE MORPHOMETRY DATA WATERSHED DATA ALASD WWTP DATA WATER BUDGET AND LAKE LEVEL DATA DATA QUALITY COMPARATIVE LAKE DATA DISCUSSION OF NUTRIENT IMPAIRMENT RECOMMENDATIONS PROPOSED MODELING STRATEGY AND SELECTION OVERVIEW LAKE MODELS CONSIDERED LAKE MODEL CALIBRATION AND VALIDATION WATERSHED MODEL RECOMMENDATIONS RECOMMENDATIONS FOR ADDITIONAL MONITORING OVERVIEW LAKE SAMPLING STORMWATER SAMPLING Screening Program Comprehensive Program LAKE WINONA BATHYMETRIC MAP LAKE WINONA SOFT SEDIMENT QUANTIFICATION MACROPHYTE SURVEY REFERENCES L:\WORK\MPCA\104084\WP\LAKE WINONA DATA SUMMARY REPORT FINAL.DOC i April 2008
46 Draft Lake Winona TMDL Phase 1 Report Data Summary and Modeling Strategy Minnesota Pollution Control Agency LIST OF FIGURES Figure Follows Page 1-1 Project Location Map Sample Location Map South Lake Winona Total Phosphorus North Lake Winona Total Phosphorus Lake Winona Seasonal Total Phosphorus Trend ALASD WWTP Annual Phosphorus Loading Lake Winona Total Phosphorus Trend Lakes Agnes and Henry Total Phosphorus Trend Comparison of Lake Winona Total Phosphorus with ALASD Phosphorus Loadings Mean Annual Total Phosphorus, Lakes Winona, Agnes, and Henry... 7 Appendix LIST OF APPENDICES A B C D E Water Quality Data Summaries for Lakes Winona, Agnes, and Henry Water Quality Data Plots for Lakes Winona, Agnes, and Henry Existing Lake Winona Bathymetric Map DNR Lake Level Summaries for Lakes Winona, Agnes, and Henry Chloride Data Summary L:\WORK\MPCA\104084\WP\LAKE WINONA DATA SUMMARY REPORT FINAL.DOC ii April 2008
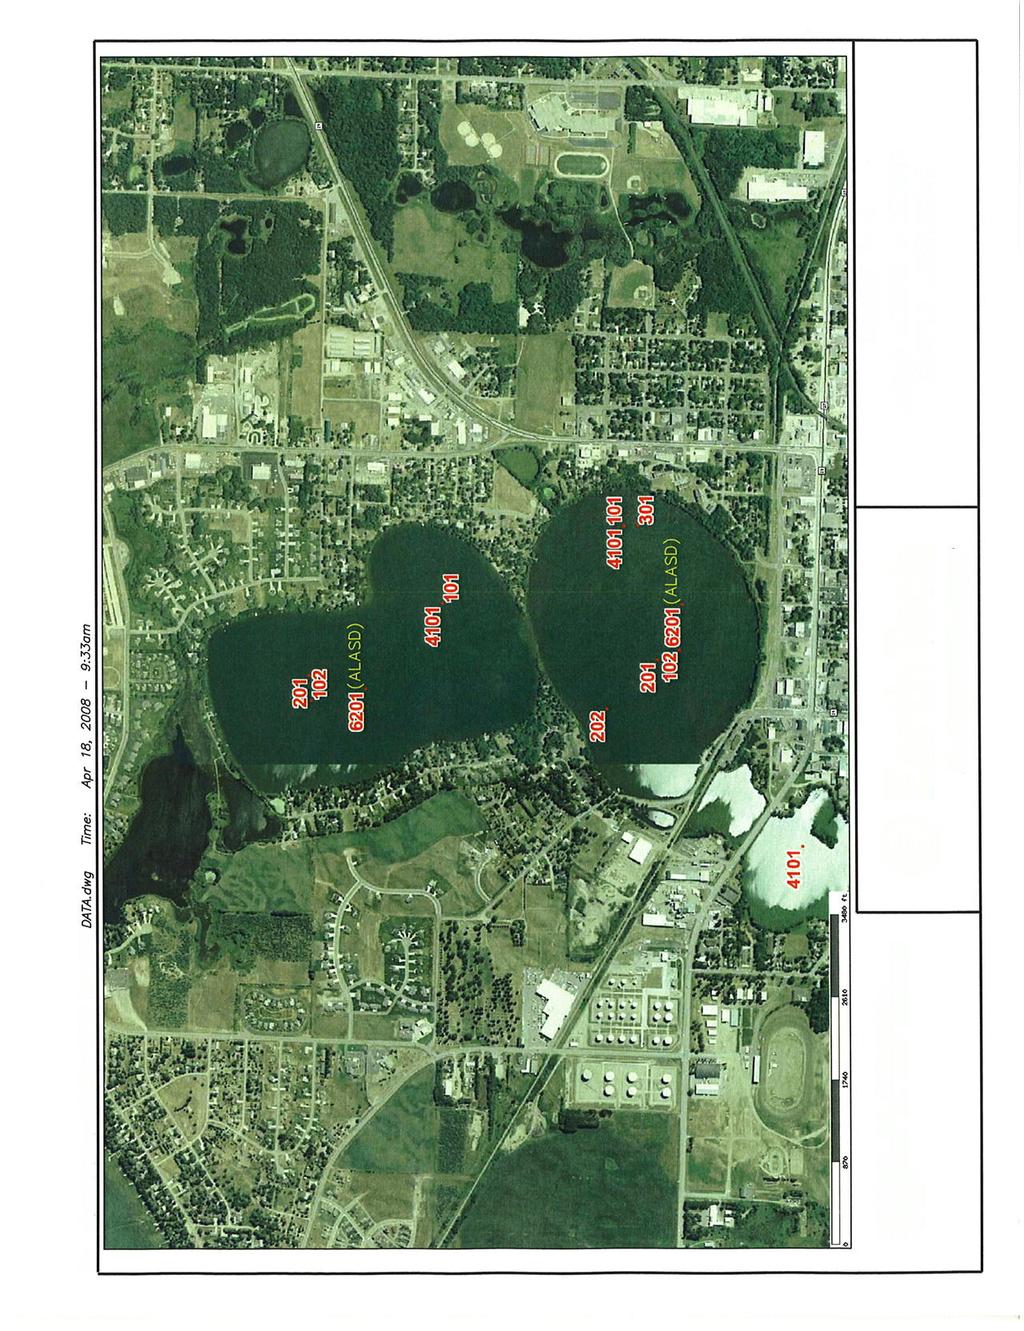
47 Draft Lake Winona TMDL Phase 1 Report Data Summary and Modeling Strategy Minnesota Pollution Control Agency 1.0 PROJECT OVERVIEW 1.1 INTRODUCTION The purpose of Phase 1 of the Lake Winona Total Maximum Daily Load (TMDL) Project (Project) is to review and summarize existing data supporting the establishment of a nutrient (phosphorus) TMDL for Lake Winona. It also involves reviewing existing data for Lakes Agnes and Henry, which receive the outflow from Lake Winona and whose water quality is directly influenced by the quality of water leaving Lake Winona. The three lakes whose locations are shown on Figure 1-1, are locally known as the Agnes, Henry, Winona (AHW) chain of lakes. Data being reviewed and summarized includes water quality and lake morphometry data for the three lakes, hydrology, water level and watershed data, and data for the Alexandria Lake Area Sanitary District (ALASD) wastewater treatment plant discharge to Lake Winona. The review will identify data categories where there is sufficient data to complete the TMDL process. It will also identify data categories where there are data gaps where more information is needed. Furthermore, for the data gaps, recommendations will be made regarding additional studies to provide the information needed. Lake Winona was listed as an impaired water body (Section 303(d) of the federal Clean Water Act) due to excess nutrients, particularly phosphorus. It is a shallow lake, with a mean depth of 4 feet, located in the North Central Hardwoods Ecoregion. The City of Alexandria lies on the lakes east and north sides, with the Alexandria airport and suburban lands on the south and west. The ALASD wastewater treatment plant (WWTP) discharges to the south end of Lake Winona. Past studies, along with land use patterns, have led to the conclusion that the ALASD WWTP discharge and urban runoff are the primary sources of nutrients entering Lake Winona. It is also believed, given that the lake is a shallow lake, wind will keep the lake water relatively well mixed, resulting in nutrients being mobilized into the water column from the bottom sediments of the lakes. 1.2 PROJECT GOALS A detailed description of the project goals and technical issues is found in the work plan for the Lake Winona TMDL project (Minnesota Pollution Control Agency (MPCA), December 2007; expanded by Earth Tech, Inc. (Earth Tech), February 2008). In summary, the goals of the Project are as follows: (1) To review existing data to determine data categories for which sufficient data exists and to identify data gaps, (2) For data gaps identified, recommend addition data collection activities, (3) To verify the nutrient impairment, (4) Upon verification of the impairment, implement a TMDL study to allocate watershed sources of total phosphorus, (5) In cooperation with project partners, develop a TMDL implementation plan to rehabilitate Lake Winona to compliance with Minnesota water quality rules, and (6) During the course of developing a nutrient TMDL for Lake Winona assess how improvements to Lake Winona will affect the water quality of Lakes Agnes and Henry. A goal separate from the TMDL goals is to assess available chloride data and determine the course of action needed to determine the potential affects of chlorides being discharged in wastewater and stormwater on the quality of Lakes Winona, Agnes, and Henry. L:\WORK\MPCA\104084\WP\LAKE WINONA DATA SUMMARY REPORT FINAL.DOC 1 April 2008
48 Draft Lake Winona TMDL Phase 1 Report Data Summary and Modeling Strategy Minnesota Pollution Control Agency 2.1 SOURCES OF DATA 2.0 EXISTING DATA REVIEW Earth Tech compiled and reviewed data from a wide variety of sources, most significantly data from the Alexandria Lake Area Sanitary District (ALASD) and MPCA. However, other data sources used for this study include the Department of Natural Resources (MDNR), the City of Alexandria, Alexandria Light and Power, Douglas County, and citizen monitoring. Reports relevant to the Project have also been collected, including the Agnes-Henry-Winona Clean Lakes Project Diagnostic Study and Implementation Plan completed in 1994 (Widseth Smith Nolting, 1994), and the more recent Lake Le Homme Dieu Water Quality Study sponsored by ALASD (Wenck Associates, 2002), which contains information related to Lake Winona. The primary source of water quality for this project is ALASD, which has been collecting lake quality data for many years. Furthermore, the National Pollution Discharge Elimination System (NPDES) permit held by ALASD requires the district to monitoring its discharge to Lake Winona. Earth Tech has received the ALASD data in the form of Excel spreadsheet based databases from both MPCA and ALASD. Data from the Clean Lakes Project (WSN, 1994) and older was contained in the information provided by MPCA. The databases received contain the test results but, for the most part, did not contain Quality Assurance/Quality Control information that typically accompanies lab reports. 2.2 LAKE WINONA WATER QUALITY DATA Overview There have been two sample points where samples have been routinely taken from Lake Winona since 1980 by ALASD (Figure 2-1). The sample points are named the north and south points after their relative location in the lake. Starting in 1980, annual samples were taken in September at both sample points. In 1984 and later, the ALASD samples were taken monthly for the June to September period, with several years there being either three or five samples. A description of the ALASD sampling method is needed for correct interpretation of the data. ALASD lake samples are obtained with 15-foot long cylinder that is lowered vertically into the water. This method results in a single sample vertically integrated through all or most of the lake water column, depending on the depth at the sample point. The cylinder is lowered to approximately 1 foot above the bottom, and the sample obtained. In the case of Lake Winona, the depth of water at the sample points is approximately 4-feet, meaning the sample represents the top 3 feet of the water column. For years prior to 1980, overall, there is limited water quality data, all of which was collected under the sponsorship of the MPCA. There was a 2 year program from 1976 to 1977 when intensive sampling occurred for a number of parameters. There has been volunteer monitoring of secchi depth for many years, starting in L:\WORK\MPCA\104084\WP\LAKE WINONA DATA SUMMARY REPORT FINAL.DOC 2 April 2008
49 Draft Lake Winona TMDL Phase 1 Report Data Summary and Modeling Strategy Minnesota Pollution Control Agency Data Review Statistical summaries of the Lake Winona data are found in Table A-1, Appendix A. It is seen that the data collection effort focused on total phosphorus, chlorophyll-a and secchi depth. That is, while there are around a hundred data points for each sample location for these three parameters, there is generally very limited data for other parameters such as orthophosphate and nitrogen parameters. There are approximately 50 data points dissolved oxygen, with the data for primarily existing for the 1990s. Plots of the total phosphorus are found in Figures 2-2 to 2-4. The first two of these figures show the annual and year to year variability in the data. For instance, the box and whisker plots found in Figures 2-2 and 2-3 show that in some years the total phosphorus data varied widely from month to month, while in others there was little variation within a year. The data also show a large annual variation through the period of record. A plot of the Lake Winona monthly (June to September) total phosphorus data from 1997 to 2007 is provided in Figure 2-4. Overall, the data for the south and north sample locations closely match. However, a regular seasonal trend is not seen in the data. That is, in some years the phosphorus concentration starts at the higher end in June and goes down in mid-summer. At other times the phosphorus concentration is lowest in June, with a July or August peak. This absence of a regular summer phosphorus trend indicates varying factors are influencing phosphorus concentrations in the lake from year to year. Plots of chlorophyll-a, secchi depth, and dissolved oxygen data for Lake Winona are found in Appendix B, Figures B-3 to B-5. These parameters exhibit the same relatively large year to year variability as seen with total phosphorus. It is likely that the annual productivity of Lake Winona varies by the same relative magnitude as seen in the phosphorus, chlorophyll-a, and secchi depth data. The factors causing the annual fluctuations in these data and the total phosphorus data have not been determined. Lake Winona, because it is shallow, is believed to be relatively mixed throughout the water column. However, this has not been confirmed with field sampling. No data is available that shows seasonal trends of phosphorus and dissolved oxygen near the lake bottom, nor is there data regarding the variation of these parameters with depth in Lake Winona. This is a significant limitation in the available data since the potential for phosphorus recycling from the sediment in the lake is high, and interpretation of the amount of phosphorus being released from sediments requires seasonal phosphorus and dissolved oxygen data. Very limited data is available for either total nitrogen or its various inorganic or organic constituents. Results in the 1994 Clean Lakes Project (WSN, 1994) describe as nitrogen as being more of a limiting nutrient than phosphorus, though low transparency may be the real productivity limit for Lake Winona. However, nitrogen is a key nutrient for lake productivity, and is often used in lake water quality and production modeling. L:\WORK\MPCA\104084\WP\LAKE WINONA DATA SUMMARY REPORT FINAL.DOC 3 April 2008
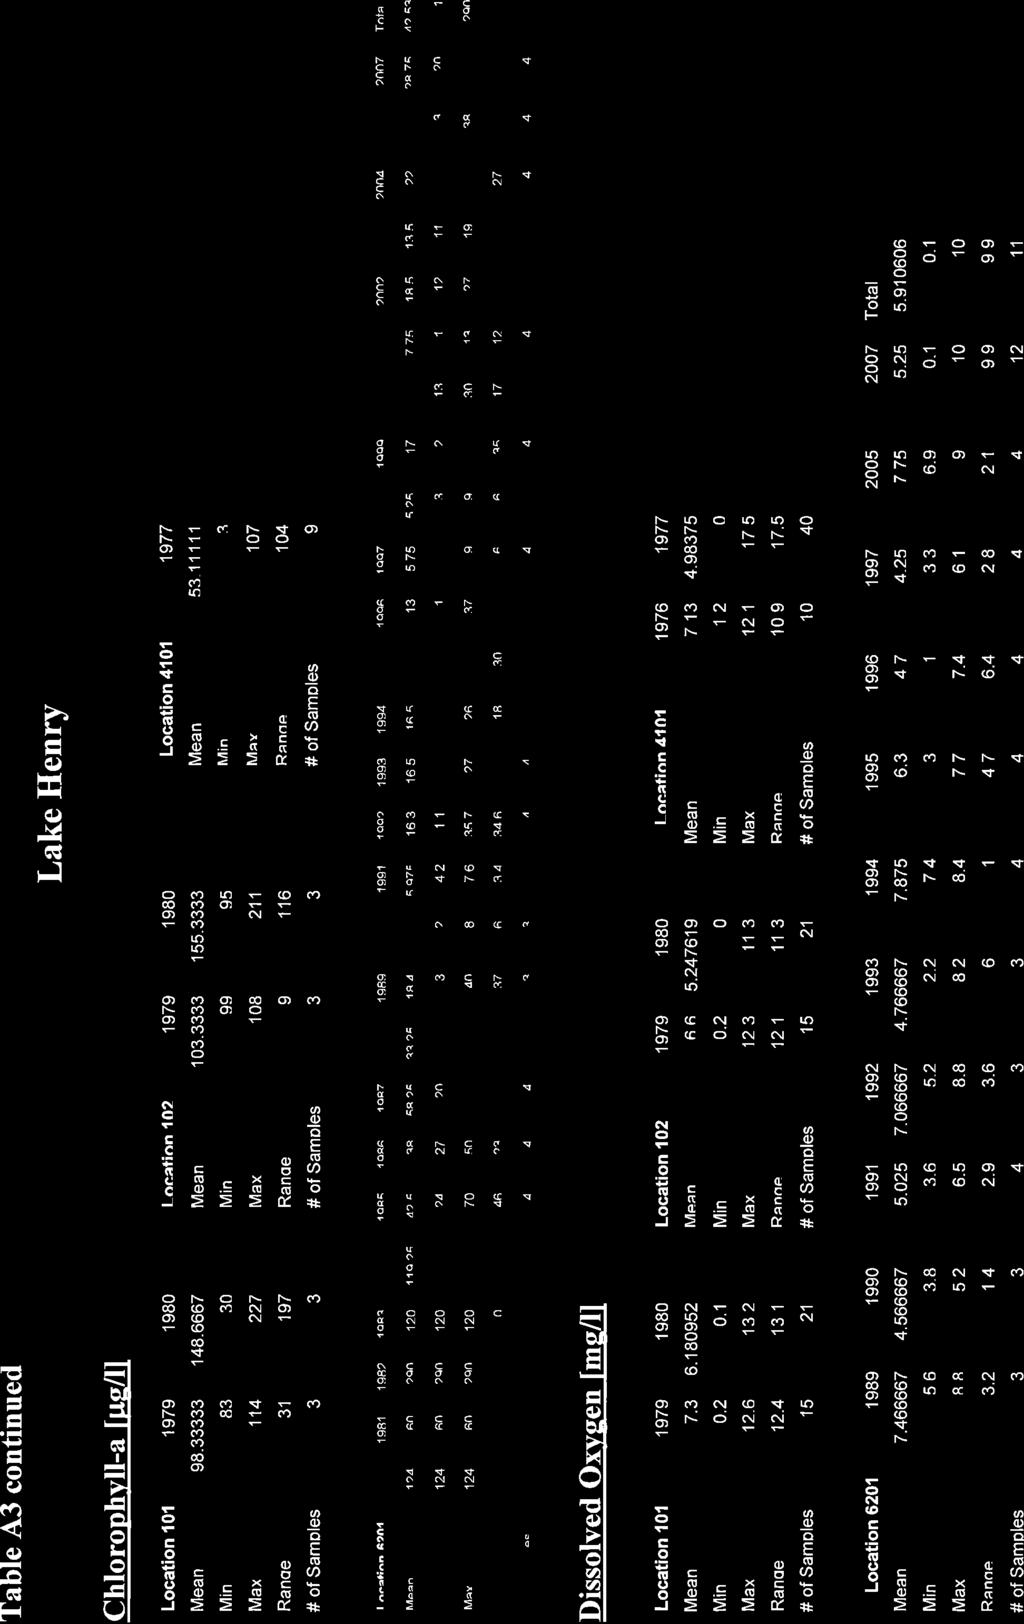
50 Draft Lake Winona TMDL Phase 1 Report Data Summary and Modeling Strategy Minnesota Pollution Control Agency 2.3 LAKE AGNES AND HENRY DATA The data sets for Lakes Agnes and Henry are very similar, and will be discussed together. Again, essentially the entire water quality data set available for these lakes has been collected by ALASD with the sampling methodology described in Section Similar to the data set available for Lake Winona, those for Lakes Agnes and Henry primarily consist of data for total phosphorus, chlorophyll-a, and secchi depth (see Appendix A, Tables A-2 and A-3). There are 94 data points for these three parameters for both lakes, collected since The timing of the sampling is monthly from June to September. Dissolved oxygen data has also been collected, but at about half the frequency as that for total phosphorus. The remaining data is very limited and relatively old, such as that for ammonia and turbidity, and has limited value for the Lake Winona TMDL project. Plots of the total phosphorus, chlorophyll-a, secchi depth, and dissolved oxygen data are found in Appendix B, Figures B6 to B LAKE MORPHOMETRY DATA Lake morphometry data developed from bathymetric mapping is available in the 1994 Clean Lakes Project (WSN, 1994). This report contains paper copies of bathymetric maps for Lakes Winona, Agnes, and Henry, along with lake morphometry data. However, it is the opinion of Earth Tech that the Lake Winona bathymetric map is of relatively low quality (Appendix C). For example, the date of the mapping is unknown, as are the survey reference points. True elevations are not given, the shoreline is not distinct, and the mapping is not computer based. A new electronic based map will allow more accurate determination of lake morphometry and water budget data which is of high importance for the analysis and modeling of nutrients in the lake. 2.5 WATERSHED DATA Watershed data for estimating inflow and pollutant loading rates to the lakes is of good extent. There is adequate mapping of topography, drainage boundaries, land use, soil types, storm sewers and drainage ways, and other typical data for estimating surface water runoff rates, volumes and associated pollutant loadings. Earth Tech has collected much of the watershed data available in electronic format for use in later phases of the project. Several first order intermittent tributaries discharge to Lake Winona for which there are no streamflow measurements. However, the discharges and loadings from these streams can be predicted at a level of confidence suitable for the Project. 2.6 ALASD WWTP DATA Data on the flow and pollutant discharge rates for the ALASD wastewater treatment plant (WWTP) discharging to Lake Winona has been obtained in electronic format as Excel spreadsheet databases. This is the data reported to MPCA per requirement of the NPDES permit held by ALASD. Discharge data for all pollutants reported to MPCA have been obtained for the period 1998 to present. Relative to the nutrient TMDL, the data set contains information on the following pollutants: biological oxygen demand (BOD), discharge rate, ammonia, dissolved oxygen, ph, total phosphorus, total suspended solids, and temperature. For L:\WORK\MPCA\104084\WP\LAKE WINONA DATA SUMMARY REPORT FINAL.DOC 4 April 2008
51 Draft Lake Winona TMDL Phase 1 Report Data Summary and Modeling Strategy Minnesota Pollution Control Agency total phosphorus, annual data has been obtained for the 30 year period from 1978 to 2007, which is depicted as annual phosphorus loads in Figure 2-5, along with average annual discharge rates. 2.7 WATER BUDGET AND LAKE LEVEL DATA The 1994 Clean Lakes Project report contained an estimated water budget for the Lake Winona Agnes Henry chain of lakes for the year For that report data was gathered to estimate all the major components of the water budget of the lakes including surface runoff, precipitation, evaporation, groundwater components, and lake to lake flows. With the exception of precipitation, detailed water budget data has not been collected since that time. There has been lake level monitoring of all three lakes sponsored by the MDNR, with summaries provided in Appendix D. However, the only comprehensive data set is for Lake Winona. Lake level monitoring for Lake Agnes stopped in 1985, and very limited lake level data is available for Lake Henry. Overall, the lake level information is not comprehensive enough to allow lake to lake to comparisons or computations or flow rates. It also does not allow the computation of outflow rates from lakes Winona or Henry. 2.8 DATA QUALITY Earth Tech has reviewed quality control measured taken for the water quality data presented in this report. Typical data quality control for water quality samples include, but are not limited to, measures such as duplicates, spiked samples, records of preservatives used and sample holding times, records of methods used and the lab that completed the test, and lab quality control results. Most quality control measures Earth Tech looked for were not reported in the databases received. According to ALASD, the original lab reporting sheets which would contain considerably more QC data are on file at ALASD (Spranger, April 2008). Quality control measures are important since the validity of the data is dependent on proper procedures being followed. Several observations can be made regarding the quality control results for which Earth Tech has access. Total phosphorus has been analyzed by three different methods as follows: Method by certified lab for Method 4500-P-E by certified lab from June , 1984 June Method LEG P00665 by non-certified lab from July Chlorophyll-a has been analyzed by two different methods as follows: Method H by a non-certified lab from June 1998 to present, 1984 June Method LEG by a non-certified lab from July L:\WORK\MPCA\104084\WP\LAKE WINONA DATA SUMMARY REPORT FINAL.DOC 5 April 2008
52 Draft Lake Winona TMDL Phase 1 Report Data Summary and Modeling Strategy Minnesota Pollution Control Agency Earth Tech received the chemical analysis data in the form of Excel spreadsheet databases which do not contain additional QC information. In regards to total phosphorus and chlorophyll-a, Earth Tech believes that method consistency is not an issue since 1998, in regards to sample results. QC data from the laboratory may indicate problems with some tests, but Earth Tech is unable to check this data. It should be noted that there is no lab certification for chlorophyll-a, but Method H for chlorophyll-a is nationally recognized. 2.9 COMPARATIVE LAKE DATA Earth Tech completed a review of existing data for other similar lakes which may be of use when developing TMDL goals. Data is available on other shallow as well as deep lakes in the North Central Hardwoods ecosystem that will be of use during the analysis of and development of a TMDL for Lake Winona. An example of available information is the 2005 MPCA report on shallow lakes in west central Minnesota (Heiskary et al., March 2005). There is also a body of information available for lakes in other ecoregions in Minnesota (Heiskary, et al., 2003), or from other states DISCUSSION OF NUTRIENT IMPAIRMENT Total phosphorus mean annual concentration, for the period 1995 to present, has been plotted for Lake Winona (Figure 2-6) and for lakes Agnes and Henry (Figure 2-7). A line has been fitted to the data using linear regression, with the coefficient of determination (r 2 ) shown on the plot. The coefficient of determination ranges between 0 and 1, with values closer to zero indicating a poor linear result and high variability and values closer to 1 indicating a good linear result and low variability. The Lake Winona total phosphorus data, which does appear to have a decreasing trend, has a relatively low coefficient of variation, which matches the relatively high variability in the data seen in Figure 2-6. A Mann-Kendall trend test was computed as well, a statistic which provides information on whether or not a trend is significant. For Lake Winona, the result was that the probability there was no trend was 0.22, compared to the probability there was a decreasing trend of Earth Tech interprets the statistical results for the Lake Winona total phosphorus data to mean that the statistic significance of the decreasing total phosphorus concentrations is low. While the concentrations appear to be decreasing, the data is still highly variable and a statement that the phosphorus concentrations are decreasing cannot be made on a statistical basis. The total phosphorus concentration is also 3 to 4 times higher than the proposed North Central Hardwoods of 0.06 mg/l for total phosphorus. On the other hand, the linear regression results for Lakes Agnes and Henry are much stronger. The Mann-Kendall trend test yielded a probability of no trend of 0.11, with the corresponding probability there is a decreasing trend of Earth Tech interprets these results to mean that the total phosphorus decrease in Lake Agnes and Henry is statistically significant. The total phosphorus concentrations of Lakes Agnes and Henry are above the proposed phosphorus standard of 0.04 mg/l for deep lakes in the North Central Hardwoods ecosystem. The mean annual total phosphorus concentration for Lake Winona has been compared to the mean annual phosphorus load discharged from ALASD WWTP in Figure 2-8. The figure shows L:\WORK\MPCA\104084\WP\LAKE WINONA DATA SUMMARY REPORT FINAL.DOC 6 April 2008
53 Draft Lake Winona TMDL Phase 1 Report Data Summary and Modeling Strategy Minnesota Pollution Control Agency there is not a simple relationship between the quantity of phosphorus discharged from the WWTP and lake phosphorus concentration. Figure 2-9 is a comparison of total phosphorus concentration in Lakes Winona, Agnes, and Henry. As identified in previous studies (WSN, 1994), the total phosphorus concentration declines in a downstream direction in the AHW chain of lakes. Phosphorus is clearly being removed from the water column in the upper lakes, particularly Lake Winona, but also in Lake Agnes RECOMMENDATIONS Starting with the 2008 field season, all laboratory or field testing reports including results and quality control information for the testing and chemical analysis being completed for activities related to the Project should be collected by MPCA. L:\WORK\MPCA\104084\WP\LAKE WINONA DATA SUMMARY REPORT FINAL.DOC 7 April 2008
54 Draft Lake Winona TMDL Phase 1 Report Data Summary and Modeling Strategy Minnesota Pollution Control Agency 3.1 OVERVIEW 3.0 PROPOSED MODELING STRATEGY AND SELECTION Earth Tech recommends a combination of a watershed model to predict nonpoint source loading rates to Lake Winona with a receiving water model that predicts lake water quality. Measured and/or predicted pollutant loads for point and nonpoint sources would be developed separately from the receiving water model. The loads would be input directly to the receiving water model for the lake water quality predictions. 3.2 LAKE MODELS CONSIDERED A lengthy review of available lake water quality models has not been prepared for this report. There are several excellent publications by the United States Environmental Protection Agency (US EPA) and others which contain such reviews (US EPA, 1997). The general principals guiding the Earth Tech recommendations regarding model selection are as follows: A single model might not be enough. To address multiple objects, potential conflicts, technical and economic considerations likely requires the use of more than one model. Models and techniques should be matched to the project phase and available information. Earlier in the project there is generally less data for modeling and less detail needed to meet project requirements. Simpler models are often used earlier in a project with modeling complexity and detail increasing later in the project as more information becomes available. Models used should be able to characterize potential management decisions or lake restoration alternatives being considered. The intended use of the model and type of decisions to be made must be considered during model selection. The models used should characterize pollutants and ecological components important to the project. For this project the model(s) need to be able to simulate nutrient cycling and associated ecological components. In general, the lake models can be categorized into three levels of complexity, with the levels of corresponding to the quantity of data needed to run a model. The first, least complex models are screening models, typically used for initial screening of lake conditions, which require the least amount of data. Next, in order of complexity and input data needs, would be mid-level models which complete computations assuming steady state conditions. That is, the input parameters are not varied during the course of a particular simulation. The most complex models are hydrodynamic models with are coupled with dynamic water quality computations. Hydrodynamic models provide a detailed time varying flow field, with the dynamic water quality models allowing time varying input data during particular simulations. Given the amount of data available and project phase, models developed for initial problem screening of lake (receiving water) conditions are not appropriate for TMDL formulation. However, on the other hand, there are limitations with the water budget and water level data, as L:\WORK\MPCA\104084\WP\LAKE WINONA DATA SUMMARY REPORT FINAL.DOC 8 April 2008
55 Draft Lake Winona TMDL Phase 1 Report Data Summary and Modeling Strategy Minnesota Pollution Control Agency described in Section 2, that lead to the conclusion that detailed hydrodynamic and dynamic water quality receiving water models are also not appropriate for Lake Winona at this point in time or in the near future. A mid-range, in terms of model complexity, steady state nutrient model is recommended by Earth Tech as being appropriate for the Project. These models are appropriate for the quantity and quality of available water quality data. Furthermore, the steady state models require considerably less water budget and water level data than required by linked hydrodynamic-dynamic lake water quality models. Earth Tech recommends BATHTUB and WiLMs, steady state lake nutrient models which are well suited to the project phase and technical need. A supporting consideration for the selection of these models for the Project is the extensive experience with the application of BATHTUB to Minnesota lakes, and WiLMs is relatively well known and applied in the region. BATHTUB can be implemented in a spatially segmented hydraulic network that would allow the three lake chain to be modeled as a unit, a feature that will help meet the project goal of modeling the downstream affects of management practices implemented for Lake Winona. 3.3 LAKE MODEL CALIBRATION AND VALIDATION Model calibration and validation are required for this Project. These steps are taken because the confirmation of results that occurs through these processes adds validity to the modeling process and helps make the results more meaningful. Model accuracy in predicting water quality is directly related to the accuracy of the input data and amount of data available. Even a detailed model is not considered accurate without calibration and validation. Calibration of a model involves minimizing the differences between measured field conditions and the model output by adjusting model input factors. Model calibration is completed with a data set not used for validation purposes. During model calibration, a sensitivity analysis will also be completed. In this process the input variables will be varied one by one to provide information regarding which input parameters have the greatest effect on output. Validation of a model involves the use of an independent data set to confirm the model calibration. Models are tested based on their predictions, with more accuracy being required when absolute predictions are needed. With acceptable calibration, the model predictions will be reasonably close to field observations. Earth Tech recommends the use of the more recent data for model calibration and validation. Specifically, data from 1998 to present should be used. This is not to say that data collected prior to 1998 is not valid, but this data is less likely to represent current conditions. The general scenario Earth Tech recommends is to use data from the period 1997 to 2002 for model calibration. Data from the 2003 to 2007 period would be used for model validation. Data collected for 2008 would then be used in the calibrated/validated model. New data collected over the course of the upcoming field season would be used to provide additional model inputs, such as information on the magnitude of internal phosphorus recycling. L:\WORK\MPCA\104084\WP\LAKE WINONA DATA SUMMARY REPORT FINAL.DOC 9 April 2008
56 Draft Lake Winona TMDL Phase 1 Report Data Summary and Modeling Strategy Minnesota Pollution Control Agency 3.4 WATERSHED MODEL RECOMMENDATIONS Earth Tech recommends using the model WinSLAMM for the computation of pollutant loadings from stormwater discharges. WinSLAMM is a nationally recognized model that will compute runoff and pollutant loading rates from the type of land uses and pollutant source areas found in the Lake Winona watershed. It allows the analysis of alternative best management practices for reducing pollutant loadings. WinSLAMM has been used to compute nonpoint source stormwater pollutant loadings on a City wide basis for a substantial number of cities. Many standardized parameter files for pollutant loading and runoff rates for urban and suburban areas are available for WinSLAMM. These standardized input files are based on numerous stormwater monitoring programs in the region and across the county and greatly minimize the need for model calibration and validation. They contain information on pollutant loading rates and characteristics for a wide variety of land uses and source areas. The WinSLAMM urban water quality model evaluates pollutant loads based upon the model predictions for total suspended solids (TSS) and runoff volume. Other pollutant loads, such as phosphorus, nitrogen, and chlorides, are calculated as a fraction of the TSS load, for each source area (roofs, streets, paved parking, etc.) and land use. Computed pollutant loads would be input directly into the receiving water model. The modeling would be completed for a series of rainfall events, including a time series representing an average year for rain and a time series representing a 10 year period of recorded daily rainfall in the area. Stormwater monitoring could be completed to provide site specific data for the TMDL project. However, there are several considerations when establishing a stormwater monitoring program. The first is that stormwater quality various widely from one storm to the next, and even within a single storm. Therefore, to accurately measure stormwater quality at a particular site for the purpose of improving on the standard WinSLAMM input files requires collection of samples from a relatively large number of sample events (at least 20). Collection of stormwater samples is difficult, both from the standpoint of being ready to collect samples when a storm starts, and from the standpoint of methods needed to accurately characterize stormwater quality, which is highly variable even within a storm. Because of the sampling complexity involved, automatic samplers are often used, with sampling triggered by a flow or level sensor. Automatic samplers are programmed to take a series of samples, or to collect a single composite sample, during the course of a rain event. After a storm the operator returns to the sampler to reset it for the next storm. L:\WORK\MPCA\104084\WP\LAKE WINONA DATA SUMMARY REPORT FINAL.DOC 10 April 2008
57 Draft Lake Winona TMDL Phase 1 Report Data Summary and Modeling Strategy Minnesota Pollution Control Agency 4.1 OVERVIEW 4.0 RECOMMENDATIONS FOR ADDITIONAL MONITORING The section contains Earth Tech recommendations for additional monitoring or field work to be completed in 2008 in support of TMDL development for Lake Winona. Recommendations provided here are based on the results of the data summary and modeling recommendations found in Sections 2 and 3 of this report. 4.2 LAKE SAMPLING Earth Tech recommends that bimonthly sampling of Lake Winona (2 points), Lake Agnes, and Lake Henry (1 point each) be completed for the June to September 2008 period. Bimonthly sampling is recommended to provide more information on internal nutrient cycling, since sampling on a monthly basis may miss important information. This sampling is intended to supplement the ALASD monitoring program, with the samples to be collected at the same points as ALASD. However, samples will be collected at discrete depths, instead of the depth averaging method used by ALASD. For Lake Winona, samples would be collected 6-inches off the bottom, and 1 foot from the surface. For the other lakes, three samples would be collected in the vertical, including samples representing the epilimnion, metalimnion, and hypolimnion (1 foot above the bottom). The bimonthly samples would be analyzed for total phosphorus, orthophosphorus, chlorophyll-a, total kjeldahl nitrogen, nitrate-nitrite nitrogen, chlorides, total hardness, and total suspended solids. Field measurements would be made for dissolved oxygen, ph, temperature, and specific conductance (vertical profiles). Secchi depth would also be measured. One set of bottom sediments would be collected for analysis of total phosphorus, total nitrogen and ph at six locations along the center line of Lake Winona to characterize the nutrient levels in the sediments. The sediment samples would be collected with a dredge and would represent the top 3 inches of the sediment. 4.3 STORMWATER SAMPLING Because of the complex nature of stormwater sampling, two levels of effort are given for review and decision by MPCA regarding stormwater sampling to be completed Screening Program The recommended stormwater sampling screening program would involve sampling of three storms, including one snow melt period, using grab sample techniques. To qualify as a storm to be sampled, there would need to be at least a 3 day dry period from the previous storm, and to have a predicted storm depth of at least 0.2 inches. Three sample locations would be selected for each storm, one representing the City of Alexandria (a storm sewer outfall to Lake Winona), one representing runoff entering the lake from the Alexandria airport, and one representing runoff from one of the tributaries in the suburban area on the southwest side of the lake. The stormwater samples would be analyze for total phosphorus, total L:\WORK\MPCA\104084\WP\LAKE WINONA DATA SUMMARY REPORT FINAL.DOC 11 April 2008
58 Draft Lake Winona TMDL Phase 1 Report Data Summary and Modeling Strategy Minnesota Pollution Control Agency kjeldahl nitrogen, nitrate plus nitrite nitrogen, total suspended solids, and chlorides. Specific conductance and temperature would be measured in the field Comprehensive Program The recommended comprehensive stormwater sampling program would include set up of one automatic sampling station at a location representative of the City of Alexandria urban area for the collection of data from 20 storms. We are proposing two levels of monitoring to evaluate these sources: (1) Outfall data (Lake Winona), and (2) Isolated street data in the same watershed as the outfall. The outfall data will provide the basic data to calibrate the computed outfall values. The isolated street monitoring will provide a second level of calibration data that will be matched to the modeled street pollutant output. Street pollutant loadings are more difficult to characterize than data from other source areas because the street dirt load algorithm requires data to develop an accumulation-washoff function for streets. However, since streets are typically the most important source of pollutants, it is appropriate to expend additional effort on them. Data from the automatic sampling program will be used to supplement and adjust as necessary the existing standard parameter files that are used to determine the pollutant loads. The automatic sampling station would include flow monitoring and collection of stormwater samples. Sampling would include a discrete sample from taken at the beginning of a storm and a composite sample representing the remainder of the storm. The stormwater samples would be analyze for total phosphorus, total kjeldahl nitrogen, nitrate plus nitrite nitrogen, total suspended solids, suspended sediment concentration (SSC), total solids concentration, volatile organic suspended solids, and chlorides. A screening level effort as described in Section would also be completed for runoff from the Alexandria airport and suburban area on the southwest side of Lake Winona. 4.4 LAKE WINONA BATHYMETRIC MAP Earth Tech recommends that a new bathymetric map be created for Lake Winona. This would involve the survey of the shoreline and below water areas of the lake, and the creation of a 1 foot interval contour map for the lake bottom. An area 20 feet wide just outside the waters edge would be included in the mapping. 4.5 LAKE WINONA SOFT SEDIMENT QUANTIFICATION Earth Tech recommends that the thickness of the soft sediment in Lake Winona be measured to allow computation of the volume of soft sediment in the lake. The work would involve measuring the depth to both the top of the sediment, and then bottom of the soft sediment in at least 50 locations. It may be that the work would be done early in the winter through the ice once safe ice conditions existed late in L:\WORK\MPCA\104084\WP\LAKE WINONA DATA SUMMARY REPORT FINAL.DOC 12 April 2008
59 Draft Lake Winona TMDL Phase 1 Report Data Summary and Modeling Strategy Minnesota Pollution Control Agency 4.6 MACROPHYTE SURVEY Earth Tech recommends a survey of macrophytes in Lake Winona. Macrophytes would be identified along 16 transections, each transect being approximately 400-feet long. The identified species would be used to compute the Floristic Quality Index for the lake. L:\WORK\MPCA\104084\WP\LAKE WINONA DATA SUMMARY REPORT FINAL.DOC 13 April 2008
60 Draft Lake Winona TMDL Phase 1 Report Data Summary and Modeling Strategy Minnesota Pollution Control Agency 5.0 REFERENCES Earth Tech, Inc., February 2008, Work Plan Lake Winona TMDL Project. Heiskary, S., M. London and H. Markus, Shallow lakes of southwestern Minnesota: status and trends summary for selected lakes. Part of a series on Minnesota Lake Water Quality Assessment. MPCA, St. Paul MN, 80pp. Heiskary, S. and M. London, March 2005, Interrelationships Among Water Quality, Lake Morphology, Rooted Plants and Related Factors for Selected Shallow Lakes of West-Central Minnesota. Part of a series on Minnesota Lake Water Quality Assessment. MPCA, St. Paul MN, 133 pp. Limno-Tech, Inc., June 2006, Benchmarking Report: Site-Specific Approaches for Lake Nutrient TMDLs, Final Report. Minnesota Pollution Control Agency, March 2007, Lake Nutrient TMDL Protocols and Submittal Requirements. Minnesota Pollution Control Agency, December 2007, Work Plan Lake Winona TMDL Project. US EPA, May 1997, Compendium of Tools for Watershed Assessment and TMDL Development, EPA 841-B Wenck Associates, Inc., May 2002, Lake Le Homme Dieu Water Quality Study. Widseth, Smith Nolting, July, 1994, Diagnostic and Implementation Plan, Agnes Henry Winona (AHW) Clean Lakes Project. L:\WORK\MPCA\104084\WP\LAKE WINONA DATA SUMMARY REPORT FINAL.DOC 14 April 2008
61 APPENDIX A WATER QUALITY DATA SUMMARIES FOR LAKES WINONA, AGNES, AND HENRY
62 APPENDIX B WATER QUALITY DATA PLOTS FOR LAKES WINONA, AGNES, AND HENRY
63 APPENDIX C EXISTING LAKE WINONA BATHYMETRIC MAP
64 APPENDIX D DNR LAKE LEVEL SUMMARIES FOR LAKES WINONA, AGNES, AND HENRY
65 APPENDIX E CHLORIDE DATA SUMMARY
66

67

68


69
70

71

72


73

74
75

76
77

78

79
80

81

82

83

84
85
86
87
88
89
90

91

92

93


94
95

96

97