Energy demand and energy efficiency in the OECD countries: a stochastic demand frontier approach
|
|
|
- Oscar Chapman
- 5 years ago
- Views:
Transcription

1 Energy demand and energy efficiency in the OECD countries: a stochastic demand frontier approach 10th IAEE European Conference 7-10 September 2009 Vienna Austria Massimo Filippini and Lester Hunt
2 Outline Motivation and goals Methodology Model Specification Data Results Conclusions 2
3 Motivation and Goals Energy efficiency has a crical role in addressing energy secury, environmental and economic issues All OECD countries are implementing energy efficiency policies The promotion of energy efficiency policy is also a very important activy of the IEA. 3

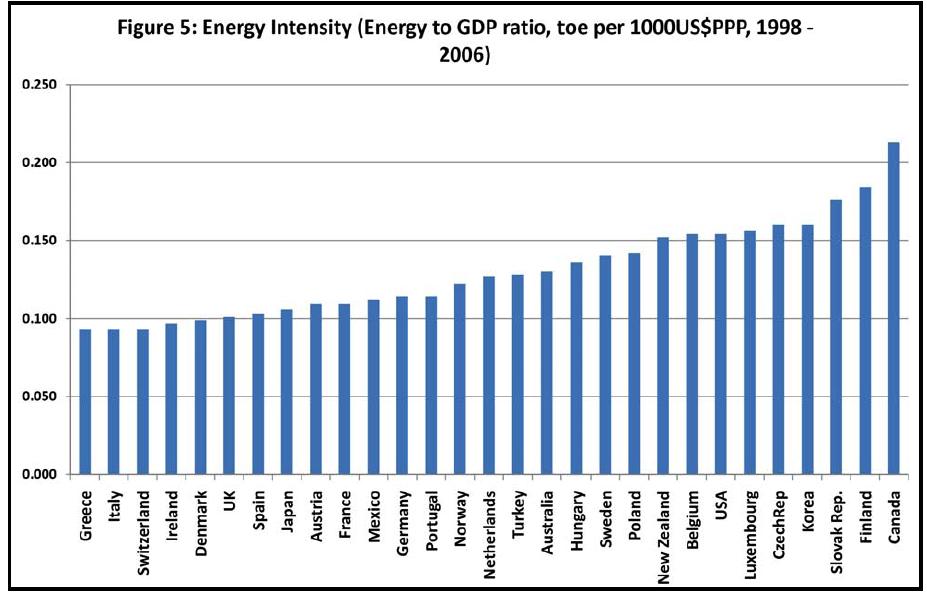
4 Since the oil shocks of the 1970s, G8 countries have promoted energy efficiency improvements across all sectors of their economies. As a result of these policies and structural changes in their economies, these countries have been able to decouple primary energy use from economic growth. This is shown in the decline in overall primary energy intensy 10
5 Footnote 10 Energy intensy is the amount of energy used per un of activy. It is commonly calculated as the ratio of energy use to GDP. Energy intensy is often taken as a proxy for energy efficiency, although this is not entirely accurate since changes in energy intensy are a function of changes in several factors including the structure of the economy and energy efficiency.
6 Problems of this indicator Energy intensy can vary between countries for several reasons: the level of industrialization; the mix of services and manufacturing; the climate; the level of energy efficiency of the appliance and capal stock and production processes the organization of the production and consumption processes in space
7
8 Goals of the paper To estimate the economy-wide level of energy efficiency for a sample of OECD countries using an alternative approach based on two branches of the lerature: frontier estimation and energy demand modelling. An aggregate energy demand frontier function is estimated 8
9 Methodology An aggregate frontier energy demand model In general, a frontier function gives the maximal or minimal level of an economic indicator attainable by an economic agent. In the case of an aggregate energy demand function the frontier gives the minimum level of energy necessary for an economy to produce any given level of goods and services. The distance from the frontier measures the level of energy consumption above the baseline demand, e.g. the level of energy inefficiency. 9
10 An aggregate frontier energy demand model E Eobs Efro EFi E fro EF =! 1 i E obs Energy efficiency measures the abily of a country to minimize the energy consumption, given a level of y Y (GDP) 10
11 Two approaches In the lerature we can distinguish two principal types of approaches to measure efficiency: the econometric (parametric) approach and the linear programming (non-parametric) approach.
12 Model specification (1) is assumed that there exists an aggregate energy demand relationship for a panel of OECD countries, as follows E = E(P,Y,D, DC t,a, ISH i, SSH ) E is aggregate energy consumption per capa, P is the real price of energy, Y is GDP per capa D t is the Underlying Energy Demand Trend (time dummies) DC is a dummy for climate (Köppen Geiger climate classification) A i is the area of each country ISH is the share of the value added of the industrial sector SSH is the share of the value added of the service sector 12
13 Model Specification (2) The approach used in this study is therefore based on the assumption that the level of the economy-wide energy efficiency can be approximated by a one-sided non-negative using a log-log functional form of the above equation and applying a pooled frontier approach the (symmetric) model is : e =! +! y y +! p p + " t D t +! c c +! a a i +! I ISH! S SSH + v + u a symmetric disturbance capturing the effect of noise and as usual is assumed to be normally distributed is interpreted as an indicator of energy efficiency and is assumed to be half-normal distributed 13
14 Unbalanced Panel data set Data 29 OECD countries (i = 1,, 29) 1978 to 2006 (t = ) where: E = per capa aggregate energy consumption (toe); Y = per capa GDP (thousand US2000$PPP); P = index of real energy prices (2000=100); (all from IEA database) C = climate dummy variable where a country is characterized by a cold climate (according to the Köppen-Geiger climate classification) Ai is the area of each country in km2 ISH is the share of the value added of the industrial sector SSH is the share of the value added of the service sector (all from OECD database) 14
15 Results (1) Estimated coefficients (t-values in parentheses) Constant (-7.651) α y (38.942) α p (-4.743) α c (12.308) α a (3.352) α ISH (9.113) α SSh (11.501) Time dummies Yes Lamda (λ) (8.583) Coefficients time dummies The estimated mean average efficiency is estimated to be about 78% (median 79%)
16 Results (2) For some countries the (negative) correlation between Energy Intensy and the estimated Energy Efficiency is que high, but for some is not and for some is posive. Therefore focussing only on Energy Intensy could give a misleading picture hence the focus should be on the estimated Energy Efficiency from the model For the Period we observe the following: See Table and Figures 16
17 Conclusions (1) This research is a fresh attempt to isolate core energy efficiency for a panel of 29 OECD countries, opposed to relying on the simple energy to GDP ratio or energy intensy By estimating a measure of underlying energy efficiency by combining the approaches taken in energy demand modelling and frontier analysis The energy demand specification controls for income, price, climate, country size, structure of the economy and a common underlying energy demand trend, thus the efficiency measure is obtained in a similar way to previous work on cost and production estimation 17
18 Conclusions (2) The estimates for core energy efficiency using this approach show that although for a number of countries the change in energy intensy over time might give a reasonable indication of efficiency improvements; this is not always the case It is argued therefore that this analysis should be undertaken to avoid potentially misleading advice to policy makers So that looking at relative energy intensy across countries might give a misleading picture, unless the influences discussed above are controlled for first 18
19 Thank You 19
20
21 Stochastic Frontier Methods SFA Cross section models Panel data models FE model RE (GLS) model Pt Lee Random Effects heterogeney True random True fixed effects Mundlak s formulation of RE model Kumbhakar (1993) Heshmati and Kumbhakar(1994) Greene (2005) Farsi, Filippini, Greene (2005) Farsi, Filippini, Kuenzle (2005) 21
22 Unobserved heterogeney,panel data and efficiency E Eobs Observed demand, E i Efro Frontier Demand Inefficiency term u Stochastic term ε Heterogeney term αi Y 22
23 Model Specification The alternative asymmetric price model is obtained by decomposing the log of the energy price (p ) into several components : p = p + p + p + p i 1 max rec cut * y max max rec rec cut cut c t e =! i +! y +! p +! p +! p +! c +! t + v + u 23
24