Poole Harbour Channel Deepening and Beneficial Use Review of Physical monitoring in Poole Bay Technical Note 1 WITHOUT PREJUDICE
|
|
|
- Noah Hopkins
- 5 years ago
- Views:
Transcription
1 1. Introduction Poole Harbour Channel Deepening and Beneficial Use Review of Physical monitoring in Poole Bay Technical Note 1 WITHOUT PREJUDICE This technical note reviews the physical data that was collected as part of the monitoring of the dredging and disposal activities that took place in Poole Bay over the period October 2005 to March Description of dredging and disposal activity Within Poole Bay there were three types of relevant activity: dredging of sands and gravels from the Swash Channel as part of the channel deepening; beach replenishment works at Swanage, Poole and Bournemouth utilising sandy material and gravels from the Swash Channel and from within Poole Harbour; and offshore disposal at the Defra licensed site at Swanage of material that was considered unsuitable for beach replenishment because of elevated fines (mud) content. The dredging works were undertaken by a combination of three trailer suction hopper dredgers (TSHD). The dredging commenced on 13 th November with the 2,500m 3 hopper capacity TSHD Volvox Scaldia. On 30 th November the TSHD HAM 311 joined the dredging. The HAM 311 has a hopper capacity of about 3,500m 3. On 15 th December the Volvox Scaldia was replaced by the TSHD Waterway which has a hopper capacity of 4,900m 3. On 10 th January the Waterway completed her work on the contract. On 19 th March the HAM 311 completed the contract with the final pump ashore at Bournemouth. A diary of the beach replenishment works can be found at The dredging contractor, Van Oord, who undertook the dredging works, maintained records of the volumes of loads of material being placed offshore at the disposal site and being pumped ashore as part of the beach replenishment works. A requirement of the license for offshore disposal of material at the Swanage disposal site was that no more than 20,000m 3 of material was placed offshore in a 24 hour period and that there was no disposal of material in the last hour of the south west flowing period of the tide (ebb). Records of the mass of material placed at the site were also required. The records of disposal from Van Oord provide a basis for examining the intensity of dredging activity of silty material within Poole Harbour (see Technical Note 2) and of disposal activity at the Swanage disposal site. This is illustrated in Figure 1. 1

2 Figure 1 Reported volumes of offshore disposal 2
3 The disposal record shows that initially disposal was at a rate of about 10,000m 3 per day and increased when the two larger dredgers were operating together. On four occasions the reported volumes of disposal slightly exceeded 20,000m 3 in a 24 hour period. The total volume reported by Van Oord as being disposed offshore at the licensed disposal site was about 710,000m 3. A significant proportion of that material would be expected to be sandy. The volumes of beach replenishment commenced at about 10,000m 3 per day and attained levels in excess of 30,000m 3 per day when the two larger dredgers were working together. 3


4 Figure 2 Reported volumes of beach replenishment 4
5 The volumes of sandy material reported on as being replenished on the beaches are summarised in Table 1. Table 1 Reported volumes of beach replenishment Location Reported volume of material (m 3 ) Estimated Measured in dredger Measured on volume loss and pumped ashore beach Swanage 128,219 90,000 30% Poole 590, ,000 24% Bournemouth 726, ,705 15% Total 1,444,684 1,153,705 20% The actual volumes surveyed as being on the beaches after completion of the replenishment are also included in Table 1. The differences between the volumes pumped ashore from the dredger and the volumes measured as being ashore on completion of the works is attributable to differences in density of the sandy material in the hopper and on the beach and losses of material from the beach to the foreshore during the pump ashore process. The majority of material lost would be expected to be sandy and would be expected to deposit close to the beaches. Neither the in-situ bulk density of the dredged material or the tonnes dry solids of the material in the hopper of the dredger have been reported by Van Oord. On the website it is stated that the Crown Estate apply a factor of 1.5 to convert from cubic metres to metric tonnes. Assuming that this relates to cubic metres in the dredger the total dry tonnage of sand removed from the dredged areas by the dredgers and pumped ashore is million tonnes and the mass of material lost from the beaches is million tonnes. Poole Harbour Commissioners have surveyed the dredged areas pre- and postdredge. From their surveys it is concluded that about 1.35Mm 3 of in-situ material that would have been defined as sandy/coarse and fit for beach replenishment was dredged from Swash Channel and the seaward part of the Harbour Channel. Bulking up of the in-situ sandy material by a factor of about 1.1 during dredging would not be unexpected, giving an in hopper volume of about 1.49Mm 3. Significant losses of material during the removal of the sandy material would not be expected because the material was reported as being largely free of fine material any losses of material from overflow or disturbance would tend to have returned to the area of dredging and would probably have required subsequent removal. Thus the bulked volume would be expected to similar to the volume measured in the TSHDs which is the case here. 3. Monitoring programmes In the Poole Bay area the recording of volumes and masses dredged was an important element of the monitoring of the dredging activities. Additionally, because of the constraint of no disposal during the last hour of the ebbing flow it was necessary to carefully regulate and report on the timing of disposal activities. 5
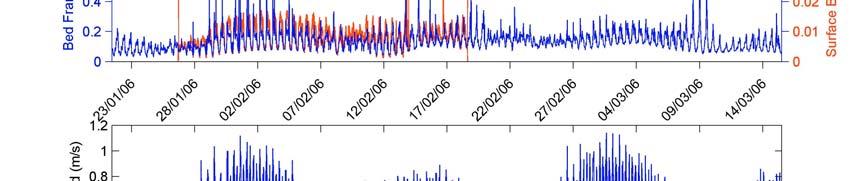
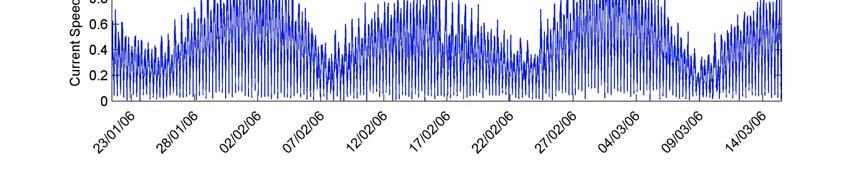
6 In addition to this routine reporting there were also a number of specific monitoring activities and these are described in this section. As part of the license conditions for the offshore disposal, two periods of a minimum of 48 hours of monitoring of near bed and near surface suspended sediment monitoring were to be undertaken. One period of monitoring was to be prior to disposal activities taking place (to provide a baseline) and another was to take place during the disposal operations at the site. The pre-disposal monitoring suffered from instrument loss and instrument malfunction and no data was obtained. PHC consulted with CEFAS over this outcome and it was agreed that an extended period of monitoring would be undertaken towards the end of the disposal activity. The period of monitoring commenced with a period of no disposal at the offshore site. It is possible that background concentrations in the vicinity of the disposal site at this time were influenced by the preceding disposal activity but given the reduced rates of disposal from mid January onwards this is less likely to have been an important factor than if the monitoring had taken place a month earlier. Near bed monitoring was undertaken by Partrac Ltd and near surface monitoring was undertaken by Van Oord. Partrac (2006) presents the results of the monitoring near the disposal site. The initial deployment of the bed mounted instrumentation (Partrac) was undertaken on 21 January The bed frame was located in about 30m of water to the SW of the disposal site. The instrumentation to record currents and suspended sediment was mounted about 0.5m above the sea bed. The bed frame was to be recovered on 22 February However, the frame could not be located. Eventually on 15 March 2006 the frame was located and recovered by local fishermen at a location about 100m south west of the original deployment. The surface mounted instrumentation (Van Oord) was suspended from a buoy about 0.5m below the water surface. The surface mounted instrumentation was deployed between 26 January 2006 and 18 February During the period of the deployment of the instrumentation the disposal activity at the site was significantly less than it had been during November and December 2005 (see Figure 1). From the presentation of results in Partrac (2006) a strong correlation between near bed current strength and tidal range is found (see third graphic in Figure 3). Peak spring tide near bed currents of up to 1.1m/s were recorded. On neap tides the maximum current strength was closer to 0.4m/s. A correlation between near bed suspended sediment concentrations and tidal current strength was also observed (compare blue line in second graphic with third graphic in Figure 3). On spring tides the measured near bed concentrations were in the range 100 to 200mg/l with occasional peaks of up to 800mg/l (use the left hand scale for the second graphic in Figure 3 for near bed concentrations). On 6
7 neap tides the measured concentrations were slightly lower with few peaks in excess of 200mg/l. There was also a strong correlation between the tidally varying suspended sediment concentration at the surface and the bed although at the surface suspended sediment concentrations were more than ten times lower than at the bed (compare red and blue lines in second graphic of Figure 3, use right hand scale for near surface concentrations). On spring tides the near surface suspended sediment concentrations typically varied between 2 to 16mg/l and on neap tides between 2 and 8mg/l. Throughout the period of monitoring there were 28 hopper loads of material disposed at the site (see first graphic in Figure 3). On no occasion was it possible to identify unequivocally that the disposal of material within the licensed area of the site lead to an elevation of suspended sediment concentrations at the monitoring positions. 7
8 8
9 Figure 3 Summary results from Partrac (2006) showing disposal activity, near surface and near bed suspended sediment concentrations and near bed tidal current speed. In addition to the monitoring of suspended sediment concentrations and near bed tidal currents the Southampton Oceanography Centre (SOC) are undertaking a programme of dive monitoring at various sites in Poole Bay. At these sites sediment traps were deployed and the average daily rates of the mass of fine sediment accumulating between the visits to the sites was determined (Collins, 2007). Much of the material reported to accumulate in the sediment traps was shelly, indicating that the trapped material was resuspended from local sources, presumably by storm wave action. The interim results of this ongoing do not suggest that the dredging and disposal directly increased sedimentation rates within Poole Bay. In the months following the completion of the disposal and replenishment activities the results of the sediment traps could be taken as suggesting that at some locations sedimentation rates were higher than in the previous year. Factors that could contribute towards such results include: longer term effects of increased amounts of fine sediment in the Bay arising from disposal activity at the offshore site; the effects of storms; and the effects of sediment losses on the foreshore associated with beach replenishment works. Poole Harbour Commissioners (PHC) undertook bathymetric surveys of the disposal site in September 2005 and July The changes in the sea bed elevation over this period have been determined by PHC. This is presented in Figure 4. The red areas of the figure show where there has been a build up of material on the sea bed. It can clearly be seen that the disposal activity took place in the south eastern quadrant of the disposal site. This data indicates a build up of sediment in this quadrant on the sea bed of about 400,000m 3 occurred. The figure also shows the locations of individual placements of material. 9
 4. Comparison of monitoring and EIA modelling results 10")
10 Figure 4 Difference in bed elevation at disposal site (Sept 2005 to July 2006) 4. Comparison of monitoring and EIA modelling results 10
11 The hydraulic studies to support the EIA considered a dredging scenario where a 1,500m 3 TSHD disposed of material on a continual basis (for about a month with an approximately three hour cycle time). The simulations thus represented the disposal of about 12,000m 3 /day. The simulations assumed that 50% of the placed material was fines and that during placement 3% of the fine material was released directly into the water column at the time of disposal the remainder being dispersed from the bed over time by the tidal currents. Subsequent studies to support the final consent of the licence addressed the issue of two larger vessels working together and considered higher disposal rates (HR Wallingford, 2005). From the EIA and pre-consenting works (HR Wallingford, 2005) for the preferred scenario (including mitigation for potential impact on Sabellaria beds) the disposal was simulated as taking place at the most south easterly point of the disposal area. The results from this scenario are illustrated in Figure 5. In reality (see Figure 4) the disposal took place within the south eastern quadrant of the site but closer to the centre of the site. The simulations show that on the stream line from the point of disposal that depth averaged suspended sediment concentrations were predicted to be elevated by in excess of 250mg/l (see Figure 5). However, away from this streamline increases in suspended sediment concentration were predicted to be significantly less, about 50mg/l above background levels. Given that no clear evidence is available relating to increases in near bed suspended solids concentrations around the time of disposal it appears that for the period of monitored disposal activity the assumptions for the EIA studies were precautionary and that rates of release of fines (at the time of disposal, into the water column) were less than assumed for the EIA. Figure 5 also shows the locations of the disposal that occurred during the period of offshore monitoring and the location of the monitoring point to the south west of the disposal area (shown as red dot). The results of the modelling are not inconsistent with the results of the monitoring where it is found that the location of the monitoring point would generally be to the south east of the stream line that the plume would follow for the majority of the reported disposal locations. 11
12 12
13 Maximum concentration (mg/l) Figure 5 Location of individual disposal activities during monitoring period superimposed on the plume modelling results presented in the EIA There is generally good agreement between the flow directions simulated in the model and the observations at the bed frame. The observations showed an ebb direction of 226 o N and a flood direction of 38 o N. The flow model used to drive the simulation of the dispersion of material released during placement at the site had an ebb direction of 228 o N and a flood direction of 38 o N. Examination of the few disposal activities at locations which are close to the tidal streamline that would take material to the monitoring location shows that these placements often took place on the north eastwards flowing (flood) phase of the tide. Thus material placed at these locations would have dispersed significantly before returning past the monitoring position. In essence there is little data to directly compare between the observations and the results of the plume modelling for offshore disposal. The material disposed at the offshore site was placed approximately midway between the centre of the disposal site and the south eastern limit of the site. In the EIA (HR Wallingford, 2004b) predictions were presented for disposal centred on the north western quadrant of the site and at the south eastern limit of the 13
14 disposal site. The south eastern location was proposed as a means of limiting potential impacts on the Sabellaria beds. The impacts of the disposal activity should fall between these two predictions. Thus the effective mitigation measures to limit impacts on the Sabellaria bed to the south west of the disposal site may have been reduced compared to that proposed in the EIA. Collins (2007) reports on the ongoing monitoring of the Sabellaria bed area in Poole Bay. No detrimental effects attributable to the disposal were noted. Sediment depth monitoring using a series of metal poles in the seabed showed no new accumulation of sediment post disposal. As an early part of the EIA studies an interim assessment of sand transport rates at the disposal site concluded that sand fluxes at the site would be towards the south west and that these fluxes would be as much as 4 dry tonnes/m/spring tide with little transport occurring on neap tides (HR Wallingford, 2004a) assuming a limited availability of sand on the sea bed away from the disposal site. The width of the zone used within the south east quadrant of the disposal site for placement was about 500m measured across the tidal stream. The time between the commencement of disposal in November 2005 and the post placement survey of the site in July 2006 is about 8 months. This means that the transporting potential for sands away from the placement site is about 450,000 dry tonnes. Assuming an in-situ dry density for the sandy material on the disposal site of about 1,700kg/m 3 would imply that the tidal flows across the disposal site would be expected to transport about 270,000m 3 of sandy material away from the site towards the south west. This prediction demonstrates that the measured accumulation of 400,000m 3 of material at the site in July 2006 is consistent with the placement of some 710,000m 3 of material at the site during the dredging works. Fine sands and silts would also have been lost from the beaches during the beach nourishment process. Whilst the proportion of fines (<60 microns) in the material placed on the beaches is understood to have been very low (a few percent) fines released from the beaches would have dispersed within Poole Bay in a different manner to material placed at the offshore disposal site. Loss of fines from the beach nourishment process was not considered within the EIA studies. 5. Conclusions The physical monitoring associated with the offshore disposal of dredged material has provided results which are consistent with the hydraulic studies undertaken to support the EIA. No evidence of increased suspended sediment concentrations near the disposal site during disposal activity has been observed. It is noted that the timing of the monitoring and the location of the monitoring instruments was not optimum with respect to detecting the effects of disposal activity. Records of the disposal activity are limited. Van Oord have reported information on volumes placed but have not provided information that permits the associated dry tonnage of material placed at the site to be assessed. 14
15 Based upon the Van Oord reporting there were four occasions when placements at the disposal site in a 24 hour period slightly exceeded the licence limit of 20,000m 3 per day. The difference between bathymetric surveys of the site in September 2005 and July 2006 provide evidence of the placement activity and are consistent with sediment transport theory that would indicate that nearly half of the placed material should have been dispersed from the disposal site by currents alone between November 2005 and July References Partrac (2006). Measurement of Suspended Sediment Concentration & Tidal Current During Dredging Operations and Post-Dredge at the Offshore Disposal Area, Poole, Dorset, May Collins K.(2007) Poole Bay/Harbour marine habitat surveys: Post Channel deepening EIA studies Progress report to Poole Harbour Commissioners, February HR Wallingford (2004a) Interim note on disposal studies for Poole Harbour Channel Deepening, Technical Note dated 19 th April HR Wallingford (2004b) Poole Harbour Approach Channel Deepening, Hydrodynamic and sedimentations studies, Report EX 4945, November 2004, Technical Annex to EIA. HR Wallingford 17 th May