Thriving During Climate and Water Change: Strategies for the 21 st Century
|
|
|
- Maximillian Goodman
- 5 years ago
- Views:
Transcription

1 Thriving During Climate and Water Change: Strategies for the 21 st Century Defining the New Normal 33 rd Annual Executive Briefing Water Education Foundation March 17, 2016 Sacramento, CA Brad Udall Colorado State
2 * Climate Change Science Climate Change is Water Change Recent Climatology California, Colorado Droughts Temperature Linkage Megadroughts Reasons for Optimism Paris US Technology, Economics Some Strategies

3
4 Back to Back Records 2014, now 2015 No Pause or Hiatus Accelerating Trend?


5 American Geophysical Union Fall Meeting San Francisco December every Year 24,000 Earth Scientists Fully Accepted Science Earth is Warming Humans are the Cause Very Risky to Burn Carbon unabated Water Cycle will be Impacted Theory vs Belief
 results in Water Cycle changes More Evaporation, More Precipitation, More Moisture Changes in weather patterns Wet")
6 Climate Change is Water Change Heat Drives the Water Cycle 1000 km3 evaporates daily from the oceans The Water Cycle mixes heat from areas of too much to too little As the Atmosphere Warms it Holds More Moisture: ~5F warming is 20% increase Heating Up the Earth (and uneven heating) results in Water Cycle changes More Evaporation, More Precipitation, More Moisture Changes in weather patterns Wet Wetter, Dry Drier Standard Rule More Intense Floods and Droughts All Kinds of Water Changes Already Noted More rain/less snow, Earlier Runoff, Higher Water Temps, More Intense Rain

7 IPCC: All Kinds of Observations are Consistent with Climate Change Expectations. 7 out of 10 are water cycle related here Up by 5%, Consistent with 7%/C Max Rate Up by 1.4F Since 1950, May exceed 7F by % decline in June in NH Up by ~0.5F since 1950 Up by 8 since 1900, may reach 1m by % of energy from warming here
8 Projections for 2081 to 2100 Precipitation is not runoff! ~ 30 North ~ 30 South Source: IPCC 2013

9 Hadley Cells Jet Stream
10 * Climate Change Science Climate Change is Water Change Recent Climatology California, Colorado Droughts Temperature Linkage Megadroughts Reasons for Optimism Paris US Technology, Economics Some Strategies
11 California Climate Indicators Swain, 2015
 Snowpack Lowest Ever - 5% on April 1 (1977 at 25%) 500-Year (?) Return Period Drought Worst in 1200 (?")
12 California Drought Winter Temperatures Sierra Winter Above 32 F, (1 st time >32F in 120 years) Sierra Precipitation Rain, not Snow Not the driest! (40% to 90% of normal) Snowpack Lowest Ever - 5% on April 1 (1977 at 25%) 500-Year (?) Return Period Drought Worst in 1200 (?) Years Water Deliveries Record Low to CVP Contractors Snow normally
13 CA Precipitation and Temperature Year Anomalies relative to mean Mann & Gleick 2015

14 California Snowpack as of March 16, % of April 1 Avg 93% of Normal for March 16


15 Strong El Nino Precipitation Pattern But this year,the Hadley cell has actually strengthened a bit more than expected. ~ Dan Swain, Feb 1, 2016

16

17

18 Colorado River Runoff Projections, March 1, /16/16 Lake Powell Forecast is 73% of Average Colorado Forecast Numbers

19 May 2015 was the country s wettest May since records began 121 years ago. In fact, it was the wettest month ever recorded!
20 * Climate Change Science Climate Change is Water Change Recent Climatology California, Colorado Droughts Temperature Linkage Megadroughts Reasons for Optimism Paris US Technology, Economics Some Strategies

21 Running dry: The U.S. Southwest's drift into a drier climate state Weather Patterns that provide winter precipitation are becoming less frequent due to Hadley Cell Expansion. Southwest Precipitation has declined by 25%. Prein et al, 2016
 and accumulated moisture deficits worse than any previous continuous span of dry")
22 The current event is the most severe drought in the last 1200 years, with single year (2014) and accumulated moisture deficits worse than any previous continuous span of dry years.


23
24 No change in precipitation over last few decades But the occurrence of drought has increased in last two decades over previous century The probability that precipitation deficits occur with warm temperatures has increased The probability that precipitation deficits produce drought has increased We therefore conclude that anthropogenic warming is increasing the probability of co-occurring warm dry conditions like those that have created the acute human and ecosystem impacts associated with the exceptional drought in California.


25


26 2015 is unprecedented in the context of the last 500 years Source: Belmecheri et al., Nature Climate Change, September 14, 2015

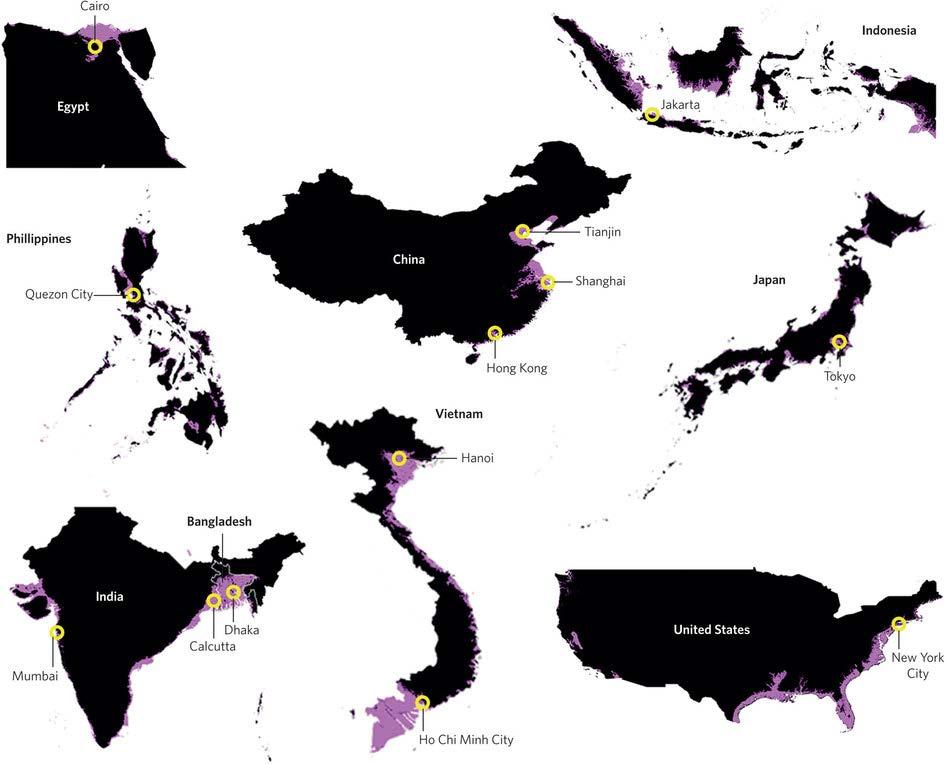
27 California has 3 rd largest population at risk in 2100 to Sea Level = = 1m Hauer et al, 2016


28 Current 15-Year Colorado River Drought only has 40% of the Precipitation Decline associated with similar 1950s drought. You have to invoke temperatures to explain current drought. Up to 50% of current decline due to high temperatures. Source: Udall & Overpeck 2016, in review

29 Colorado River Future Flow Losses Climate Change a combination of 1. For-Sure Temperature Rise -> Flow Losses 2. Not-Sure Precipitation Change -> Flow Gains?

30 Cook Science In both Central Plains and Southwest, Multidecadal Drought Risk* exceeds 80% in 21 st Century * Defined as Drought lasting 35 or more years Percent Chance of Multi- Decadal Drought Risk, Southwest US
31 Increasing influence of air temperature on upper Colorado River streamflow Woodhouse et al, 2016 Understanding Uncertainties in Future Colorado River Streamflow Vano, et al, 2014 Projections of declining surface-water availability for the southwestern United States Seager et al, 2012 The Unusual Nature of Recent Snowpack Declines in the North American Cordillera Pederson, et al, 2011 Future dryness in the southwest US and the hydrology of the early 21st century drought Cayan, et al, 2010 Dry Times Ahead Overpeck and Udall, 2010 Model Projections of an Imminent Transition to a More Arid Climate in Southwestern North America Seager et al, 2009 Water supply risk on the Colorado River: Can management mitigate? Rajagopalan et al, 2009 When Will Lake Mead Go Dry? Barnett and Pierce, 2008 Attribution of Declining Western U.S. Snowpack to Human Effects Pierce, et al, 2008 Warming may create substantial water supply shortages in the Colorado River basin McCabe and Wolock, 2007
32
33 * Climate Change Science Climate Change is Water Change Recent Climatology California, Colorado Droughts Temperature Linkage Megadroughts Reasons for Optimism Paris US Technology, Economics Some Strategies

34 Paris, France 195 Nations December 12, 2015
35 UN Framework Convention on Climate Change - UNFCCC 1988 IPCC Created 5 Scientific Assessments since UNFCCC avoid dangerous climate change 1997 Kyoto Protocol Excluded Developing Countries DOA in US Senate No goals beyond Paris Agreement 195 Countries INDC s Revisit Commitments every 5 Years Goal : well-below 2C Also pursue 1.5C
36

37 Book: Struggling for Air 200 Coal Plant Retirements since 2009
38 US Emissions Peaked 2007 Emissions by Sector US Emissions by Sector Source: EPA 2014 GHG Inventory


39 Levelized Cost of Energy Solar $43 to $300 Wind $32 to $77 Efficiency $0 to $50 Coal $65 to $150 Gas CC $52 to $78

40

41

42 A Path to Renewables for All U.S. Energy Use
43 Solutions Some Good, Some Bad System Benefits Charge Continued Municipal Conservation 1%/Year Desalination? Weather Modification? Markets Diets? Reductions / Flex in Agriculture Water Law Changes
44 Conclusions Climate Change Defining Issue of 21 st Century Water at the heart of impacts We can legislate away drought Have technical/economic capacity to banish climate change but maybe not political will Solutions at hand, but need to pursue with all possible haste Many Water Solutions Possible But nothing is easy

45

46 Earth is about 60F warmer than it should be Very Small Concentrations of Greenhouse Gasses (GHGs) are the cause. CO 2 is most important one. Earth s Temperatures have fluctuated widely over its 4.5B year history But NOT during human ascendency of last 2k years Humans are adding enormous amounts of GHGs to the atmosphere every day and it is increasing over time. On a path to double CO2 by 2050 Planet is now 1.8 F warmer due to GHG emissions. No other plausible explanation for the warming Total Warming will be related to GHG concentrations, not emissions *

47 Projected Drying in U.S. Southwest Regional to global-scale projections of soil moisture and drought remain relatively uncertain compared to other aspects of the water cycle. Nonetheless, drying in the Mediterranean, southwestern U.S. and south African regions are consistent with projected changes in Hadley circulation, so drying in these regions as global temperatures increase is likely for several degrees of warming under the RCP8.5 scenario. Soil

48 Latest Climate Model Projections (Ensemble average of 39 global models) Projected Annual Precipitation Change by the End of Century Given Continued High Emissions Driest 25% Middl e 50% Wettest 25% IPCC, 2013 Bottom-line: North gets wetter, South drier. But note that precip is not runoff.

49 Latest Climate Model Projections (Ensemble average of 39 global models) Projected Annual Temperature Change by the End of Century Given Continued High Emissions Driest 25% Middl e 50% Wettest 25% IPCC, 2013 Bottom-line: Western US will get hotter for sure, perhaps much hotter

50 Projected Changes in Snowpack, Runoff, and Soil Moisture Declines in April 1 Snow (SWE) indicate the start of runoff will advance into March Total Snow may or may not change depending on precipitation changes Not shown: increases in runoff during the Winter Source: 2014 National Assessment

51 IPCC FAR Results RCP 8.5 at 2081 to 2100
52 Science, June 25, F Warming since 1900 Snowpack Reductions and Changes in Runoff Timing Already Present Most Severe Drought since records kept Powell and Mead at 50% of capacity now, full 2000 Tree Mortality Rates High Increase in Wildfire Frequency Drought may be natural, but exacerbated by higher temperatures Snowpack Reductions and Runoff Timing attributed to climate change Continued drying likely as temperatures increase and storm tracks shift Megadroughts independent of climate change a possibility with severe consequences if combined with warming

53 Stuff and Science, February 1, 2008 Water resource planning uses climate stationarity climate of the future = the climate of the past Less and less true as we move forward Both supply and demand are changing New water projects have substantial uncertainty
54 Historic ENSO Years 27 in total 16 ENSO Above Average 60% W = weak ENSO 11 ENSO Below Average 40% M = moderate ENSO S = strong ENSO Hoerling et al, 2015

55 One Measure of El Nino Southern Oscillation
 LED Lights Nissan Leaf Battery $15k")


56 Technology Reasons for Climate Optimism PV - $10 to $0.50 over 2 decades Wind less than Gas Now 200 Fewer Coal Plants (325 now) LED Lights Nissan Leaf Battery $15k to $5k Storage a top priority but not needed for a while International Commitments at Paris First Ever Agreement with 195 Countries US Efforts Clean Power Plan no more coal built 32% by 2032 relative to 2005 US GHG Emissions have likely peaked World Efforts Emissions declined globally last year Science Implications Will be able to rule out higher emissions soon Future still a challenge Will blow by 2C warming most likely We just spent 20 years wasting time on getting an interanational agreement


57

58 Replaces ALL lost jobs in current energy sector +2m Saves ~$250/year per person in energy costs at % renewable by 2035, 100% by 2050 Avoids ~50,000 premature deaths per year Uses very little land base ~0.4%

59