Appendix F HYDROLOGY/WATER QUALITY REPORT TIESLAU CIVIL ENGINEERING
|
|
|
- Branden Randall
- 5 years ago
- Views:
Transcription
1 Appendix F HYDROLOGY/WATER QUALITY REPORT TIESLAU CIVIL ENGINEERING
5 4 6-0 8 6 1 8 0 7 9 N o rt h L ak e B lv d, K i n g s B ea c h, C A 9 6 1 4 3 fa x : (5 3 0 )5 4 6-0 8 7 1 TAHOE VISTA RECREATION AREA")
2 T IE S L A U C I V IL E N G I NE E R IN G, IN C. P.O. B o x , K i n g s B ea c h, C A p h : (5 3 0 ) N o rt h L ak e B lv d, K i n g s B ea c h, C A fa x : (5 3 0 ) TAHOE VISTA RECREATION AREA PHASE 2B SITE IMPROVEMENTS HYDROLOGY AND WATER QUALITY STUDY November 21,, 2011 Client: Engineer: North Tahoe Public Utility District Tieslau Civil Engineering, Inc. PO Box 139 P.O. Box 2297 Tahoe Vista, CA Kings Beach, CA (530)
3 TABLE OF CONTENTS INTRODUCTION 2 PROJECT DESCRIPTION.2 SATURATED HYDRAULIC CONDUCTIVITY (KSAT).3 GROUNDWATER...3 PRECIPITATION. 3 EXISTING DRAINAGE..4 PROPOSED DRAINAGE 4 BEST MANAGEMENT PRACTICES (BMPs) TEMPORARY BMPS..6 REGULATORY OVERSITE... 6 CONCLUSIONS AND RECOMMENDATIONS... 7 VICINITY MAP YEAR 1-HOUR STORM HYDROLOGY CALCULATIONS AND 20 YEAR-1 HOUR DRAINAGE PLAN WATERSHED MAPS (EXISTING, PROPOSED).10 PLACER COUNTY SMALL WATERSHED WORKSHEETS EXISTING CONDITIONS..11 PLACER COUNTY SMALL WATERSHED WORKSHEETS PROPOSED CONDITIONS 12 FIGURES 5-3A, 5-3C..13 HYDROGRAPHS
4 INTRODUCTION This report analyzes the 100 year and 20 year 1 hour storm events contributing to stormwater runoff at and near the Tahoe Vista Recreation Area, Phase 2B improvement project at Tahoe Vista, CA. This report also addresses runoff from both existing and proposed conditions and analyzes the proposed drainage facilities ability to treat and infiltrate the 1.0-inch of runoff generated from the 20-year 1-hour storm. Also addressed within the report are the water quality objectives and proposed water treatment measures. Tahoe Vista Recreation Area Phase 2B is the final phase of a multi-year public park improvement project. The project consists of a parking lot for automobiles and vehicles with boat trailers to support the existing boat ramp and beach area. Other improvements include landscaping, stormwater BMP s and a paved walking/bike trail along National Avenue. The previous phases are located south of the current parcel across SR 28 and along Lake Tahoe s shoreline. Included in previous phases were the construction of a plaza, pedestrian and bike paths, renovations to the existing boat launch area and improvements to the courtesy docks adjacent to the harbor sheet pile retaining structure. The proposed site improvements are located at and to the west of the intersection of Hwy 28 and National Avenue in Tahoe Vista, CA. The proposed project includes the following improvements: Boat trailer parking and day-use parking and associated paved circulation Multi-use asphalt path along National Avenue, landscaping, sidewalk and community plan improvements along State Route 28 and National Avenue Stormwater drainage facilities SITE DESCRIPTION The property is located at the Northwest corner of North Lake Boulevard (SR 28) and National Avenue intersection (Section 14, Township 16N, Range 17E, APN # ) in Tahoe Vista, California. The site is currently a wooded vacant lot consisting of approximately 3.6 acres. The site is relatively gently sloping with a grade following National Avenue ranging from about 2% to 6%. Soil type has been mapped JwD(6) and EbC(6) by the Tahoe Regional Planning Agency for the project property. The site generally drains south across existing project area to the northern shoulder of State Route 28. Runoff from the northern side of the highway enters a drainage system and daylights to a restored stormwater infiltration area at the terminus of National Ave and adjacent to Lake Tahoe. 2
5 SATURATED HYDRAULIC CONDUCTIVITY (Ksat) Ksat refers to the ease with which pores in a saturated soil transmit water. The estimates presented here are expressed in terms of inches per hour. Ksat values are based on soil characteristics observed in the field at different elevations within the soil profile. Tests were performed at several locations at the project site where stormwater infiltration facilities are proposed. Tests were conducted in November 2011 using a Constant Head Permeameter (constructed per Natural Resource Conservation Service guidelines) to measure on-site Ksat. Testing resulted in values of Ksat values ranging from 2 /hr to 13 /hr. A conservative weighting of Ksat values should be used for the project area. The recommended value for the project area is 2 /hr. GROUNDWATER Depth to groundwater was measured within the Project area during the geotechnical investigation by H+K Geotechnical in November of Generally, the groundwater elevation was determined to be approximately 10 feet below existing grade. Grading depth in excess of 5 ft below existing grade is not proposed so encountering groundwater is not expected during construction. PRECIPITATION The Project site is located in Tahoe Vista, CA which is roughly 15 miles east of the Sierra Nevada Crest. The elevation within the Project area ranges between 6230 feet and 6400 feet and the mean annual precipitation is approximately 36 inches per year. Precipitation occurs primarily as snow during the winter months along with summertime thundershowers. Twenty-four hour precipitation intensities were compiled using precipitation data from Placer County Stormwater Management Manual (Placer County 1990) and the U.S. EPA Stormwater Management Model (SWMM). The peak inflows to the Project area for the water quality and flood control design storms were calculated using guidance from the Placer County Stormwater Management Manual. 3
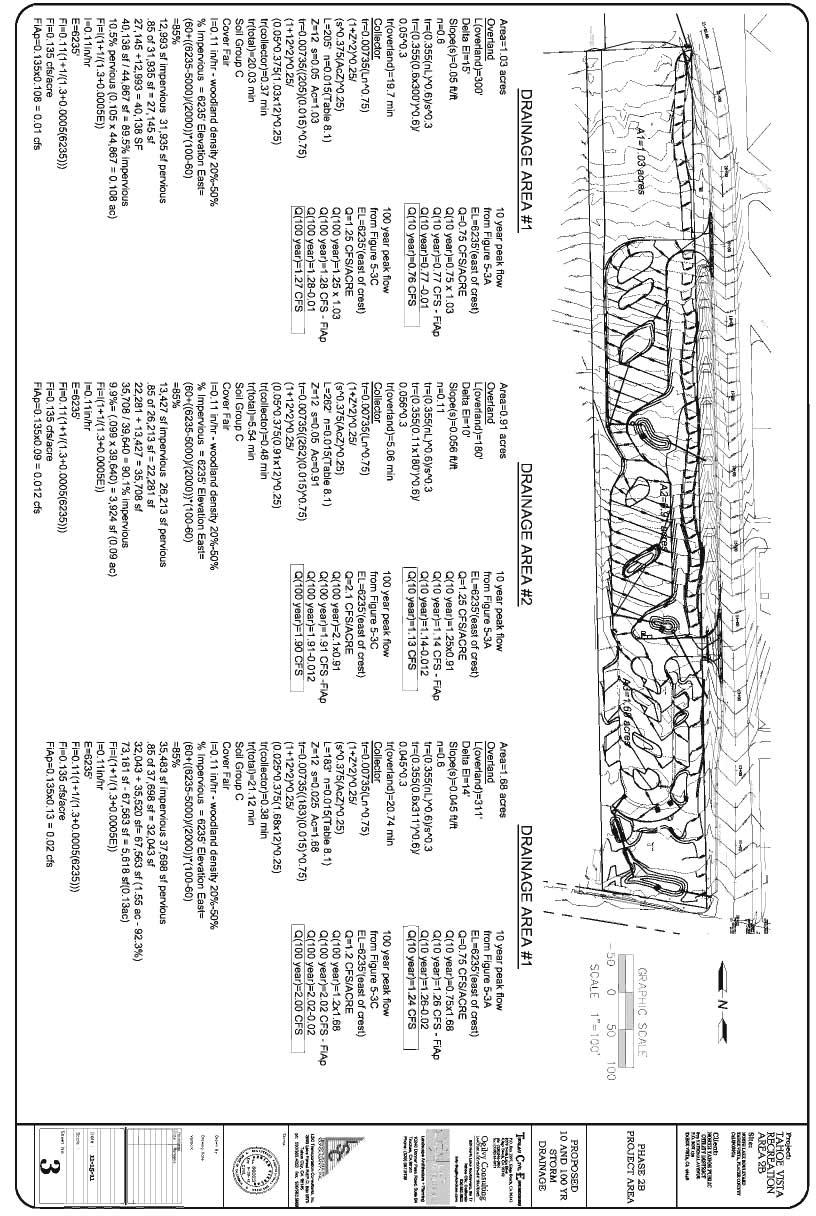
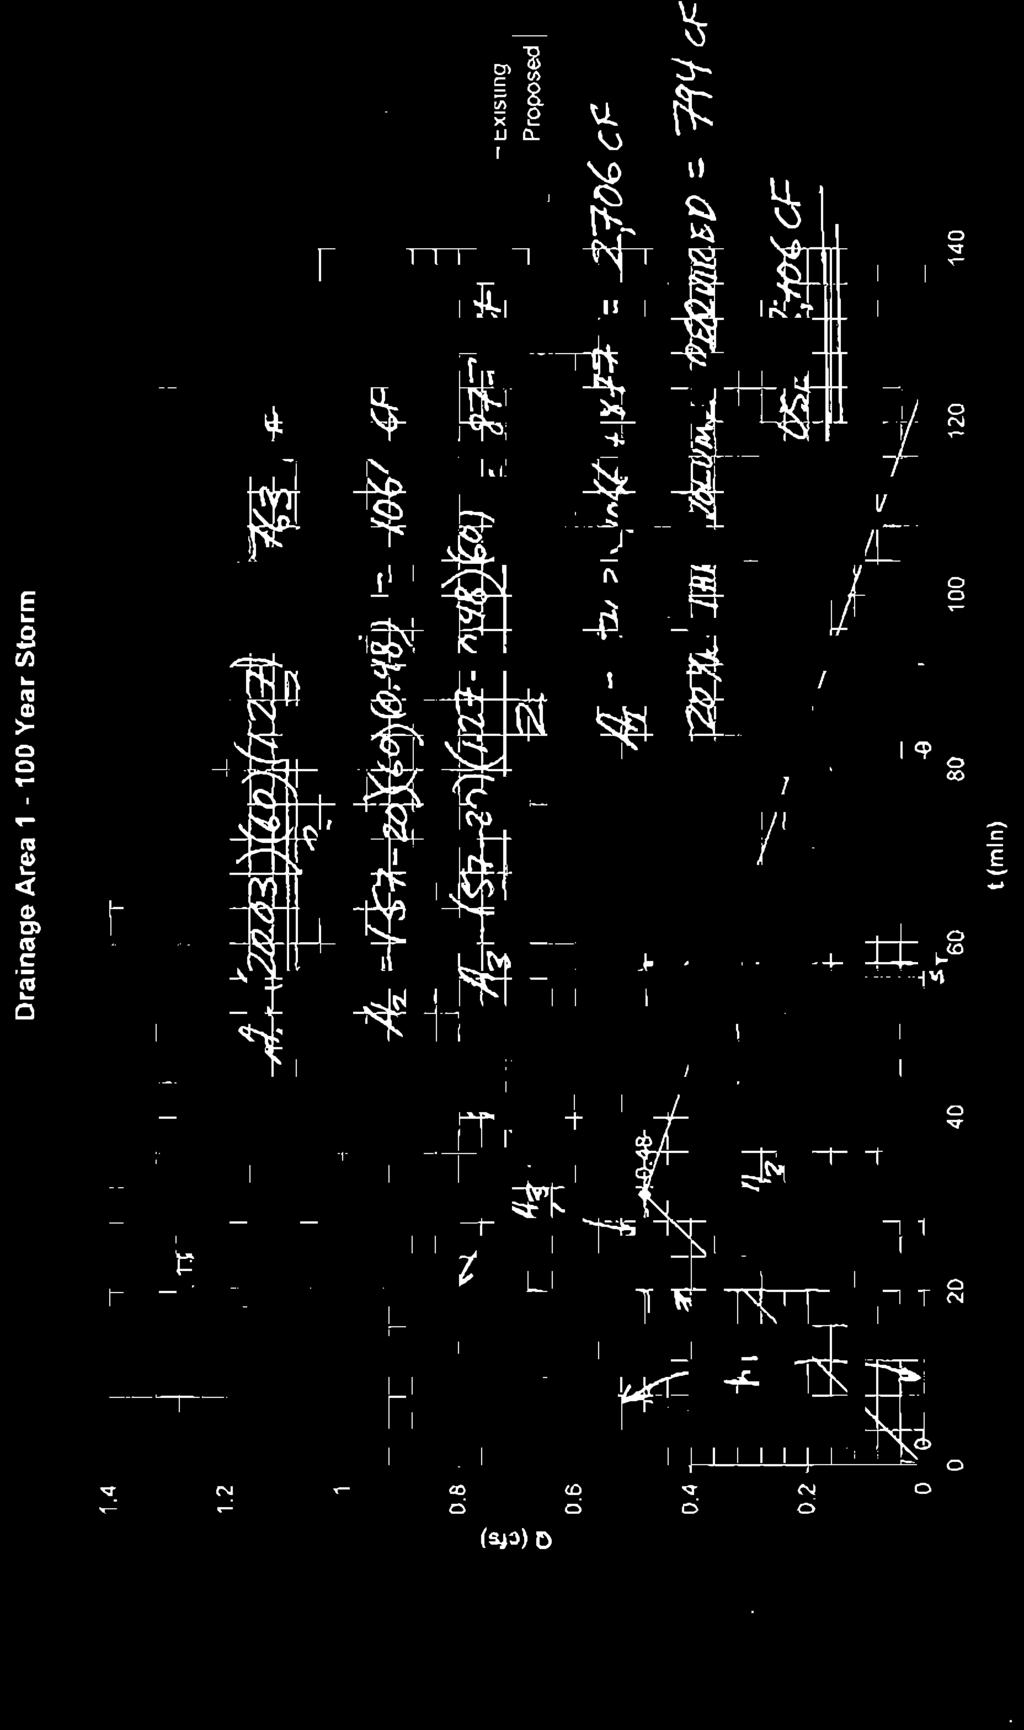
6 EXISTING DRAINAGE This section describes the existing hydrology and stormwater flow paths for the project. Existing stormwater drainage has been divided into three main drainage areas. Existing drainage area 1 is a 0.49 acre portion of the north end of the project site which generates stormwater volume that flows as overland flow for 600 feet, as specified by the Placer County Stormwater Management Manual, to the existing treatment swale at National Avenue. Flow in the existing treatment swale continues south and enters the State Route 28 drainage system below flowing to Lake Tahoe. Existing drainage area 2 is a 0.80 acre middle portion of the of the project site which generates stormwater volume that flows as overland flow for 600 feet, as specified by Placer County Stormwater Management Manual, and then as collector flow (as specified by the Placer County Stormwater Management Manual) for 285 linear feet to the existing treatment swale all National Avenue. Flow in the existing treatment swale continues south and enters the State Route 28 drainage system below flowing to Lake Tahoe. Drainage area 3 is a 2.44 acre lower portion of the of the project site which generates stormwater volume that flows as overland flow for 600 feet, as specified by Placer County Stormwater Management Manual, before becoming collector flow for 285 feet and outleting to the existing treatment swale all National Avenue. Flow from the three drainage areas as well as the flow in the existing treatment swale continues south and enters the State Route 28 drainage system below flowing to the stormwater infiltration area adjacent to Lake Tahoe. PROPOSED DRAINAGE Proposed stormwater drainage consists of the three main watersheds which have outfall locations in similar locations to the three existing drainage areas. Each of these watersheds captures and conveys water to individual stormwater detention / treatment basins within each watershed. These stormwater detention basins have been conservatively sized to capture the greatest volume of stormwater generated by the Placer County Small Watershed Worksheets calculations and the Tahoe Regional Planning Agency 20 year 1 hour storm calculations. Overflow is provided from these sub-watersheds to the existing drainage swale along National Avenue and to the State Route 28 drainage system. Proposed drainage area 1 will contribute stormwater runoff from 1.03 acres of the project area consisting of the north end of the project area, asphalt parking and bike path. Flow is modeled as overflow flow for 600 linear feet before entering a concrete valley gutter for 205 linear feet. Generated flow then enters a pre-treatment stormwater structure and is discharged to a stormwater detention basin (Stormwater Basin #1). Overflow from this basin is discharged to the existing treatment swale along National Avenue. Placer County 4
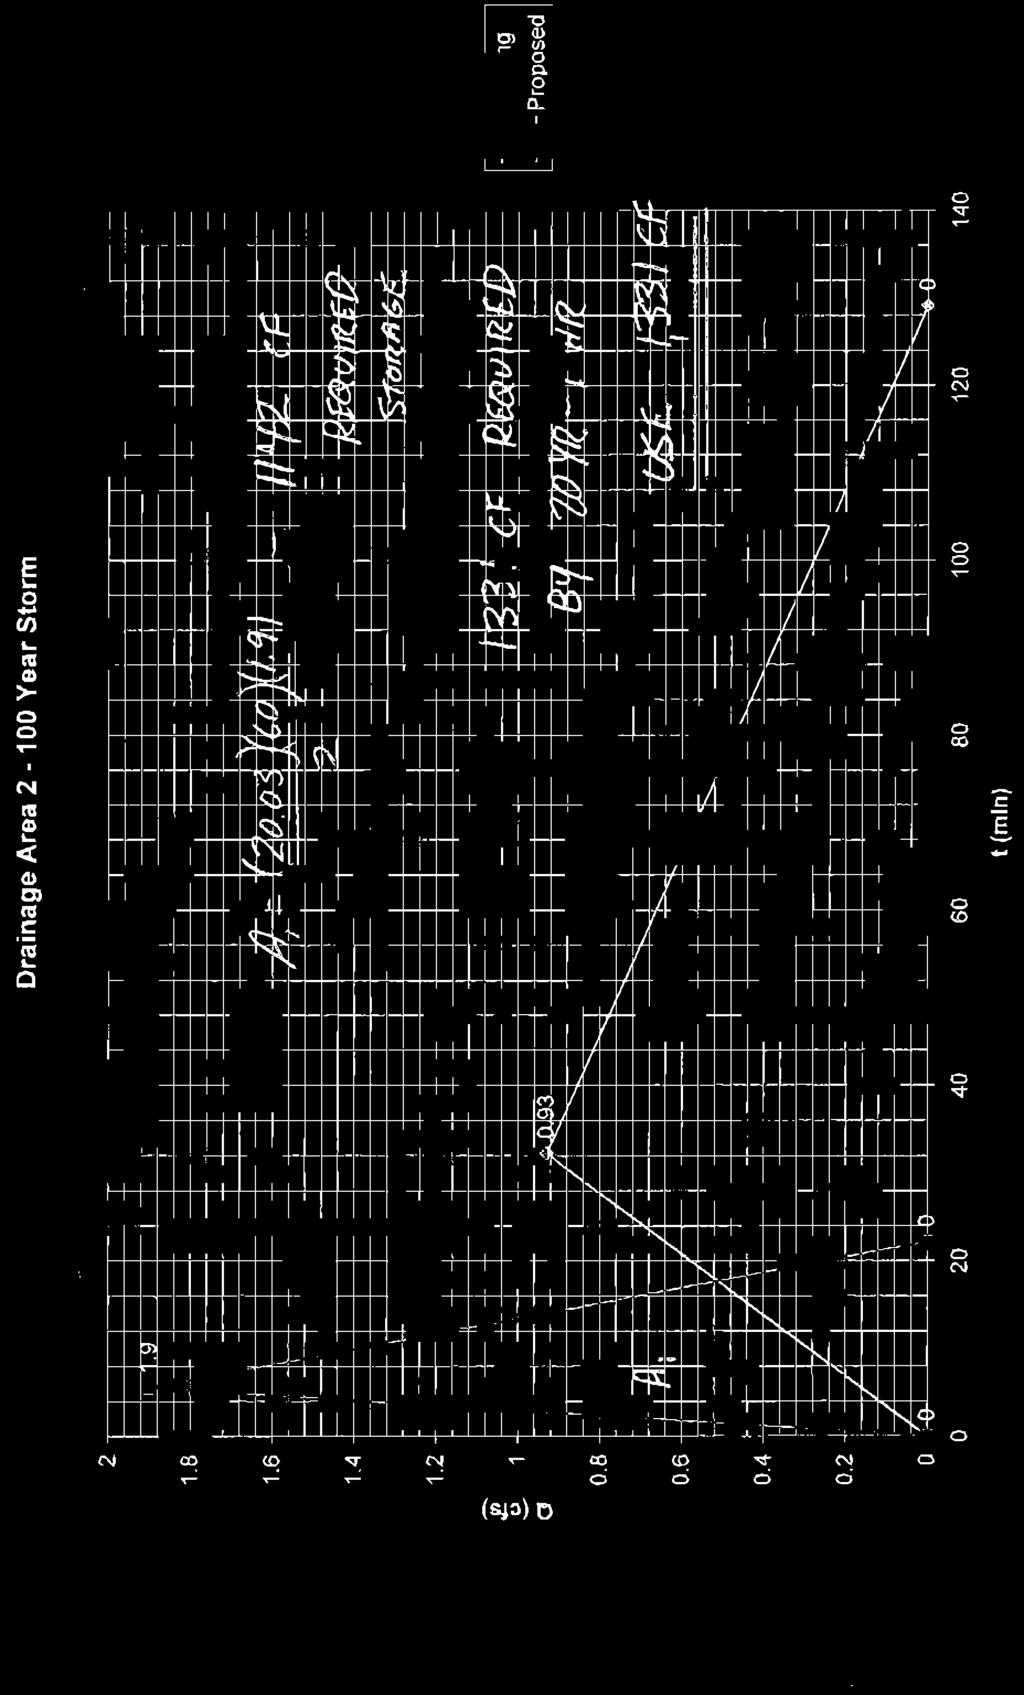
7 Small Watershed Worksheets yield a peak 100 year storage volume of 2,706 cubic feet required for this stormwater detention basin which is significantly above the 20 year 1 hour storm volume requirement of 794 cubic feet. Proposed drainage area 2 will contribute stormwater runoff from 0.91 acres of project area consisting of the middle of the project area, asphalt parking and bike path. Flow is modeled as overflow flow for 180 linear feet before entering a concrete valley gutter for 262 linear feet. Generated flow then enters a pre-treatment stormwater structure and is discharged to a stormwater detention basin (Stormwater Basin #2). Overflow from this basin is discharged to the existing treatment swale along National Avenue. Placer County Small Watershed Worksheets yield a peak 100 year storage volume of 1,142 cubic feet required for this stormwater detention basin which is below the 20 year 1 hour storm volume requirement of 1,331 cubic feet, so 1,331 cubic feet has been used in the project design. Proposed drainage area 3 will contribute stormwater runoff from 1.68 acres of the project area consisting of the southern end of the project area, asphalt parking, bike path and pedestrian walkways. Stormwater flow is modeled as overland flow for 311 linear feet before entering a concrete valley gutter for 183 linear feet. Generated flow will then enter a pre-treatment stormwater structure and is discharged to a stormwater detention basin (Stormwater Basin #3). Overflow from this basin is discharged to the existing treatment swale along National Avenue. Placer County Small Watershed Worksheets yield a peak 100 year storage volume of 2,028 cubic feet required for this stormwater detention basin which is below the 20 year 1 hour storm volume requirement of 2,045 cubic feet, so 2,045 cubic feet has been used in the project design. BEST MANAGEMENT PRACTICES (BMP S) / MEDIA FILTRATION SYSTEMS Water quality impacts associated with this project will be mitigated through the installation and operation of the following Best Management Practices (BMP s). Project compliance with the Tahoe Regional Planning Agency (TRPA) permit and Lahontan Regional Water Quality Control Board permit will assist to ensure the project includes required BMPs. Advanced pre-treatment stormwater treatment systems and/or media filtration systems which are designed to treat onsite pollutants area proposed for the project. System will be designed to treat target pollutants of concern. Inspection and Maintenance of the temporary and permanent BMPs. o Stormwater basin will be monitored for sediment on an annual basis o Each inspection of the installed filtration systems should include broom sweeping the area around the inlet, removal of the inlet grate, removal of 5
8 trash and debris and visual inspection of the media treatment units for gross quantities of captured sediment. o The parking area and catch basins shall be inspected on a monthly basis. Sweeping of parking and cleaning of catch basins shall be performed per results of inspection and at a minimum of three times annually. TEMPORARY BMPS Temporary BMPs will be installed prior to grading activities and during construction activities bringing potential water quality impacts to a less than significant level. The temporary BMPs are shown on the project drawings. A Stormwater Pollution Prevention Plan (SWPPP) will be prepared to obtain an NPDES permit from the Lahontan Regional Water Quality Control Board (LRWQCB) prior to construction. Detailed BMPs and measures to protect will be described in the SWPPP. Filter fabric will be placed around the grates of the existing and proposed drainage inlets. Temporary erosion control fencing will be placed in down gradient areas and bare areas will be scarified, mulched and revegetated as part of the winterization and permanent erosion control. Temporary vegetation protection fencing will be placed around trees prior to construction. Measures to prevent accidental discharges of hazardous materials into surface or groundwater will also be described in the SWPPP. Construction of the Project would not violate any water quality standards or waste discharge requirements with implementation of construction controls during construction as required by the Lahontan RWQCB permit. REGULATORY OVERSITE In addition to complying with state and federal water quality standards, all point sources that discharge into waters of the U.S. must obtain a NPDES permit under provisions of Section 402 of the Clean Water Act. In California, the State Water Resources Control Board (SWRCB) and RWQCBs are responsible for the implementation of the NPDES permitting process at the state and regional levels, respectively. The NPDES permit process also provides a regulatory mechanism for the control of non-point source pollution created by runoff from construction and industrial activities, and general and urban land use, including runoff from streets. Projects involving construction activities (e.g., clearing, grading, or excavation) involving land 6
9 disturbance greater than one acre must file a Notice of Intent with the RWQCB to indicate their intent to comply with the applicable State General Permit (GP) for Stormwater Discharges Associated with Construction Activity. This project involves land disturbance over an area over one acre in size, so a permit will be obtained through the Lahontan RWQCB. The permit will require the generation and approval of a SWPPP. The Tahoe Regional Planning Agency (TRPA) was established in 1969 by U.S. Congress as a bi-state agency (California and Nevada) to adopt threshold environmental quality standards and enforce ordinances created to support threshold standards. The TRPA adopted seven water quality thresholds to help to protect and maintain Tahoe basin water quality. TRPA regulates many things including land use and site development projects and includes threshold standards established for water quality, including specific pollutant concentrations for surface runoff and waters infiltrated into soils. The owner of the Project must obtain a permit from TRPA prior to construction. Placer County is a major funding source for this project and will review the project for flood control concerns as well as drainage and traffic impacts to the National Avenue County right-of-way. The owner of the Project must obtain a permit from Placer County prior to construction. CONCLUSIONS AND RECOMMENDATIONS The proposed project will have a flood control benefit by attenuating and reducing peak flows leaving the site and the project will have a water quality benefit by treating and infiltrating runoff generated from the 20 year 1 hour storm. The project will be designed to meet local water quality requirements established by the Tahoe Regional Planning Agency and the Lahontan Regional Water Quality Control Board utilizing the best stormwater treatment technology available. Project design will also be accordance to flood control standards as required by Placer County and in accordance with the Placer County Stormwater Management Manual. 7
10 VICINITY MAP 8

11
12 20-YEAR 1-HOUR STORM HYDROLOGY CALCULATIONS AND 20-YEAR 1-HOUR STORM DRAINAGE PLAN 9
13 BMP Calculation Spreadsheet with Version 8 Soil Data Property Address: FDS Drain Rock Quantity (yd 3 ) 0.0 Property Address: 6965 N LAKE BLVD MAP DATA ON-SITE DEPTHS Water Quality Drain Rock Quantity (yd 3 ) in. APN: APN lookup Water Table: Total Drain Rock Quantity (yd 3 ) 0.0 Date: 11/1/11 Restriction: None noted Total Runoff Calculated (ft 3 ) at Max. Depth of Install: Map Unit: Total Excavation (yd 3 ) Designed By: 48 in Contributing Surface D D2 T T # of Stories 0 0 o o Length (ft.) 8 2 t t Width (ft.) 1 1 a a Area (ft 2 ) l 0 0 l 0 0 Runoff (ft 3 ) Treatment Label: D1 D2 Length (ft.) Width (in.) Depth (in.) 4 0 On-Site Ksat ( in / hr ) mapped Ksat ( in / hr ) Prefab Void Space (%) Average Void Space (%) 40% 40% 40% 40% 40% 40% 40% Effective Volume (yd 3 ) Treatment Capacity (ft 3 ) Drain Rock Quantity (yd 3 ) Excess Runoff (ft 3 ) Excess Capacity (ft 3 ) Contributing Surface # of Stories Length (ft.) Width (ft.) Area (ft 2 ) 0 0 T o t a l T o t a l T o t a l Runoff (ft 3 ) Treatment Label: Length (ft.) Width (in.) Depth (in.) On-Site Ksat ( in / hr ) mapped Ksat ( in / hr ) Prefab Void Space (%) Average Void Space (%) Effective Volume (yd 3 ) Treatment Capacity (ft 3 ) Drain Rock Quantity (yd 3 ) Excess Runoff (ft 3 ) Excess Capacity (ft 3 ) Contributing Surface A B C Length (ft.) Basin Notes: 2:1 (rock lined) 5:1 (mowable) Width (ft.) Area (ft 2 ) Runoff (ft 3 ) Treatment Label: A B C Top Length (ft.) Top Width (ft.) Depth (in.) Bottom Length (ft.) Bottom Width (ft.) Volume (yd 3 ) On-Site Ksat Mapped Ksat Treatment Capacity (ft 3 ) Excess Runoff (ft 3 ) Excess Capacity (ft 3 ) Contributing Surface Width (ft.) Treatment Label: Water Spreading Fire Defensible Space Length (ft.) On-Site Ksat Sheet: 1 Mapped Ksat of: 2 Min. Width (ft.) NO NO NO NO worksheet template date: 6/9/2008 Basin A - Capacity 2737 CF > Placer County flood control requirement of 2,706 CF This worksheet is intended to provide an estimate of proper dimensions of infiltration structures and represents no guarantee of the adequacy of overall system design. T o t a l T o t a l
14
15 WATERSHED MAPS Existing Conditions Proposed Conditions 10
16
17
18 PLACER COUNTY SMALL WATERSHED WORKSHEETS EXISTING CONDITIONS 11
19 Placer County Flood Control and Water Conservation District Small Watershed Peak Flow Worksheet Date: 11/20/2011 Engineer: Tieslau Project: TVRA2B Watershed: Area 1 EXISTING Area, acres 0.49 Elevation, ft 6235 Return Period 10 Length, ft Slope (V/H) Mannings n Response Time, min Overland Flow Collector Flow Collector Side Slope (ft hor/foot vert) = 0.50 Total Response Time, min Unit peak flow (cfs/acre) Figure 3A/3B/3C 0.62 See Infiltration Rate (inches/hr) 0.11 Infiltration Factor (cfs/acre) Percent Impervious 85 Watershed Peak Flow cfs Area x Unit Peak Flow - ((100 -% impervious) x Area x Infiltration factor)
20 Placer County Flood Control and Water Conservation District Small Watershed Peak Flow Worksheet Date: 11/20/2011 Engineer: Tieslau Project: TVRA2B Watershed: Area 1 EXISTING Area, acres 0.49 Elevation, ft 6235 Return Period 100 Length, ft Slope (V/H) Mannings n Response Time, min Overland Flow Collector Flow Collector Side Slope (ft hor/foot vert) = 0.50 Total Response Time, min Unit peak flow (cfs/acre) Figure 3A/3B/3C 1.00 See Infiltration Rate (inches/hr) 0.11 Infiltration Factor (cfs/acre) Percent Impervious 85 Watershed Peak Flow cfs Area x Unit Peak Flow - ((100 -% impervious) x Area x Infiltration factor)
21 Placer County Flood Control and Water Conservation District Small Watershed Peak Flow Worksheet Date: 11/20/2011 Engineer: Tieslau Project: TVRA2B Watershed: Area 2 EXISTING Area, acres 0.95 Elevation, ft 6235 Return Period 10 Length, ft Slope (V/H) Mannings n Response Time, min Overland Flow Collector Flow Collector Side Slope (ft hor/foot vert) = Total Response Time, min Unit peak flow (cfs/acre) Figure 3A/3B/3C 0.60 See Infiltration Rate (inches/hr) 0.11 Infiltration Factor (cfs/acre) Percent Impervious 85 Watershed Peak Flow cfs Area x Unit Peak Flow - ((100 -% impervious) x Area x Infiltration factor)
22 Placer County Flood Control and Water Conservation District Small Watershed Peak Flow Worksheet Date: 11/20/2011 Engineer: Tieslau Project: TVRA2B Watershed: Area 2 EXISTING Area, acres 0.95 Elevation, ft 6235 Return Period 100 Length, ft Slope (V/H) Mannings n Response Time, min Overland Flow Collector Flow Collector Side Slope (ft hor/foot vert) = Total Response Time, min Unit peak flow (cfs/acre) Figure 3A/3B/3C 1.00 See Infiltration Rate (inches/hr) 0.11 Infiltration Factor (cfs/acre) Percent Impervious 85 Watershed Peak Flow cfs Area x Unit Peak Flow - ((100 -% impervious) x Area x Infiltration factor)
23 Placer County Flood Control and Water Conservation District Small Watershed Peak Flow Worksheet Date: 11/20/2011 Engineer: Tieslau Project: TVRA2B Watershed: Area 3 EXISTING Area, acres 2.22 Elevation, ft 6235 Return Period 10 Length, ft Slope (V/H) Mannings n Response Time, min Overland Flow Collector Flow Collector Side Slope (ft hor/foot vert) = Total Response Time, min Unit peak flow (cfs/acre) Figure 3A/3B/3C 0.62 See Infiltration Rate (inches/hr) 0.11 Infiltration Factor (cfs/acre) Percent Impervious 85 Watershed Peak Flow cfs Area x Unit Peak Flow - ((100 -% impervious) x Area x Infiltration factor)
24 Placer County Flood Control and Water Conservation District Small Watershed Peak Flow Worksheet Date: 11/20/2011 Engineer: Tieslau Project: TVRA2B Watershed: Area 3 Existing Area, acres 2.22 Elevation, ft 6235 Return Period 100 Length, ft Slope (V/H) Mannings n Response Time, min Overland Flow Collector Flow Collector Side Slope (ft hor/foot vert) = Total Response Time, min Unit peak flow (cfs/acre) Figure 3A/3B/3C 1.00 See Infiltration Rate (inches/hr) 0.11 Infiltration Factor (cfs/acre) Percent Impervious 85 Watershed Peak Flow cfs Area x Unit Peak Flow - ((100 -% impervious) x Area x Infiltration factor)
25 PLACER COUNTY SMALL WATERSHED WORKSHEETS PROPOSED CONDITIONS 12
26 Placer County Flood Control and Water Conservation District Small Watershed Peak Flow Worksheet Date: 11/20/2011 Engineer: Tieslau Project: TVRA2B Watershed: Area 1 PROPOSED Area, acres 1.03 Elevation, ft 6235 Return Period 10 Length, ft Slope (V/H) Mannings n Response Time, min Overland Flow Collector Flow Collector Side Slope (ft hor/foot vert) = Total Response Time, min Unit peak flow (cfs/acre) Figure 3A/3B/3C 0.75 See Infiltration Rate (inches/hr) 0.11 Infiltration Factor (cfs/acre) Percent Impervious 89.5 Watershed Peak Flow cfs Area x Unit Peak Flow - ((100 -% impervious) x Area x Infiltration factor)
27 Placer County Flood Control and Water Conservation District Small Watershed Peak Flow Worksheet Date: 11/20/2011 Engineer: Tieslau Project: TVRA2B Watershed: Area 1 PROPOSED Area, acres 1.03 Elevation, ft 6235 Return Period 100 Length, ft Slope (V/H) Mannings n Response Time, min Overland Flow Collector Flow Collector Side Slope (ft hor/foot vert) = Total Response Time, min Unit peak flow (cfs/acre) Figure 3A/3B/3C 1.25 See Infiltration Rate (inches/hr) 0.11 Infiltration Factor (cfs/acre) Percent Impervious 89.5 Watershed Peak Flow cfs Area x Unit Peak Flow - ((100 -% impervious) x Area x Infiltration factor)
28 Placer County Flood Control and Water Conservation District Small Watershed Peak Flow Worksheet Date: 11/20/2011 Engineer: Tieslau Project: TVRA2B Watershed: Area 2 PROPOSED Area, acres 0.91 Elevation, ft 6235 Return Period 10 Length, ft Slope (V/H) Mannings n Response Time, min Overland Flow Collector Flow Collector Side Slope (ft hor/foot vert) = Total Response Time, min 5.54 Unit peak flow (cfs/acre) Figure 3A/3B/3C 1.25 See Infiltration Rate (inches/hr) 0.11 Infiltration Factor (cfs/acre) Percent Impervious 90.1 Watershed Peak Flow cfs Area x Unit Peak Flow - ((100 -% impervious) x Area x Infiltration factor)
29 Placer County Flood Control and Water Conservation District Small Watershed Peak Flow Worksheet Date: 11/20/2011 Engineer: Tieslau Project: TVRA2B Watershed: Area 2 PROPOSED Area, acres 0.91 Elevation, ft 6235 Return Period 100 Length, ft Slope (V/H) Mannings n Response Time, min Overland Flow Collector Flow Collector Side Slope (ft hor/foot vert) = Total Response Time, min 5.54 Unit peak flow (cfs/acre) Figure 3A/3B/3C 2.10 See Infiltration Rate (inches/hr) 0.11 Infiltration Factor (cfs/acre) Percent Impervious 90.1 Watershed Peak Flow cfs Area x Unit Peak Flow - ((100 -% impervious) x Area x Infiltration factor)
30 Placer County Flood Control and Water Conservation District Small Watershed Peak Flow Worksheet Date: 11/20/2011 Engineer: Tieslau Project: TVRA2B Watershed: Area 3 PROPOSED Area, acres 1.68 Elevation, ft 6235 Return Period 10 Length, ft Slope (V/H) Mannings n Response Time, min Overland Flow Collector Flow Collector Side Slope (ft hor/foot vert) = Total Response Time, min Unit peak flow (cfs/acre) Figure 3A/3B/3C 0.75 See Infiltration Rate (inches/hr) 0.11 Infiltration Factor (cfs/acre) Percent Impervious 92.3 Watershed Peak Flow cfs Area x Unit Peak Flow - ((100 -% impervious) x Area x Infiltration factor)
31 Placer County Flood Control and Water Conservation District Small Watershed Peak Flow Worksheet Date: 11/20/2011 Engineer: Tieslau Project: TVRA2B Watershed: Area 3 PROPOSED Area, acres 1.68 Elevation, ft 6235 Return Period 100 Length, ft Slope (V/H) Mannings n Response Time, min Overland Flow Collector Flow Collector Side Slope (ft hor/foot vert) = Total Response Time, min Unit peak flow (cfs/acre) Figure 3A/3B/3C 1.20 See Infiltration Rate (inches/hr) 0.11 Infiltration Factor (cfs/acre) Percent Impervious 92.3 Watershed Peak Flow cfs Area x Unit Peak Flow - ((100 -% impervious) x Area x Infiltration factor)
32 FIGURES 5-3A, 5-3C 13
33
34
35 HYDROGRAPHS 14

36
37

38