Final Wastewater Collection Facilities Management Plan Report
|
|
|
- Silas Greene
- 5 years ago
- Views:
Transcription
1 Final Wastewater Collection Facilities Management Plan Report This project was partially funded by Community Development Block Grants No.06-STBG-2590 and 06-EDBG-2608 Prepared for 416 N. Franklin Street Fort Bragg, CA Prepared by AECOM 2335 American River Drive, Suite 100 Sacramento, CA 95825
2

3 Final Wastewater Collection Facilities Management Plan Report This project was partially funded by: Community Development Block Grants No.06-STBG-2590 and 06-EDBG-2608 Prepared for: 416 N. Franklin Street Fort Bragg, CA Prepared by: AECOM 2335 American River Drive, Suite 100 Sacramento, CA AECOM Project No
4 EXECUTIVE SUMMARY... i SECTION 1 - BACKGROUND Introduction Scope of Study Previous Studies and Reports SECTION 2 - EXISTING FACILITIES Existing Wastewater System Existing Storm Sewer System Field Observations SECTION 3 - HYDRAULIC ANALYSIS Assumptions Hydraulic Modeling Computer Simulation Flow Metering Precipitation Existing Capacity Analysis Hydraulic Bottlenecks Conclusions SECTION 4 - RECOMMENDATIONS Near-Term Recommendations Long-Term Recommendations Opinion of Probable Cost Funding Assistance List of Figures Figure ES-1. Collection System Model and Identified Hydraulic Bottlenecks.... iv Figure 2-1. Interior of Unmarked Storm Drain Inlet in Corry Street Figure 2 2. Downspout Draining to a Nearby Drop Inlet Figure 3-1. Hydraulic Model Figure 3-2. Metered Rate of Flow, January 20, 2009 to February 9, Figure 3-3. Averaged Diurnal Flow for a Single EDU Figure 3-4. February 5, 2009 Flow Rate Comparisons Figure 3-5. Metered Rate of Flow From February 23, 2009 to April 23, Figure 3-6. Flow and Rainfall Summary at Wastewater Treatment Plant Figure 3-7. Yearly Average Precipitation at the Figure 3-8. System Bottlenecks Resulting from Hydraulic Modeling Figure 3-9. Hydraulic Profiles Under Existing Pipe Conditions During 1.4 Inches Storm Figure Hydraulic Profiles Under Proposed Pipe Conditions During 1.4-inches Storm List of Tables Table ES-1. Potential Funding Assistance Programs for Recommended Collection System Programs.viii Table 3-1. Rainfall Frequency and Duration for the Table 3-2. Potential Improvements to Bottleneck Areas Table 4-1. Unit Cost Metrics for Near-Term Improvements Table 4-2. Budgetary OPC for Near-Term Improvements Table 4-3. Potential Funding Assistance Programs
5 EXECUTIVE SUMMARY The Wastewater Collection Facilities Management Plan provides a comprehensive analysis of the collection system and recommends a programmatic approach for mitigating inflow and infiltration (I&I) through a hydraulic modeling study funded by the Community Development Block Grant (Nos. 06-STBG and 06-EDBG-2608). This executive summary summarizes the work AECOM completed and is comprised of the following sections: Background, Scope of Study, Evaluation, Conclusions, and Recommendations. Background The Fort Bragg Municipal Improvement District (District) was formed in 1969, and serves approximately 3,000 dwelling units in a service area that includes the (City) plus unincorporated areas to the north and to the south of the City. During wet weather, particularly when the ground water level is high, the District s wastewater treatment plant (WWTP) experiences significantly higher flows than during dry weather. These peak wet weather flows are greater than typical system average dry weather flows suggesting strong I&I influences. The District s wastewater collection system was formerly a combined sewer system, transporting both stormwater and domestic wastewater to the WWTP. In 1977, the District completed a project to separate the sewers. The District has determined that high rates of I&I exist and that cross connections between the wastewater collection system and the stormwater system still remain. This is typical for systems that have been converted from combined to separated systems as it is extremely difficult to disconnect all sources of direct stormwater inflow. In 1999, the District initiated a smoke testing program, which identified significant inflow challenges to the system, including 227 defects. The defects included, but were not limited to, storm catch basins directly connected to the sanitary sewers, broken sewers or defective lateral connections under sidewalks and in yards, and defective plumbing inside homes. Since then, the District completed repairs on defects on public property and has contacted property owners regarding repair of defects on private property. Scope of Study Analysis of the collection system utilized an array of tools to evaluate and identify hydraulic limitations in the collection system. In accordance with our scope of work, AECOM completed the following activities during this study: Review system records and previous reports. AECOM obtained and reviewed plant effluent flow data, the 2007 Wastewater Treatment Facility Study and the Infiltration/Inflow Analysis of the 1999 Smoke Testing Program. Conduct field reconnaissance. AECOM staff conducted a limited reconnaissance of the system in December 2008, and identified potential direct inflow connections into the wastewater system. Interview District staff. AECOM conducted meetings and telephone interviews with District personnel. Review I&I impacts. AECOM s initial review of past information suggests hydraulic bottlenecks in the system limit conveyance of domestic wastewater flows and I&I from large storm events. This condition causes the system to surcharge and in extreme cases causes the hydraulic grade line to rise above street level, resulting in sanitary sewer overflows (SSOs). i 0
6 Deploy flow monitoring. One portable flow meter was utilized for calibration and testing of the hydraulic model. District personnel installed the meter at City Manhole No. 53 and recorded flows during the period January 20, 2009 to February 9, District staff then relocated the flow meter to City Manhole No. 69 and recorded flows during the period February 23, 2009 to April 3, The flow data was analyzed and utilized in conjunction with the City s WWTP flow meter to calibrate and validate the hydraulic model. Complete hydraulic analysis. A computer model of the collection system was constructed and analyzed using USEPA Storm Water Management Model (SWMM) version 5. The data required to model the collection system includes the geometry, length, invert, and material of pipes and rim and invert elevations of the manholes. These were obtained from City system maps and related data. At locations where the manhole information was not available, the invert elevations were calculated using the slope of the upstream or downstream pipe. The manhole rim elevations were developed using a digital terrain map. Develop CAD system maps. AutoCAD maps provided by the District were used to evaluate the collection system, build the hydraulic model, and communicate findings. Prepare Phase I project report. AECOM completed a Phase I report with preliminary study information. Prepare final development improvement plan report. AECOM completed the final report, which recommended a phased approach to identifying capital improvement projects and removing a sufficient volume of I&I so that the collection and treatment systems can operate within their respective design criteria. Evaluation Preliminary evaluation of the system was summarized in AECOM s Phase I report. Generally, this work included observations from the field and provided information from the hydraulic modeling analysis, such as an assessment of the existing capacity. Field Observation During a brief field reconnaissance of the system in December 2008, several potential direct inflow connections into the sewer system were documented and the following observations made: Roof leaders and downspout connections that are likely directed to the sanitary sewer system were identified at various locations throughout the City. These are common sources of inflow in other communities. Older homes east of downtown do not have roof gutters. It is assumed roof runoff from these homes do not drain directly into the sanitary system; however the runoff may infiltrate into the ground and enter the system through footing drains or defects in lateral connections. This is a common source of rainfall-dependant infiltration in other communities. Many businesses and homes were constructed prior to the 1977 separation project. At least some of these older properties almost certainly still have footing drains connected to the now-separated sewer system. Some of these will have roof drains, basement drains, or area drains connected as well. Newer homes south of downtown generally have roof drains, many of which drain onto their yards. Where storm drainage systems were not constructed, it is likely that roof runoff infiltrates into the sanitary system via footing drains, if they are connected. ii 0
7 Hydraulic Modeling Due to the limited calibration data available, hydraulic modeling of the collection system was limited to identifying the existing system capacity and location of hydraulic bottlenecks. Once constructed, the model is calibrated and validated using actual data (e.g. flow rate and water level) to confirm proper correlation between the model and the system. Unfortunately, budgetary constraints limited the ability to acquire actual data to two sources: (1) the flow meter at the City s WWTP and (2) a portable flow meter. As a result, the hydraulic model was calibrated using limited data, requiring model parameters be applied uniformly across the entire collection system. A systematic field investigation of the existing collection lines and pressure mains was unable to be completed; therefore specific defects could not be identified nor could hydraulic improvements to the system be accurately sized. Existing Capacity Analysis Analysis of the existing collection system capacity generally indicates adequate capacity throughout most of the collection system to convey dry weather flows to the WWTP. However, some locations within the gravity sewer network are flowing near capacity even during dry weather, which in turn limits the conveyance system of available capacity when flows increase due to wet weather I&I. Dry weather flow was added to the hydraulic model at 30 locations and was based upon a scalar multiple of the average daily dry weather flow for a single equivalent dwelling unit (EDU). Flow meter data recorded from the period of January 20, 2009 through February 9, 2009 were used to develop 10-minute interval diurnal pattern over a 24-hour period. For the purpose of generating wet weather for input into the hydraulic model, 18 dummy subcatchments were created, each with an area of 0.4 acres. To calibrate the model, the properties of all the subcatchments were kept the same and the area was adjusted until the system wide flows matched the effluent flows at the WWTP. The model was simulated using a 1.4-inch storm event which occurred on February 5, The simulation results were used to identify the locations where bottlenecks exist, potentially leading to surcharge conditions and in turn, SSOs. To identify these locations, the simulation results were evaluated using the model s profile viewer. Surcharge locations can be found by observing the location of surcharged manholes, which in turn point toward pipes that have inadequate capacity. Sewers constructed with a steep pipe gradient have higher capacity that those constructed on a shallow gradient. It is common to find sewers constructed with gradual slopes cause surcharging, where steeper pipes just upstream have adequate capacity. Collection system modeling identified four areas where hydraulic bottlenecks are likely to be experienced resulting in increased risk to overflow events due to local flow generation, topography, and collection system hydraulics. These areas are shown in Figure ES-1 and are described as: Area 1 E. Bush Street, between Brandon Street and McPherson Street, Main Street between Fir Street and Alder Street. Area 2 Laurel Street between Corry Street and Alger Street; Pine Street between Corry Street and McPherson Street. Area 4 Chestnut Street between Franklin Street and S. Harold Street. Area 5 Alder Street between Lincoln Street and McPherson Street. iii 0
8 AREA 1 AREA 2 AREA 5 AREA 4 Conclusions Figure ES- 1. Collection System Model and Identified Hydraulic Bottlenecks. As a result of this study, AECOM generally concludes the following: The District s past smoke testing and plant record data can be used, along with additional monitoring data to further define the extent and location of extraneous water entering the collection system. I&I elimination efforts conducted by the District in recent years have tended to focus on slip lining mainlines. This technique is appropriate, given the extensive use of vitrified clay pipe in the system and its tendency to allow root incursion, become crushed, and experience joint failure. Pipe bursting is another technique that is very effective for systems that are predominantly comprised of vitrified clay pipe. Hydraulic modeling results on system bottlenecks correlate well with both field information on challenged areas as well as information obtained from earlier smoke testing. iv 0
9 System improvements to the five areas of likely hydraulic bottleneck can provide near-term relief to SSO risk. Recommended improvements are provided in the following section. Recommendations This evaluation integrated information from past studies with current hydraulic modeling analysis to characterize the collection system response during dry and wet weather periods in order to develop an effective I&I mitigation program. Due to limitations in the flow monitoring data, general assumptions to the collection system properties limited the model s ability to isolate the flow response behavior of specific areas within the collection system. As a result, additional effort and information are suggested to enable more precise identification of I&I occurrences into the collection system. As in most systems, there is no individual solution that can be implemented to eliminate the surcharging, SSOs, and heavy loading at the WWTP due to I&I. Ultimately, reduction and control of I&I in the City collection system is beneficial to consider through a systematic monitoring and maintenance program. As such, AECOM recommends undertaking a phased approach that utilizes a mix of activities in order to eliminate SSOs, and minimize impacts at the plant. These recommendations are divided into near-term and long-term recommendations described below. Near-Term Recommendations Near-term recommendations are suggested for immediate consideration based on the individual costs and benefits of implementation. For this work, we generally assumed the implementation horizon to be on the order of 1- to 5-years. Near-term recommendations include: Construct improvements to relieve hydraulic bottlenecks. Four areas within the collection system were recognized to limit hydraulic capacity. Enhancing hydraulic capacity) at these sections to relieve the hydraulic limitations can therefore result in reduced surcharge and SSO risk during high flow events. In general, hydraulic relief can be provided by increasing pipe size, adding auxiliary (i.e. parallel) pipes, slip lining to reduce frictional losses, and adding in-line storage. Specific considerations for improvement to the four sections are summarized below and are based on hydraulic model analysis and cost-benefit review of alternative improvements: Area 1 Add auxiliary or relief pipe on Winfred Street; Area 2 Retrofit existing pipe to increase the existing pipe diameter; Area 4 Add auxiliary or relief pipe on Maple Street; and Area 5 Retrofit existing pipe to increase the existing pipe diameter. Hydraulic relief should be considered carefully from two standpoints. First, the hydraulic bottlenecks identified as part of this study may not be a problem if the upstream I/I is controlled. Therefore, hydraulic relief should be considered subsequent to the repair of defects identified in the smoke testing program of Secondly, analyses must be conducted to ensure that hydraulic relief implemented at one location does not exacerbate or cause problems at downstream locations or to the treatment processes at the WWTP. Identify high-risk pipe materials for inspection. Vitrified clay pipe (VCP) and corrugated metal pipes (CMPs) pose a higher risk of failure. Specifically, VCP has a high incidence of joint failure and CMP has reduced service life. Therefore, it is recommended that components of the collection system where these pipe materials are installed are to be identified and prioritized for closer inspection and or rehabilitation given their increased risk for I&I. Revisit previously identified sources of direct I&I for maintenance/rehabilitation. 81 defects were identified as being the City s responsibility during smoke tests conducted in The District should confirm which defect(s) have been repaired, and then repair the remaining defects that have v 0
10 potential to convey substantial inflow into the system with a focus on inflow sources. This will help to provide extra capacity during storm events. Conduct a comprehensive evaluation of potential storm water cross-connection. I&I occurrence is closely linked to areas with a storm water system. Where the storm water system overlaps to the sewer system network, there is an increased risk of incomplete separation and therefore I&I. Conversely, areas where there is sewer system piping and no storm water piping also suggests extraneous flow from gutters and drains could be entering the sewer system. A systematic review of the storm and sewer system would identify areas with higher risk of I&I. Conduct an extended flow monitoring study. The flow monitoring study should divide the collection system into drainage basins, incorporating the use of 8-12 flow meters, each installed to record wastewater flows at its outlet. The flow meters would operate remotely. Rainfall data will also need to be recorded. The length of the study may be limited by available funding, but should last a minimum of six to eight weeks. The study should take place during the time year when the largest storm events occur; however it should be of sufficient duration to measure wastewater flows during both dry weather and wet weather periods. If significant rain events are not adequately captured during the study, the period of study should be extended. Data from the flow study will be used to rank all basins relative to each other in terms of criteria such as I&I volume and peak to average flow ratio. This ranking will be used to identify and prioritize areas within the system. Basins should be ranked in order of highest to lowest I&I contribution and grouped into Priority 1, 3, and 3 according to the criteria listed above, with Priority 1 basins having contributed the largest I&I flows into the system. The sanitary sewer evaluation study (SSES) program described below should focus on the Priority 1 and 2 basins. Implement a comprehensive SSES program. The SSES program would be designed to focus on areas within the collection system where there are known or suspected defects and is intended to identify specific defects that should be repaired (rather than the entire collection system). Repairs should be selected that would either reduce I&I entering the system or remove defects, such as crushed pipes and intruding roots. The SSES program could be divided into two phases if desired: Phase I SSES. Conduct the field studies described below where known or suspected defects are located, based on previous studies and knowledge of the system. Phase I work would also target pipes located downstream of surcharged manholes and identify the location of all VCP and CMP installed in the system for targeted SSES work. Phase II SSES. Conduct the field studies described below in basins that were identified during flow monitoring as high priority basins and that were not studied in Phase I of the SSES work. Areas that were not shown to contribute high I&I during the flow monitoring study do not need to be included in the SSES program. The SSES program would include the following elements: a. Within the high priority areas, conduct smoke testing at locations both in areas that were previously tested more than five years ago and in areas that were not previously smoke tested. This will provide information to identify new defects and will help identify the effectiveness of previous repairs. b. Review exist video data recorded less than 10 years ago. Record closed-circuit television (CCTV) data as required to completely inspect priority basins. c. Conduct video inspection of lateral connections to the sewer system from private residences and business. d. Dye water testing as necessary to identify storm water intrusion. vi 0
11 Long-Term Recommendations Long-term recommendations are suggested for phased consideration based on information developed in the initial near-term efforts. For this work, we generally assumed the implementation horizon to be on the order of 4- to 10-years. Long-term recommendations include: Implement repairs to defects found during the SSES. Conduct comprehensive collection system and storm water system plans. A Storm Water System Plan and an updated Comprehensive Collection System Plan would be simultaneously prepared to study the affect of the presence or absence of the drainage system on the wastewater collection system. Hydraulic models would be prepared to study hydraulic conditions within each system. Data gathered during an extended flow monitoring program could be used to calibrate the sewer system model, if less than two years lapse between the two studies. Defects or improvements to each system would be identified and recommendations made for capital improvements. Evaluate the potential use of in-line or off-line storage and increased WWTP capacity. Temporary storage of combined wastewater and extraneous water passing through the collection system into either in-line or off-line storage facilities has been successfully used in other cities across North America. USEPA studies have shown that the cost per gallon of I&I removed tends to increase as more I&I is removed from collection systems. At some point, it may be cost effective to consider storage. The strategy includes the temporary storage of wet weather flows in either in-line or off-line storage facilities, which is subsequently reintroduced into conveyance facilities at a location upstream in the system or directly into the treatment train at the plant. Funding Assistance Potential funding assistance opportunities include grants and low-interest loans from State and Federal agencies. Likely programs are summarized in Table ES-1. vii 0
12 Table ES-1. Potential Funding Assistance Programs for Recommended Collection System Programs. Type Program/Department Purpose and Eligible Uses Limits/Conditions Grant Grant Grant Grant Loan Community Development Block Grant (CDBG)/State Dept of Housing and Community Development Water and Waste Disposal/USDA Rural Development Small Community Wastewater Grant Program/SWRCB Water Recycling Facilities Planning Grant Program/SWRCB Infrastructure State Revolving Fund (SRF)/I-Bank Grants to Cities for sewer system improvements applicable for studies, design, and construction to benefit low-income persons/households. Grants to Cities for treatment, collection, storm drainage improvements applicable for studies, design, and construction. Grants to small disadvantaged communities (<20,000 population, <$37,995 MHI) for collection, treatment and disposal facilities and mitigation measures. Grant for facility planning and/or feasibility study for use of treated municipal wastewater to offset freshwater supply. Municipal loan to construct and/or repair collection system and treatment facilities. Loan Clean Water SRF/SWRCB Municipal loan to construct and/or repair collection system and treatment facilities. Loan Water and Waste Disposal/USDA Rural Development Municipal loan for treatment, collection, storm drainage improvements applicable for studies, design, and construction. $500,000 (typ) $3-5M (avg) $2M per project 50% of eligible cost, up to $75K $10M max per project 20 yrs as of $25M per agency per yr 30 yrs as of May yrs as of viii 0
13 SECTION 1 - BACKGROUND 1.01 Introduction The Fort Bragg Municipal Improvement District (District) was formed in 1969 and serves approximately 3,000 dwelling units in a service area that includes all of the (City) plus unincorporated areas to the north and to the south of the City for a total population of approximately 7,000. During wet weather, particularly when the ground water level is high, the District s wastewater treatment plant (WWTP) receives significantly higher flows than during dry weather. The high volume of wet weather flow indicates that Infiltration and Inflow (I&I) is entering the collection system. The highest peak flows to the plant are observed after periods of prolonged rainfall when groundwater is high. This suggests that groundwater infiltrating into defects in the system and storm water flowing directly into the system combine to generate the highest wastewater flows being conveyed to the plant. The District s wastewater collection system was formerly operated as a combined sewer system, transporting both storm water and domestic wastewater to the WWTP. In 1977 the District completed a project to separate the sewers. The District has determined that high rates of I&I continue to exist and that cross connections between the wastewater collection system and the storm water system still remain. This is typical for systems that have been converted from combined to separated systems, as it is extremely difficult to disconnect all sources of direct storm water inflow. In 1999 the District initiated a smoke testing program, which identified some significant inflow challenges to the system, including 227 defects. The defects included, but were not limited to, storm catch basins directly connected to the sanitary sewers, broken sewers under sidewalks and in yards and defective plumbing inside homes. Since then, the District has continued to implement repairs to defects located on public property and has encouraged property owners to repair defects on private property. In 2005 the District conducted additional smoke and dye testing and videotaped main lines. Defects were ranked and prioritized on a scale between one and five, with one being the highest priority. As of April 2008 it was reported that repairs to priority one and two defects had been conducted. The District desires to take action which would continue to reduce inflow and infiltration rates. The District also desires to determine the hydraulic capacity of the existing collection system and understand its ability to convey future wastewater flows. This report describes the nature and extent of rainfall-dependant inflow and infiltration into the existing collection system, defines the conveyance capacity of the existing collection system, and identifies hydraulic bottlenecks in the system that limits conveyance capacity Scope of Study Analysis of the collection system utilized an array of tools to evaluate and identify hydraulic limitations in the collection system. In accordance with our scope of work, AECOM completed the following activities during this study: Review system records and previous reports. AECOM obtained and reviewed plant effluent flow data, the 2007 Wastewater Treatment Facility Study and the Infiltration/Inflow Analysis of the 1999 Smoke Testing Program. Conduct field reconnaissance. AECOM staff conducted a limited reconnaissance of the system in December 2008, and identified potential direct inflow connections into the wastewater system. Interview District staff. AECOM conducted meetings and telephone interviews with District personnel. Review I&I impacts. AECOM s initial review of past information suggests hydraulic bottlenecks in the system limit conveyance of domestic wastewater flows and I&I from large storm events. This condition causes the system to surcharge and in extreme cases causes the hydraulic grade line to rise above street level, resulting in an overflow. 1-1
14 Deploy flow monitoring. One portable flow meter was utilized for calibration and testing of the hydraulic model. District personnel installed the meter at City Manhole No. 53 and recorded flows during the period January 20, 2009 to February 9, District staff then relocated the flow meter to City Manhole No. 69 and recorded flows during the period February 23, 2009 to April 3, The flow data was analyzed and utilized in conjunction with the City s WWTP flow meter to calibrate and validate the hydraulic model. Complete hydraulic analysis. A computer model of the collection system was constructed and analyzed using USEPA Storm Water Management Model (SWMM) version 5. The data required to model the collection system includes the pipe sizes, lengths, invert and rim elevations of the manholes, which were obtained from City system maps and related data. At locations where the manhole information was not available, the invert elevations were calculated using the slope of the upstream or downstream pipe. The manhole rim elevations were developed using a digital terrain map. Develop CAD system maps. AutoCAD maps provided by the District were used to evaluate the collection system, build the hydraulic model, and communicate findings. Prepare Phase I project report. AECOM completed a Phase I report with preliminary study information. Prepare final development improvement plan report. AECOM completed the final report, which recommended a phased approach to identifying capital improvement projects and removing a sufficient volume of I&I so that the collection and treatment systems can operate within their respective design criteria Previous Studies and Reports Several reports were reviewed as part of the initial study phase. Two reports prepared by Nute Engineering provided project background and engineering opinions regarding issues with the wastewater collection system and the wastewater treatment plant Infiltration/Inflow Analysis of 1999 Smoke Testing Program Nute Engineering s reports, Infiltration/Inflow Analysis of 1999 Smoke Testing Program, submitted to the City in a letter dated February 29, 2000 noted a total of 227 defects. The defects included but were not limited to storm catch basins directly connected to the sanitary sewers, broken sewers under sidewalks and in yards, and defective plumbing inside homes, among other things. The report also noted that some manholes were observed as having high flows of clear or muddy water. The observed water was deemed to be largely comprised of rainwater or groundwater, which in turn, suggests the possibility of serious leaks into the sewer system. The report estimated system flows resulting from a 3-inch, 24-hour rainfall event. Several defect types were noted and an I&I volume was estimated for each type. The largest flows were assumed to come from storm water catch basins, each having an assumed average flow of 20,420 gpd during the event. The report indicated that 285,880 gpd enters the system from 14 storm drain catch basins. The total inflow from high-flow manholes was estimated at 490,000 gpd. The report further stated that during the smoke testing study, the defects being studied represented about 6% of the total I&I flowing into the system, and that a significant percent of that was from the 14 catch basins. Significant inflow problems were shown to exist at the time of the report Wastewater Treatment Facility Study The Wastewater Treatment Facility Study prepared by Nute Engineering, dated May 2007 recommended upgrades to the wastewater treatment plant, and addressed the need to expand the plant to meet long-term treatment requirements for the City. Noted in the report was the opinion that, based upon the current rate of new households being connected to the sewer system, the existing 1.0 MGD plant capacity would be adequate for many years before plant 1-2
15 expansion was required. Development of the former Georgia Pacific Plant site, however, could change this scenario, resulting in a much faster growth rate. The increase of rainy season wet-weather wastewater flows was discussed. This increase was assumed to be due to ground water and storm water entering the collection system. Past records indicate that peak flows of 5 MGD at the plant have occurred. The current plant capacity is 1.0 MGD for dry weather and 2.2 MGD wet weather. The 5 MGD peak flows exceed plant capacity. The report s primary goal was to define the best long-range program for upgrading the wastewater treatment plant. Five recommendations were listed that the City should undertake. Notable to I&I reduction efforts currently under way in the City, Recommendation No. 2 stated: The City should continue its efforts to reduce infiltration/inflow into the sewer system through the ongoing sewer rehabilitation program. While the report intended to present recommendations for upgrading the wastewater treatment plant, reducing I&I was deemed important enough to be listed as one of the five recommendations. 1-3

16 SECTION 2 - EXISTING FACILITIES 2.01 Existing Wastewater System The wastewater system consists of a WWTP and its outfall to the Pacific Ocean, six pump stations ranging in capacity from 62 gpm to 2,020 gpm and approximately 30 miles of gravity sewers and pressure mains. The gravity sewers, which are the subject of this study, range in size from 6-inches to 30-inches in diameter. The wastewater treatment plant is rated for 1.0 MGD dry weather flow and 2.2 MGD wet weather flow. The first sewers were constructed in the late 1800 s. A large portion of the sewer lines are older vitrified clay pipes. Vitrified clay pipe is susceptible to breaking and defective jointing leading to infiltration from groundwater and saturated trench soils Existing Storm Sewer System The City s AutoCad utility map and other City-furnished utility maps were reviewed. During field reconnaissance, AECOM staff found that some information on the maps did not correspond with field conditions. In one location along Corry Street, just south of Pine Street, a storm drain inlet with a total of three pipes was not identified on the utility maps provided by the City. Figure 2-1. Interior of Unmarked Storm Drain Inlet in Corry Street. The omission of this drain inlet on the City s utility maps may be just a single occurrence. But it may also be an indication that there are other existing storm drain inlets that have not been located and mapped Field Observations A brief field reconnaissance of the system was made by AECOM staff in December Some potential direct inflow connections into the sewer system were identified and the following observations were made: Roof leaders and downspout connections that are likely directed to the sanitary sewer system were identified at various locations throughout the City. These are common sources of inflow in other communities as well. An apartment building on Alder Street located between Whipple and Cory Streets was noted to be located where direct storm inflows to the sewer pipes occur. See Figure 2-2. It appears that roof drainage directed down a roof gutter downspout is further directed to a drop inlet. A review of the City s utility maps indicates there are no storm drains at this location, only a sanitary sewer line. The drop inlet likely connects directly into the sanitary sewer line. 2-1


17 Figure 2 2. Downspout Draining to a Nearby Drop Inlet. A property located at the southwest corner of Harrison and Bush Streets was observed which has three roof gutter downspouts connected to drain piping that continued below the ground surface. No pipes were observed in the adjacent gutters and no outlets from those drain pipes were visible. Based upon visual observation and a review of the City utility maps, no storm drains are present at that location. It is probable that roof runoff from this property is connected directly to the sanitary sewer system. Older homes east of downtown do not have roof gutters. It is assumed roof runoff from these homes do not drain directly into the sanitary system; however the runoff may infiltrate into the ground and enter the system through footing drains or defects in lateral connections. Many businesses and homes were constructed prior to the 1977 separation project. At least some of these older properties almost certainly still have footing drains connected to the now-separated sewer system. Some of these will have roof drains, basement drains, or area drains connected as well. Newer homes south of downtown generally have roof drains, many of which drain onto their yards. Where storm drainage systems were not constructed, it is likely that roof runoff infiltrates into the sanitary system via footing drains, if they are connected. 2-2
18 SECTION 3 - HYDRAULIC ANALYSIS 3.01 Assumptions The approach used in this project was to make a judgment call regarding the quantity and likely nature of the direct inflow by evaluating the results from a series of computer simulations of storm water inflows through out the sewer pipe system. The computer program used for the simulations is the USEPA Storm Water Management Model (SWMM). This program can evaluate a dynamic rainfall-runoff simulation for single event or long-term (continuous) simulation of sewage flows and storm water runoff. The comprehensive nature of the program allows simulations of systems that may include pipes, channels, storage/treatment devices, pumps, and regulators. Data typically required to model a collection pipe system include pipe geometry, material, slope, and the inverts and rim elevations of manholes. The source for this data came primarily from City furnished maps and related data. During the course of our analysis, simplifying assumptions were needed to compensate for the limited flow metering data available and range of analysis that could be completed. Assumptions made regarding pipe and manhole data included: All pipe type has been assumed to be clay pipe. While different pipe types are very likely to be in service, it is believed that most of the existing pipe is clay pipe. Where pipe size was not given, the location, area and the sizes of pipes upstream and downstream were interpolated between known data points to approximate the likely size. Where manhole invert information was unavailable two approaches were taken to approximate the needed information. Where the manhole in question was between upstream and downstream manholes having invert elevations, the manhole invert was computed based upon assuming a straight pipe grade between the upstream and downstream manholes. For all other manholes the sewer pipes upstream and downstream were evaluated to determine the invert elevation of not only the manhole in question, but also other manholes so that minimum pipe slopes and minimum manhole depths were obtained. An assumed depth of four feet was used as the minimum manhole depth. Minimum pipe slopes were based upon the slope required to cause a pipe of a particular size to flow at a minimum velocity of 2 fps when the pipe is flowing either half full or full flow. Pipe slopes were based upon the invert elevations of the manholes at the downstream and upstream manholes ends of the pipe and the length of the pipe. Manhole rim elevations were determined based upon assumed existing ground elevations. Using contour lines in the AutoCAD file provide by the City, a digital terrain model was created. The terrain model was adjusted to get the best fit city wide that correlated with those existing manholes that had listed rim elevations and depth to invert. The existing sewer collection system consists of approximately 26 miles of pipe ranging in size from 6 to 30 in diameter. To simulate the sewage flow in the collection pipe system several things were assumed, including the following: Sewage flows to the pipe system have been assumed to enter at manholes, rather than along sewer pipes at service line connections. The quantity of sewage flows entering throughout the pipe system have been assumed to be based upon a scalar multiple of the average daily dry weather sewage flow per a single equivalent dwelling unit (1 EDU). Flow data recorded by the flow meter during the period between January 20 and February 9, 2009 were evaluated. Flow rates at 10 minute intervals for a 24 hour period were computed to create the average daily dry weather flow per 1 EDU as shown in Figure 3-3. Aerial photos were used in conjunction with the City s AutoCAD file to estimate the number of equivalent dwelling units being served at a particular manhole location. The flow entering a particular manhole was then determined by multiplying that number times the1 EDU flow rate. 3-1
19 For commercial and industrial areas located throughout the City, flow estimates were made for the EDU number. Not all sewer lines were included in the model. Dead end sewer lines typically serving twenty equivalent dwelling units or less were not included. The City has six sewer lift stations ranging in pumping capacity from 62 to 2020 gpm. Four of the lift stations have capacities ranging from 189 to 272 gpm. Little additional information is available about each lift station. Sewage flows from each of the lift stations were modeled using EDU flow rates based upon the estimated equivalent dwelling units within the service area of each lift station Hydraulic Modeling Due to the limited calibration data available, hydraulic modeling of the collection system was limited to identifying the existing system capacity and location of hydraulic bottlenecks. Once constructed, the model is calibrated and validated using actual data (e.g. flow rate and water level) to confirm proper correlation between the model and the system. Unfortunately, budgetary constraints limited the ability to acquire actual data to two sources: (1) the flow meter at the City s WWTP and (2) a portable flow meter. As a result, the hydraulic model was calibrated using limited data, requiring model parameters be applied uniformly across the entire collection system. A systematic field investigation of the existing collection lines and pressure mains was unable to be completed; therefore specific defects could not be pinpointed nor could hydraulic improvements to the system be accurately sized Computer Simulation The Ft. Bragg sewer system computer model utilized the USEPA Storm Water Management Model (SWMM) version 5 software. The data required to model the collection system included pipe geometry, lengths, invert, and manhole rim and invert elevations. This data came from City furnished maps and related data. At locations where the manhole information was not available, the invert elevations were calculated using the slope of the upstream or downstream pipe. The manhole rim elevations were developed using a digital terrain map (DTM). The model extent over the entire collection system is illustrated in Figure 3-1. The blue lines indicate the hydraulic model network; the red lines denote the documented extents of the City collection system. 3-2


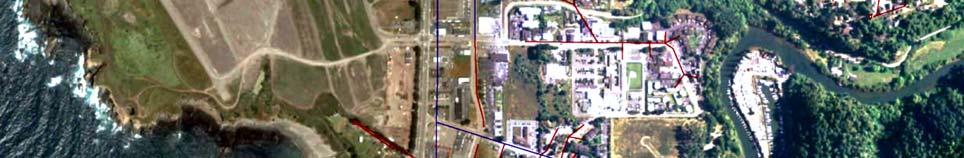

20 Figure 3-1. Hydraulic Model. The blue lines indicate the hydraulic model network; the red lines denote the documented extents of the City collection system. 3-3

21 Dry weather flow was added to the hydraulic model at 30 locations and was based upon a scalar multiple of the average daily dry weather flow for a single EDU. Flow meter data recorded from the period of January 20, 2009 through February 9, 2009 were used to develop a 10-minute interval diurnal pattern over a 24-hour period. For the purpose of generating wet weather for input into the hydraulic model, 18 dummy subcatchments were created each with an area of 0.4 acres. To calibrate the model, the properties of all the subcatchments were uniformly applied and the area was adjusted until the flows reasonably matched the effluent flow record at the WWTP Flow Metering In December 2008 a single, portable flow meter was delivered to the City so that the meter could be installed by City personnel. The flow meter recorded sewer flows to enable a limited evaluation of the effect of rainfall events at a single location. The meter was installed in manholes at two locations: manhole nos. 53 and Manhole No. 53 The first placement of the portable flow meter was in the upstream 12 sewer line at the manhole (City No. 53) located on Alder Street in the alley between Franklin Street and McPherson Street. The meter recorded sewer flows between January 20 and February 9, 2009, as shown in Figure 3-2. Following data collection and review, the meter was relocated to collect flow data at a different location. The area serviced (upstream) by the manhole was estimated at approximately 115 acres of mostly residential land use, comprised 438 EDUs. Review of the flow data indicates multiple dates without rainfall and consequent storm inflow. Given the unseasonably dry winter season preceding the first flow meter placement it was assumed that no infiltration flows were occurring during the period of metering. Using the flow rates from eight days (1/21, 1/22, 1/25, 1/28, 1/30, 1/31, 2/1 and 2/2) average dry weather flow rates over a 24 hour period were determined. The total average daily dry weather flow was estimated to be 67,864 gallons for the estimated 438 EDU; therefore for a single EDU, an average daily flow of 155 gpd was calculated for the period noted previously. Similarly, the daily flows for the eight-day period were collectively averaged together to establish an average day diurnal flow for a single EDU; this is shown in Figure 3-3. Figure 3-2. Metered Rate of Flow, January 20, 2009 to February 9, Figure 3-2 shows a peak in the flow rates starting in the evening of February 5, which corresponds with the 1.4 inches rainfall noted that day in Figure 3-6. Comparing the flow rates between the average flow 3-4
22 rates shown in Figure 3-3 with the flow rates during the day of February 5, shown in Figure 3-4, it is evident that a peak in the flow quickly subsides within four to five hours. The characteristic of this flow subsidence is indicative of direct inflow into the sewer pipe system. Figure 3-3. Averaged Diurnal Flow for a Single EDU. 3-5
23 February 6, 2009 Storm Diurnal Averaged Diurnal Flow for a 1 EDU Figure 3-4. February 5, 2009 Flow Rate Comparisons of Average Diurnal Flow and the February 6, 2009 Storm Event. 3-6

24 On February 5, 2009, rainfall induced I/I occurred from about 5pm until about 3am on February 6. During that time period the total recorded flow volume was 35,300 gallons. This represents 146% of the estimated average dry weather flow of 24,200 gallons that would have occurred over the same period in the absence of I/I Manhole No. 69 Following data collection at manhole no. 53, the flow meter was relocated to manhole no. 69, located at the end of Redwood Avenue at the alley just west of Morrow Street. Sewer flows were metered during the time period February 23 to April 3, The service area upstream of the meter was estimated to be approximately 93 acres of mostly residential land use with an estimated 273 EDU. A review of the flow data indicates considerable variation between the daily minimum and maximum flows, as seen in Figure 3-5. Daily maximum flows varied from 65 gpm up to 120 gpm; in contrast daily minimum flows varied from 15 gpm to 40 gpm. The daily rainfalls shown in Figure 3-6 indicate seven days of recorded rainfall totaling 1.4 inches for March. From the California Department of Water Resources precipitation data, the amount of total rainfall for the month of March was 6.38 inches thereby suggesting that the recorded rainfall data for the month of March in Figure 3-6 is not complete. Figure 3-5. Metered Rate of Flow From February 23, 2009 to April 23,
25 Figure 3-6. Flow and Rainfall Summary at Wastewater Treatment Plant Flow (MGD) Daily Rainfall (Inch) Rainfall Daily Flow Peak Flow 1-Jan 4-Jan 7-Jan 10-Jan 13-Jan 16-Jan 19-Jan 22-Jan 25-Jan 28-Jan 31-Jan 3-Feb 6-Feb 9-Feb 12-Feb 15-Feb 18-Feb 21-Feb 24-Feb 27-Feb 2-Mar 5-Mar 8-Mar 11-Mar 14-Mar 17-Mar 20-Mar 23-Mar 26-Mar 29-Mar
26 3.05 Precipitation The City experiences an average annual rainfall of 40-inches with most of the wet weather occurring during the November to March period, as shown in Figure 3-7. During this wet weather period, individual storm events with varying degrees of intensity and frequency can occur. These storms are categorized according to the storm s statistical frequency of [annual] occurrence, their duration, and the intensity of rainfall delivered. The National Oceanographic and Atmospheric Administration (NOAA) maintains these statistical data and information for the City s storms are summarized in Table 3-1. Figure 3-7. Yearly Average Precipitation at the 10 Inches of Rainfall Jan Feb Mar Apr May Jun Jul Aug Sep Oct Nov Dec For the purposes of this report, model parameters were adjusted to match wastewater flows measured at the WWTP during a 1.4-inch storm event that occurred on February 5, On a volumetric basis this event is equivalent to a 1-year and a 2-year frequency storm event a relatively smaller intensity storm with a greater recurrence period as compared to other storm events shown in Table 3-1. Table 3-1. Rainfall Frequency and Duration for the Precipitation Frequency (Years) Duration (Hours) Rainfall (Inches)
27 3.06 Existing Capacity Analysis Capacity analysis of the existing collection system generally indicates there is adequate capacity throughout most of the system to convey dry weather flows to the WWTP. However, some locations within the gravity sewer network are flowing near capacity even during dry weather, which in turn compromises the conveyance system of available capacity when flows increase due to I&I. Surcharging within the collection system during moderate and large storm events generally occurs as a result of hydraulic bottlenecks that exist, which restricts flow in the conveyance piping Hydraulic Bottlenecks The model was simulated using a 1.4-inch storm event which occurred on February 5, The simulation results were used to identify the locations where bottlenecks exist, potentially leading to surcharge conditions and in turn, SSO s. To identify these locations, the simulation results were evaluated using the model s profile viewer. Surcharge locations can be found by observing the location of surcharged manholes, which in turn point toward pipes that have inadequate capacity. Sewers constructed with a steep pipe gradient have higher capacity that those constructed on a shallow gradient. It is common to find sewers constructed with gradual slopes cause surcharging, where steeper pipes just upstream have adequate capacity. Collection system modeling identified four areas where hydraulic bottlenecks were found. Bottlenecks can create surcharged conditions in the conveyance piping. This condition limits the remaining available hydraulic capacity of the system and increases the risk of overflows. These areas are described below and shown in Figure 3-8. The location of evaluated hydraulic bottleneck areas include: Area 1 E. Bush Street, between Brandon Street and McPherson Street, Main Street between Fir Street and Alder Street. Area 2 Laurel Street between Corry Street and Alger Street; Pine Street between Corry Street and McPherson Street. Area 4 Chestnut Street between Franklin Street and S. Harold Street. Area 5 Alder Street between Lincoln Street and McPherson Street. Hydraulic bottlenecks have been identified based on the hydraulic model which is based on limited flow data available for calibrating the model. With increasing flows, all wastewater collection system simulations will begin to show bottlenecks. If the flow input estimates are overestimated, these bottlenecks may not be a problem. 3-10
28 AREA 1 AREA 2 AREA 5 AREA 4 Figure 3-8. System Bottlenecks Resulting from Hydraulic Modeling. 3-11

29 The Figure 3-9 below shows the profiles along the length of the sewers in four areas. It can be seen that street flooding occurs due to the inadequate capacity within the system. These longitudinal profiles are taken from the SWMM model and they represent the vertical elevation of the pipe. The vertical lines represent the manholes, from the invert of the pipe to the ground elevation. The model was simulated for a 24 hour period and this figure was taken at the peak of the storm in the system. It can be seen that the system is inadequate to handle the storm and surcharge and bottleneck conditions leads to manhole flooding in the street. Figure 3-9a. Area 1 Hydraulic Profile Under Existing Pipe Conditions During 1.4 Inches Storm. Profile is shown along E. Bush Street, between Brandon Street and McPherson Street, Main Street between Fir Street and Alder Street. 3-12


30 Figure 3-9b. Area 2 Hydraulic Profile Under Existing Pipe Conditions During 1.4 Inches Storm. Profile is shown along Laurel Street between Corry Street and Alger Street; Pine Street between Corry Street and McPherson Street. Figure 3-9c. Area 4 Hydraulic Profile Under Existing Pipe Conditions During 1.4 Inches Storm Profile is shown along Chestnut Street between Franklin Street and S. Harold Street. 3-13
31 Figure 3-9d. Area 5 Hydraulic Profile Under Existing Pipe Conditions During 1.4 Inches Storm. Profile is shown along Alder Street between Lincoln Street and McPherson Street. For the purpose of relieving these bottlenecks the pipe sizes were increased. Table 3-2 below shows the increase in pipe sizes. Table 3-2. Potential Improvements to Bottleneck Areas Manhole Pipeline Size (inch) Area Start End Street Location Existing Proposed Total Length (ft) Fir Street from McPherson Street to Main Street Cedar Street between Sanderson Way and Lincoln Street Walnut Street between Harrison Street and Harold Street Willow and Oak Street between Wall Street and Florence Street , , ,781 The model was simulated for the same storm with these increased pipe sizes and it was seen that the hydraulic bottlenecks were relieved. Figure 3-10 below shows the new profiles along the same section of the pipe in each of the five areas. 3-14


32 Manhole 5 Manhole 1 Figure 3-10a. Area 1 Hydraulic Profiles Under Proposed Pipe Conditions During 1.4-inches Storm Manhole 17 Manhole 22 Figure 3-10b. Area 2 Hydraulic Profiles Under Proposed Pipe Conditions During 1.4-inches Storm 3-15


33 Manhole 130 Manhole 138 Figure 3-10c. Area 4 Hydraulic Profiles Under Proposed Pipe Conditions During 1.4-inches Storm Manhole 66 Manhole 97 Figure 3-10d. Area 5 Hydraulic Profiles Under Proposed Pipe Conditions During 1.4-inches Storm 3-16