High resolution urban climate projections of summer heat conditions in German cities
|
|
|
- Rafe Clark
- 5 years ago
- Views:
Transcription


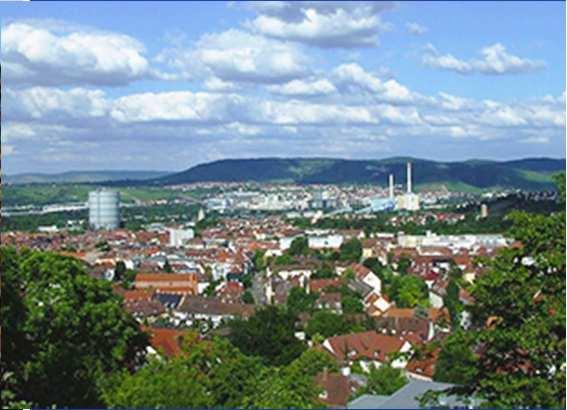


1 High resolution urban climate projections of summer heat conditions in German cities M. Kossmann, S. Buchholz, H. Noppel, P. Fuchs German Meteorological Service


2 Outline Motivation and Objectives Global and regional climate change Urbanisation and demographic change Urban climate service Urban climate projections Downscaling approach Results Adaptation and Co-Creation Concluding comments

 extrapolation 2031-2060: 29,1 days / year N GTmax 32 C")
3 Observed increase of days with strong heat load Stuttgart Observational climate station data: average : 16,5 days / year linear trend : +2,1 days / decade increase by : +12,6 days / year (6 decades) extrapolation : 29,1 days / year N GTmax 32 C (days/year) year

 Global")

4 Urban climate projections Downscaling from global to sub-urban scale Global Regional Lokal Dynamical or statistical downscaling Dynamical-statistical Downscaling MUKLIMO_3 (unresolved buildings) Global Climate Model Regional Climate Model e.g. ENSEMBLES or EURO-CORDEX Früh et al. (2011) ; doi: /2010JAMC2377.1
5 Cuboid method dynamical statistical downscaling One cuboid for each prevailing wind direction 111 (25 C, 3ms -1, 80%) T c,max, v c,max, rh c,max CONCEPT: Interpolation replacing transient simulation Only 8 high resolution simulations per wind direction 30 year climatologies for heat related climate indices at low computational cost 000 T c,min, v c,min, rh c,min (15 C, 0.7ms -1, 42%)

6 Urban climate model MUKLIMO_3 Mikroscale urban climate model, 3-dimensional Dynamics 3-D prognostic equations non-hydrostatic RANS model Physics radiation (solar and thermal) heat and moisture budgets unresolved buildings soil model, vegetation model no cloud physics / precipitation complex land use complex orography Model structure orthogonal coordinate system non equidistant model grid structure MUKILIMO_3 model description and publications:


7 MUKLIMO_3 3-dimensional microscale urban climate model


 fraction of tree cover, impervious and pervious surface")
 no subgrid")
8 Urban climate model MUKLIMO_3 Treatment of subgrid variablity in land use Grid cell with buildings Grid cell with trees Grid cell with open land Grid cell with water Low canopy vegetation Bare soil Impervious surface max. 2 building types building fraction, wall area index, building height, impervious and pervious surface fraction lai (canopy) 3 layer (canopy, steam and tree top) fraction of tree cover, impervious and pervious surface tree height, steam height, leaf area density, lai (canopy) no buildings and trees fraction of impervious and pervious surface lai (canopy) no subgrid tile approach

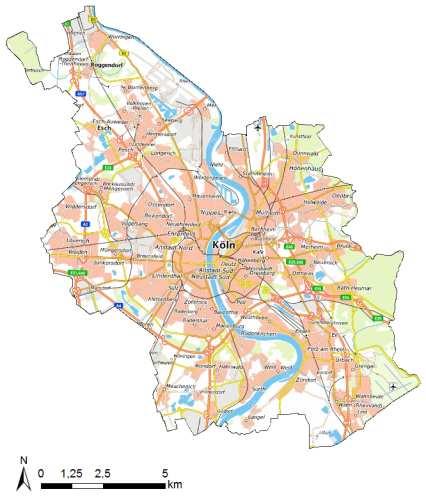


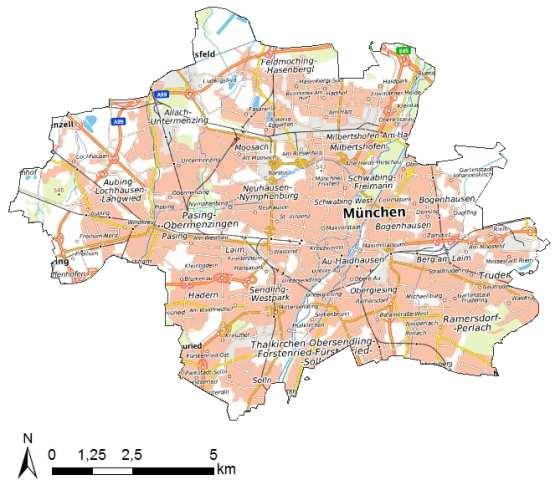


9 Urban climate projections - Germany Cologne Bundesamt für Kartographie und Geodäsie 2018 Jena Wiesbaden Offenbach Mainz Frankfurt Main Stuttgart Munich

10 Regional climate projections RCP 8.5 resolution 0.11 ; data source: Nr. global climate model regional climate model realisation RCP NCC-NorESM1-M DMI-HIRHAM5 r1i1p1 2 CNRM-CERFACS-CNRM-CM5 SMHI-RCA4 r1i1p1 3 ICHEC-EC-EARTH DMI-HIRHAM5 r3i1p1 4 ICHEC-EC-EARTH KNMI-RACMO22E r1i1p1 5 ICHEC-EC-EARTH SMHI-RCA4 r12i1p1 6 IPSL-IPSL-CM5A-MR IPSL-INERIS-WRF331F r1i1p1 7 IPSL-IPSL-CM5A-MR SMHI-RCA4 r1i1p1 8 MOHC-HadGEM2-ES KNMI-RACMO22E r1i1p1 9 MOHC-HadGEM2-ES SMHI-RCA4 r1i1p1 10 MPI-M-MPI-ESM-LR SMHI-RCA4 r1i1p1 11 CNRM-CERFACS-CNRM-CM5 CLMcom-CCLM r1i1p1 12 ICHEC-EC-EARTH CLMcom-CCLM r12i1p1 13 ICHEC-EC-EARTH KNMI-RACMO22E r12i1p1 14 MOHC-HadGEM2-ES CLMcom-CCLM r1i1p1 15 MPI-M-MPI-ESM-LR CLMcom-CCLM r1i1p1 16 MPI-M-MPI-ESM-LR MPI-CSC-REMO2009 r1i1p1 17 MPI-M-MPI-ESM-LR MPI-CSC-REMO2009 r2i1p1


11 Summer days (T max 25 C) Wiesbaden Mainz Frankfurt Main Offenbach Cologne Stuttgart Jena Munich


12 RCP 8.5, 25. percentile Summer days (T max 25 C) Wiesbaden Mainz Frankfurt Main Offenbach Cologne Stuttgart Jena Munich
 Wiesbaden Mainz")
13 RCP 8.5, 75. percentile Summer days (T max 25 C) Wiesbaden Mainz Frankfurt Main Offenbach Cologne Stuttgart Jena Munich
14 Summer days (T max 25 C) Table: spatial mean values* (RCP 8.5) City (historical) (25th perc.) (75th perc.) change (25th perc.) change (75th perc.) Wiesbaden Mainz Frankfurt a.m Offenbach Köln München Stuttgart Jena * for urban quarters located in the lowest 200m


15 Hot days (T max 30 C) Wiesbaden hot days / year 25th percentile 75th percentile RCP 8.5 Folie 15

 N GTmax 32 C Deutscher")
16 Days with strong human heat load - Stuttgart Perceived Temperature GT from Klima-Michel-Model Daily values of regional climate parameters from DWD Station Stuttgart-Echterdingen Staiger et al., 2012, International Journal of Biometeorology, 56(1) N GTmax 32 C Deutscher Kongress für Geographie, Tübingen,
17 Human heat load Perceived Temperature = f (air temperature, humidity, windspeed, mean radiation temperature, metabolic rate, clothing) (VDI Guideline 3787 / 2) Climate index: # days with strong heat load


18 Days with strong human heat load - Stuttgart , scenario A1B Daily climate parameters from 17 regional climate projections (ENSEMBLES project) 25. percentile 75. percentile N GTmax 32 C Deutscher Kongress für Geographie, Tübingen,


19 Urban climate adaptation Impact of changing land use Frankfurt/Main Planned Land Use Change Summer Days Northeast Frankfurt New green urban areas reduce and higher building density increases summertime air temperature Forest Park Single-, multifamily residential Terraced housing estate Terrace houses Tenement block residential Industry and commerce Terrace houses & high-rise buildings Days per Year climate adaptation through urban planning Freight Terminal

; doi: 10.")
20 Urban climate adaptation INKAS portal online since March 2015 extended english version April 2018 Buchholz et al. (2016); doi: /metz/2016/0731


21 Urban climate adaptation INKAS portal Increase Fraction of Green Roofs TERRACE HOUSES INDUSTRY T MAX C T MAX C % Proportion of Green Roofs

22 Urban climate adaptation INKAS portal Example: Increase Fraction of Green Roofs Conventional Roof Green Roof Reflection of solar radiation Heat transfer into the air Heat transfer into building Evaporation Fraction of Green Roofs Settlement Types A Single- and multifamily residential B Village and single family residential C Terraced housing estate D Terrace houses E Terrace houses/high-rise buildings F Tenement block residential G City later mid-19th century H Medieval city I Commercial and industrial
23 Concluding comments Urban climate projections for heat indices ( m grid) RCP 8.5: + 25 to 50 % more summer days from to Dynamical-statistical downscaling approach Research needed Multi urban climate model ensemble approach useful for IPCC? Maintenance of green infrastructure precipitation & water management Conflicts/Synergies between climate adaptation and mitigation in cities User oriented generation of climate information requested Co-Creation of climate data and guidelines for adaptation in cities Free and easily accessible climate services for all cities


24 Deutscher Wetterdienst Thank you very much for your attention. Dr. Meinolf Kossmann


25 RCP 8.5, 25. percentile Change summer days minus Wiesbaden Mainz Frankfurt Main Offenbach Cologne Stuttgart Jena Munich


26 RCP 8.5, 75. percentile Change summer days minus Wiesbaden Mainz Frankfurt Main Offenbach Cologne Stuttgart Jena Munich