Valutazione integrata della popolazione esposta all inquinamento atmosferico in Emilia-Romagna
|
|
|
- Cornelia Barker
- 5 years ago
- Views:
Transcription
1 Valutazione integrata della popolazione esposta all inquinamento atmosferico in Emilia-Romagna Giovanni Bonafè, M.Stortini, E.Minguzzi, M.Deserti, S.Maccaferri, A.Morgillo ARPA Emilia-Romagna, Servizio IdroMeteoClima Ecomondo, 9 Nov 2012
2 INTRODUCTION modelling system CTM UNBIASING+DOWNSCALING method AQ assessment population exposure cross-validation uncertainties SUBGRID-SCALE VARIABILITY method population exposure REFERENCES
3 INTRODUCTION In order to integrate CTM outputs with measured data, a post-processing downscaling and unbiasing procedure has been implemented: the procedure is based on a kriging algorithm with external variables, and it provides long-term evaluation of PM10, PM2.5, ozone and nitrogen dioxide at 1 km horizontal resolution. A similar downscaling and unbiasing procedure was also applied to operational air quality forecast. Moreover, a statistical method was implemented to estimate the subgrid scale variability of pollutants concentrations, based on some deterministic simulations run over selected sample areas and on the data collected by monitoring stations of diverse typologies. The method was tested over the Emilia Romagna region, and applied to estimate population exposure to nitrogen dioxide.
4 INTRODUCTION In order to integrate CTM outputs with measured data, a post-processing downscaling and unbiasing procedure has been implemented: the procedure is based on a kriging algorithm with external variables, and it provides long-term evaluation of PM10, PM2.5, ozone and nitrogen dioxide at 1 km horizontal resolution. A similar downscaling and unbiasing procedure was also applied to operational air quality forecast. Moreover, a statistical method was implemented to estimate the subgrid scale variability of pollutants concentrations, based on some deterministic simulations run over selected sample areas and on the data collected by monitoring stations of diverse typologies. The method was tested over the Emilia Romagna region, and applied to estimate population exposure to nitrogen dioxide.
5 INTRODUCTION In order to integrate CTM outputs with measured data, a post-processing downscaling and unbiasing procedure has been implemented: the procedure is based on a kriging algorithm with external variables, and it provides long-term evaluation of PM10, PM2.5, ozone and nitrogen dioxide at 1 km horizontal resolution. A similar downscaling and unbiasing procedure was also applied to operational air quality forecast. Moreover, a statistical method was implemented to estimate the subgrid scale variability of pollutants concentrations, based on some deterministic simulations run over selected sample areas and on the data collected by monitoring stations of diverse typologies. The method was tested over the Emilia Romagna region, and applied to estimate population exposure to nitrogen dioxide.
6 ARPA AQ MODELLING SYSTEM domain operational input verification/calibration input two way interaction alternative input domain meteo.obs meteorological models AQ obs. chemistry transport models emission inventories and tools world Europe Italy Northern Italy Emilia Romagna local domain global surface networks SRNWP network radiosoundings satellites local surface networks SEBASTIAN soil stn. lidar GME IFS COSMO I7/LAMA CALMET SIMC DIAGMET CACHI mass consistent pre processors supersites kerbside stations urban bkgd.stn. satellite rural bkgd.stn. GO CART PREV AIR NINFA PESCO UltraPESCO geostatistical modules ADMS Urban LAPMOD local scale dispersion models global inventories European inventories EFESTO regional/national inventories INEMAR CREER local inventories Italy Europe world Northern Italy Emilia Romagna local domain
 and the geostatistical module")
7 DOMAINS Figure: Domains of the continental CTM (Prev Air), the regional CTM (NINFA) and the geostatistical module (PESCO)
8 NINFA: CHEMISTRY-TRANSPORT MODEL The implementation of the CTM is called NINFA: chemistry transport model Chimere (Bessagnet et al., 2004), implemented over the Northern Italy (horizontal resolution 5km); runs operationally at ARPA-SIMC; daily analysis and forecast of PM10, PM2.5, ozone, nitrogen dioxide and other pollutants. meteorological input is provided by COSMO-I7, operational implementation over Italy of the non-hydrostatic meteorological model COSMO (Steppeler et al., 2003); some post-processing of the COSMO output is performed, in order to provide mixing height, friction velocity and cloud water content; emission input comes from the regional inventory of Emilia Romagna, from the national inventory of ISPRA and from a large scale inventory provided by project MACC; boundary conditions are provided by PREV AIR, the continental implementation of Chimere.
9 NINFA: CHEMISTRY-TRANSPORT MODEL The implementation of the CTM is called NINFA: chemistry transport model Chimere (Bessagnet et al., 2004), implemented over the Northern Italy (horizontal resolution 5km); runs operationally at ARPA-SIMC; daily analysis and forecast of PM10, PM2.5, ozone, nitrogen dioxide and other pollutants. meteorological input is provided by COSMO-I7, operational implementation over Italy of the non-hydrostatic meteorological model COSMO (Steppeler et al., 2003); some post-processing of the COSMO output is performed, in order to provide mixing height, friction velocity and cloud water content; emission input comes from the regional inventory of Emilia Romagna, from the national inventory of ISPRA and from a large scale inventory provided by project MACC; boundary conditions are provided by PREV AIR, the continental implementation of Chimere.
10 NINFA: CHEMISTRY-TRANSPORT MODEL The implementation of the CTM is called NINFA: chemistry transport model Chimere (Bessagnet et al., 2004), implemented over the Northern Italy (horizontal resolution 5km); runs operationally at ARPA-SIMC; daily analysis and forecast of PM10, PM2.5, ozone, nitrogen dioxide and other pollutants. meteorological input is provided by COSMO-I7, operational implementation over Italy of the non-hydrostatic meteorological model COSMO (Steppeler et al., 2003); some post-processing of the COSMO output is performed, in order to provide mixing height, friction velocity and cloud water content; emission input comes from the regional inventory of Emilia Romagna, from the national inventory of ISPRA and from a large scale inventory provided by project MACC; boundary conditions are provided by PREV AIR, the continental implementation of Chimere.
11 NINFA: CHEMISTRY-TRANSPORT MODEL The implementation of the CTM is called NINFA: chemistry transport model Chimere (Bessagnet et al., 2004), implemented over the Northern Italy (horizontal resolution 5km); runs operationally at ARPA-SIMC; daily analysis and forecast of PM10, PM2.5, ozone, nitrogen dioxide and other pollutants. meteorological input is provided by COSMO-I7, operational implementation over Italy of the non-hydrostatic meteorological model COSMO (Steppeler et al., 2003); some post-processing of the COSMO output is performed, in order to provide mixing height, friction velocity and cloud water content; emission input comes from the regional inventory of Emilia Romagna, from the national inventory of ISPRA and from a large scale inventory provided by project MACC; boundary conditions are provided by PREV AIR, the continental implementation of Chimere.
12 PESCO FOR UNBIASING AND DOWNSCALING A geostatistical module (PESCO) is implemented, in order to post-process the output of NINFA with the aim to remove bias and increase horizontal resolution. It produces fields of PM10, PM2.5, ozone and nitrogen dioxide surface concentrations over a regular grid covering the region Emilia-Romagna with a resolution of 1km. Figure: Diagram of the NINFA+PESCO modelling system
13 PESCO FOR UNBIASING AND DOWNSCALING ANALYSIS For every timestep (every day for PM, every hour for O 3 and NO 2 ): 1. differences between CTM fields and observed concentrations are calculated; 2. these differences are then interpolated on the 1km 1km grid, by means of a kriging algorithm (Honoré and Malherbe, 2003; Cressie, 1993) assuming that they can be expressed as the sum of a linear combination of some external parameters plus a small residual term coefficients of the linear combination are fitted with minimum square method several external parameters were tested; the most useful turned out to be elevation and total annual emissions 3. the interpolated differences are added to the CTM output, to obtain the final fields.

14 PESCO FOR UNBIASING AND DOWNSCALING FORECAST The final PESCO fields (analysis) are also used to post-process operational air quality forecasts produced by NINFA system, in order to unbias and downscale surface concentration fields: 1. the ratios of PESCO final fields to NINFA analysis are evaluated for every time and then 2. averaged over the standard three-months seasons (DJF, MAM, JJA, SON); 3. these seasonally-averaged fields are then used as correction factors for daily operational forecasts.

15 AQ ASSESSMENT PM10 daily exceedances PM10 annual mean NO 2 annual mean PM2.5 annual mean


16 POPULATION EXPOSURE PM10 daily exceedances PM2.5 annual mean NO 2 annual mean
17 CROSS-VALIDATION NO 2 PM10 PM2.5 O 3 Figure: Cross-validation of the geostatistical module PESCO: monthly minimum, maximum, median, 25 th and 75 th percentile of the root mean square error, represented as box-and-whyskers plots
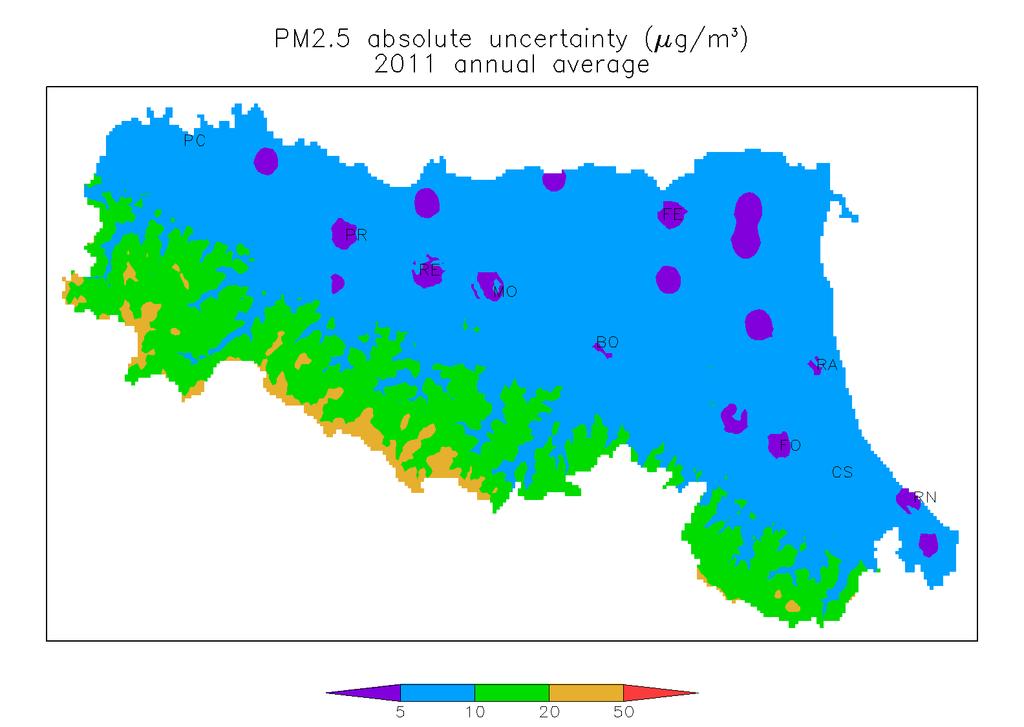
18 UNCERTAINTIES
19 EVALUATION OF SUBGRID-SCALE VARIABILITY Inside each 1km 1km cell of PESCO grid, pollutant concentration is not uniform, indeed. A simplified methodology to estimate the subgrid-scale variability of NO 2 is described and tested. 1. ADMS-Urban dispersion model (Carrhuters et al., 1994; CERC, 2006) is used to produce annual simulations of NO x concentrations, over 5 sample domains included in the PESCO domain
20 EVALUATION OF SUBGRID-SCALE VARIABILITY Inside each 1km 1km cell of PESCO grid, pollutant concentration is not uniform, indeed. A simplified methodology to estimate the subgrid-scale variability of NO 2 is described and tested. 1. ADMS-Urban dispersion model (Carrhuters et al., 1994; CERC, 2006) is used to produce annual simulations of NO x concentrations, over 5 sample domains included in the PESCO domain

21 EVALUATION OF SUBGRID-SCALE VARIABILITY Figure: NO x annual mean (colored isolines) simulated by ADMS-Urban over one of the sampling domains and NO 2 annual mean observed by the monitoring stations (black circles)
22 EVALUATION OF SUBGRID-SCALE VARIABILITY 2. after removing a buffer near the boundaries of the sample domains, a total of 248 1km 1km cells are selected for the following processing: interpolation to regularly spaced grids with 50m step comparison and correction with annual NO2 concentrations measured by the available monitoring stations included in the sample domains (10 kerbside stations) 3. the distribution frequency of corrected ADMS-Urban fields is evaluated for each of the PESCO grid cells included in ADMS-Urban domains: according to the Akaike Information Criterion (Burnham and Anderson, 2002), the log-normal distribution is found to provide the best fit in almost all of the cells
23 EVALUATION OF SUBGRID-SCALE VARIABILITY 4. the two parameters of the lognormal distibution, µ and σ, are then estimated in the entire PESCO domain: the mode of the distribution is assumed to be equal to the background concentration evaluated by PESCO for each cell a regression tree calibrated on the sample domains is used to evaluate ln(σ) as a function of quantities whose values are available on the whole domain (number of inhabitants, NO x emissions,... )

24 POPULATION EXPOSURE the distribution frequency evaluated for each 1km cell has been used to estimate the fraction of each cell in which NO 2 annual mean concentrations are expected to exceed the 40µg m 3 threshold
25 POPULATION EXPOSURE these values has been multiplied for the number of inhabitants, to obtain an estimate of the total number of people exposed to concentrations above the legislation limits results are promising: PESCO (no subgrid scale evaluation) exposed inhabitants UltraPESCO (with subgrid scale evaluation) exposed inhabitants
26 Bessagnet, B., A. Hodzic, R. Vautard, M. Beekmann, S. Cheinet, C. Honoré, C. Liousse and L. Rouil, 2004: Aerosol modeling with CHIMERE: preliminary evaluation at the continental scale. Atmos. Environ., 38, Burnham, K. P., and Anderson, D.R., 2002: Model Selection and Multimodel Inference: A Practical Information-Theoretic Approach, 2nd ed. Springer-Verlag. ISBN Carruthers, D., Holroyd, R., Hunt J., Weng, W.-S., Robins, A., Apsley, D., Thomson, D., Smith, F., 1994: UK-ADMS: a new approach to modelling dispersion in the earths atmospheric boundary layer. Journal of Wind Engineering and Industrial Aerodynamics 52, CERC, 2006 : ADMS-Urban, User Guide. Available from Cambridge Environmental Research Consultant, Cambridge, UK Cressie, N.A.C., 1993: Statistics for Spatial Data. Wiley Series in Probability and Statistics. Wiley-Interscience. Cullen A.C. and Frey H.C., 1999: Probabilistic techniques in exposure assessment. Plenum Press, USA, pp De Lauretis, R., A. Caputo, R.D. Cóndor, E. Di Cristofaro, A.Gagna, B. Gonella, F. Lena, R. Liburdi, D. Romano, E. Taurino,
27 and M. Vitullo, 2009: La disaggregazione a livello provinciale dell inventario nazionale delle emissioni. Technical Report 92, Istituto Superiore per la protezione e la Ricerca Ambientale Dosio, A., S. Galmarini, and G. Graziani, 2002: Simulation of the circulation and related photochemical ozone dispersion in the Po plains (northern Italy): comparison with the observations of a measuring campaign. Journal of Geophysical Research-Atmospheres, 107(D22), 8189 Evans M., Hastings N. and Peacock B., 2000: Statistical distributions. John Wiley and Sons Inc. Honoré, C. and L. Malherbe, 2003: Application de modèles grande échelle à la problématique régionale: cas de l ozone. Technical report, INERIS-LCSQA, December Steppeler, J., G. Doms, U. Schättler, H.W. Bitzer, A. Gassmann, U. Damrath, G. Gregoric, 2003: Meso-gamma scale forecasts using the nonhydrostatic model LM. Meteorology and Atmospheric Physics, 82, Tugnoli, S. and V. Rumberti, 2010: Inventario delle emissioni in atmosfera. Technical report, ARPA Emilia Romagna.