December 4, Hingham School Building Committee Hingham Town Hall 210 Central Street Hingham, MA 02043
|
|
|
- Gillian Marsh
- 5 years ago
- Views:
Transcription

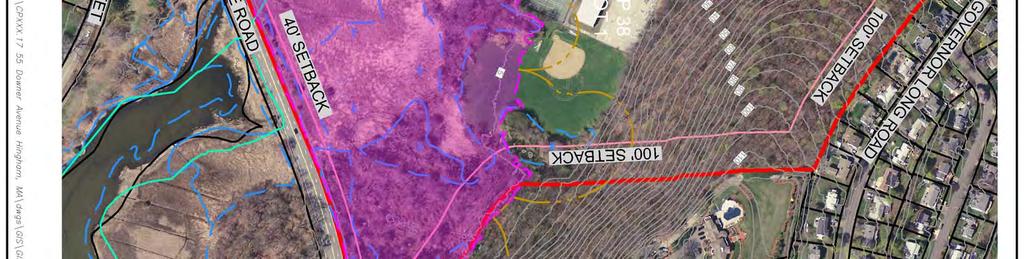
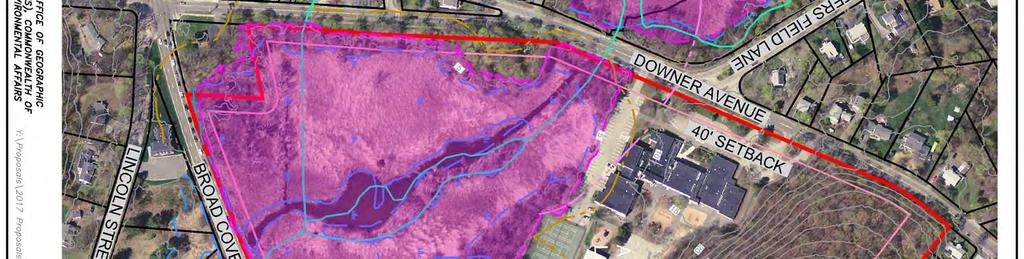
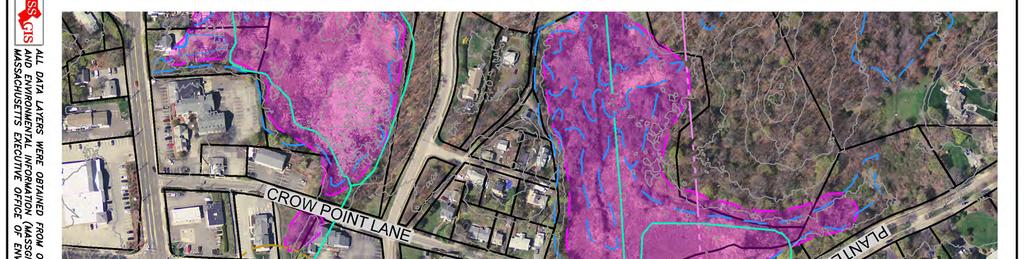
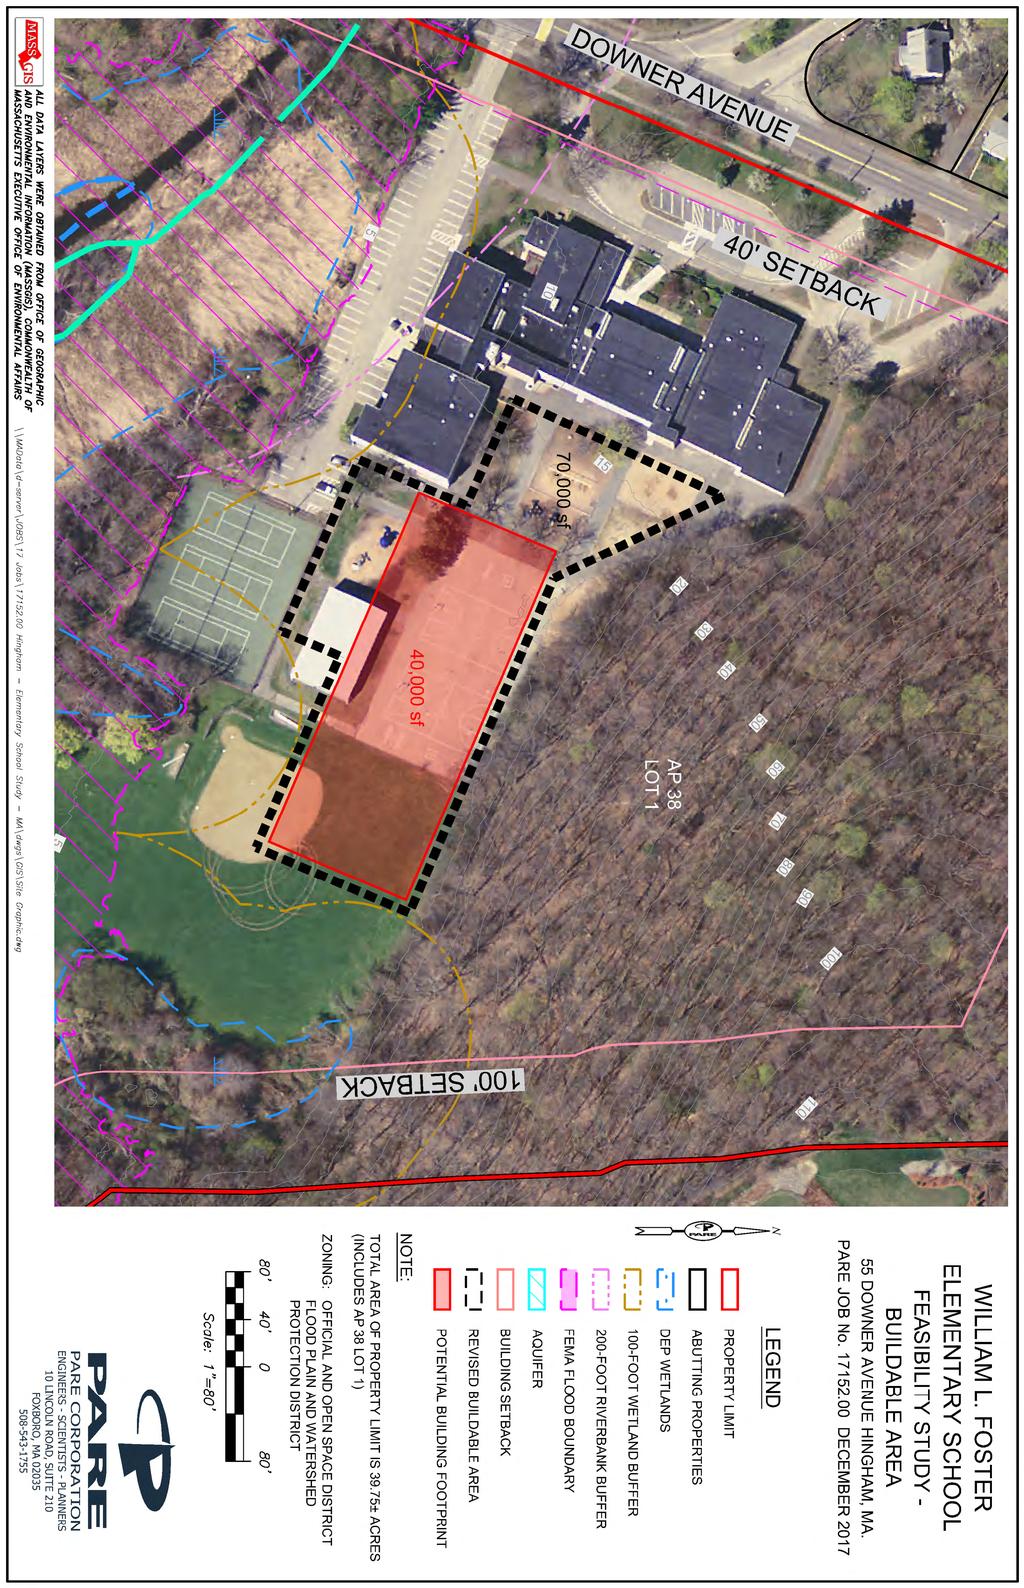
1 P a r e C O R P. C O M E n g i n e e r s S c i e n t i s t s P l a n n e r s December 4, 2017 Hingham School Building Committee Hingham Town Hall 210 Central Street Hingham, MA Re: Foster Elementary School Existing Conditions Narrative Hingham, Massachusetts (Pare Project No ) Dear School Building Committee: Pare Corporation ( Pare ) has completed its preliminary feasibility study of the Foster Elementary School site. The purpose of the study was to review existing conditions as well as pertinent codes and regulations as they relate to future development of a new public elementary school or expansion/renovation of the existing Foster Elementary School. Pare has conducted a site visit and reviewed available information. A categorized summary of findings is provided in the following narrative. General Site Information The William L Foster Elementary School ( Site ) is located at 55 Downer Avenue, Hingham, MA on 39.75± acres of land according to the Town of Hingham ( Town ) Assessors Database (Parcel ). The Elementary School consists of one building constructed prior to 1956 which currently accommodates 470± students, grades K through 5. The Site is accessible via three separate driveways off of Downer Avenue for pick up/drop off, bus rotation, and parking. The Site is furnished with a school building, athletic facilities, parking facilities, and associated structures. The Site is bounded by residential properties to the north and east; Broad Cove Road and neighboring wetlands to the south; and Downer Avenue to the west. The Site is not an inventoried historical site on the Massachusetts Cultural Resource Information System ( MACRIS ) or in the Hingham Comprehensive Community Inventory of Historic, Architectural and Archaeological Assets. Based on historic aerial imagery, the school s northern wing was renovated between 1971 and Additionally, several changes have been made to the Site s hardscape between the school s construction and present day. A site constraint map is provided in Attachment A. The map provides much of the general site information described above as well as topography, floodplain, jurisdictional wetlands, and zoning setbacks. Information shown on the constraints map was obtained from available GIS resources and the zoning requirements described in subsequent sections of this document. Zoning Regulations According to the Zoning Map Parts A and C of the Town of Hingham updated in 2013, the Site is located in the Official and Open Space District (OO). Schools and playgrounds are uses permitted by right within a zone OO according to Hingham Zoning By-law April 2016 within the III-A Schedule of Uses. The Zoning By-Law indicates that the dimensional requirements outlined below control development of the Site. 10 LINCOLN ROAD, SUITE 210 FOXBORO, MA T F BLACKSTONE VA LLEY PLAC E LINCOLN, RI T F
2 Hingham School Building Committee (2) December 4, 2017 OO Official and Open Space District: No defined square foot minimum lot area; 20 feet minimum lot frontage; 40 feet minimum front yard setback; 40 feet minimum side yard setback; 40 feet minimum rear yard setback; 35 feet maximum building height; and 10% maximum percentage which may be covered by all buildings. The Official and Open Space District is also subject to special requirements 1, 2, 5, 6, and 15 of Hingham Zoning Bylaws dimensional requirements, as defined in section IV-B. The special requirements define additional rules for construction adjacent to a residential district, minimum natural or landscaped area, green space along the lot lines of a property, and other dimensional requirements. Hardscape Infrastructure Roadways and Parking Lots: The site is accessible via a single two-way driveway and two one-way driveways, all of which are on Downer Avenue. The two one-way drives are used for pick-up/drop-off and bus rotation while the two-way drive is used for parking lot access as shown in Photos 1, 2, and 3 in Attachment B. Public roads adjacent to the Site include Downer Avenue and Broad Cove Road. Downer Avenue is a locally owned road and Broad Cove Road is under MassDOT jurisdiction. As such, any alterations to the Broad Cove Road right of way will require a MassDOT Access Permit. There are 87 existing parking spaces, including 8 accessible spaces, on the Site. Parking quantity requirements for educational facilities are not defined in the Hingham Zoning Bylaws. The Institute for Transportation Engineers ( ITE ) developed a Parking Generation informational report that provides data for estimated parking demand at various land uses. The 4 th edition of the Parking Generation report lists an average of 0.17 vehicles per student peak parking demand for elementary schools. Based on the official 2016 enrollment of 470 students for the Foster Elementary School, the current parking count is sufficient. However, it should be noted that this demand does not include queued pick-up or drop-off vehicles. The site is furnished with the existing school building, paved parking areas, driveways, pedestrian walks, athletic facilities, and associated structures. The existing paved parking and drives are in fair condition with occasional surface cracks and pavement patches in the surface. Lack of access to Broad Cove Road due to the existing wetlands makes Downer Avenue the only viable road for vehicular access to the Site. Future development of the Site will require a traffic impact analysis to further asses existing traffic patterns, existing roadways, and traffic conditions associated with future development. Natural Environment Topography: The topography of the site generally pitches downgradient from the north to the south. The highest elevation on the Site is at the northeast corner of the property at approximately elevation 110 feet (Massachusetts LIDAR, NAVD 88). The northern portion of the site is occupied by a large hill, which extends from the high point at elevation 110 feet to the toe of the slope at elevation 20 feet. The lowest elevation on site is within the river extending out from Broad Cove, a small cove connected to the larger Hingham Bay, in the southern portion of the site below elevation 5ft. Record topographic maps from 1943, indicate that a low lying wetland area once existed
3 Hingham School Building Committee (3) December 4, 2017 in the location of the existing school. Later topographic maps, dated 1959, provide wetland boundaries that do not conflict with the school building, indicating that the school may be located on previously filled wetlands. Soils: Existing soils were evaluated based on the USDA Natural Resource Conservation Services (NRCS) Web Soil Survey. Below is a description of the soils that are shown throughout the site as shown on the web soil survey. A copy of the NRCS survey can be found in Attachment C. The northern and northeast steeply sloped section of the Site is composed of Newport Loam at varying slopes, map units 325C and 325E. The hydrologic soil group is in the dual B/D group. If a soil is assigned to a dual hydrologic group (A/D, B/D, or C/D), the first letter is for drained areas and the second is for undrained areas. Group B soils have a moderate rate of water transmission, while groups D soil have a very slow rate of water transmission. However, USDA notes that only the soils that in their natural condition are in group D are assigned to dual classes, and as such, this area is conservatively assumed to be a D type soil. Within the footprint of the school building and surrounding walks, drives, and parking lots, the soils consist of unrated urban land, map unit 602. This map unit consists of areas where 85 percent or more of the land is covered with impervious surfaces, such as buildings, pavement, etc. Urban land is not assigned a hydrologic soil group. The field behind the school is composed of wet substratum Udorthents (map unit 655A) and Swansea Muck (map unit 51A). As with the steep slope, soils within the field area have a dual B/D hydrologic soil group. The southern portion of the site, largely comprised of wetlands, contains Ipswich-Pawcatuck-Matunuck complex (map unit 666A). This material has a dual A/D hydrologic soil group, which means the drained condition has an excessively high water transmission rate, while the undrained condition has a very slow water transmission rate. The southern portion of the site also contains smaller amounts of Massasoit - Mashpee complex (map unit 37A) and Norwell mucky fine sandy loam (map unit 49A) at the east and west perimeters. Both of these materials have a D hydrologic soil group, consistent with a very low water transmission rate. Small portions of the western border of the site also contain (map unit 110B), which has a hydrologic soil group A. A type soils have an excessively high water transmission rate. Based on the web soil survey information, it is anticipated that the stormwater infiltration will be limited onsite. While the areas with dual hydrologic groups have the possibility of favorable drainage characteristics, it is currently assumed that all area with these groups are naturally in the undrained condition. Future development of the site will likely require test pit excavation to confirm groundwater depths or soil conditions. Wetlands: According to the Massachusetts GIS data layers ( MassGIS ), there are wetlands covering approximately 16 acres in the southern portion of the site as shown in Photo 4 of Attachment B. If determined to be jurisdictional wetlands, these areas will have a minimum 100-foot regulatory buffer zone. Section 7.4 of the Hingham Wetland Regulations states that structures not to be used for living quarters must have a minimum 50 foot setback from the resource area subject to protection. Work within the 100-foot regulatory buffer will require a Notice of Intent be filed with the Hingham Conservation Commission. There is also an unnamed stream running through the wetlands to the southern boundary of the site, where it flows into Broad Cove. The USGS classifies the stream as perennial while it is within the limits of the site, and transitions into an
4 Hingham School Building Committee (4) December 4, 2017 intermittent stream when running across Downer Avenue to the west. The Site is not located within a surface water protection area or within a wellhead protection area as defined by Massachusetts Department of Environmental Protection ( MassDEP"). The wetland and stream do not necessarily prohibit future proposed work, however, depending on the extent of the work, may require coordination and permitting through the Hingham Conservation Commission and other agencies. Based on information obtained from MassGIS, the Site does not appear to contain Critical Resources such as Aquifers, potential vernal pools, or certified vernal pools as defined by the Natural Heritage and Endangered Species Program ( NHESP ). If additional environmental review identifies vernal pool on the Site, local regulations require a 100-foot No-Disturbance Zone around the upland area edge or the wetland area edge that encompasses the vernal pool. According to the Flood Insurance Rate Maps available through the Federal Emergency Management Agency ( FEMA ), the southern portion of the Site is almost entirely within the Zone AE El. 6 with a stated 1% annual chance of flooding. The flood zone is mapped as extending over the majority of the wetland area and a portion of the school s grass fields. Future development of the site will likely require a delineation of onsite jurisdictional wetlands. Additional wetlands permitting would be dependent upon the footprint of future development in relation to delineated wetlands. Utility Infrastructure The existing conditions utility information was collected through review of online resources and record plans provided by the Town of Hingham School Maintenance Office. Additionally, a site visit was performed on November 7, 2017 to further investigate existing site conditions. Sewer: The Town of Hingham Department of Public Works ( DPW ) was not able to provide any records of existing sewer lines or structures in the area. At this time, sewer information is limited to observations made during the site visit and online imagery from public sources such a Google Maps. Online imagery indicates that a sewer main of unknown size is located on the west side of Downer Avenue. It is assumed that the existing school s sanitary sewer connects into the main on Downer Avenue, however, the sewer connection could not be confirmed. An oil and grease separator appears to be located adjacent to the western entrance of the school, which likely connects to the service pipe running to the sewer main on the road as shown in Photograph 5 in Attachment B. Future development will likely require replacement of the existing sanitary sewer connection and grease trap. Water: Aquarion Water Company is the current owner of the water main that serves the Foster Elementary School. Aquarion has provided record drawings of the site and surrounding area, titled Hingham, Hull, & N.Cohasset Water System, dated February 2017, and service cards for valves 425, 426, and 427, no date. Record documents and online mapping/imagery indicate two hydrants onsite. Pare confirmed the presence of these hydrants were during the site visit. One is adjacent to Downer Avenue at the front of the property (H217), and the other is located deep in the parking area on the southern side of the school (H515) Photograph 6 in Attachment B. According to the record drawings, a 6 cast iron water main connects to both hydrants on the east side of Downer Avenue. The school is serviced by a 4 cast iron line, which connects to the same water main as the hydrants. Any additional water lines, including irrigation and connections to ancillary structures onsite, are not known at this time.
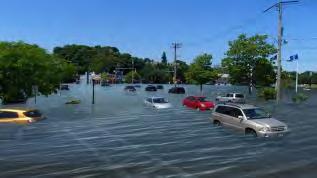
5 Hingham School Building Committee (5) December 4, 2017 Future development of the Site will require hydrant flow testing to determine available flow for fire suppression purposes. Modification or replacement of the existing water service connection will be required to facilitate future development. Drainage: The Town of Hingham has provided available record drawings of onsite and surrounding drainage, titled Additions to the William L. Foster School, Hingham, Massachusetts, dated March 5, 1956, and Plans of Planters Field Lane, Hingham Mass, dated February 28, The Town also provided an undated image of the internal GIS mapping of the area. Stormwater in the vicinity of Downer Avenue is collected from impervious and pervious surfaces via street-side and onsite catch basins, and conveyed via a closed drainage system as shown in Photograph 7 in Attachment B. Each of the three parking areas appear to have separate connections to a drainage main on Downer Avenue. The drainage main in Downer Avenue appears to outlet at the location where Downer Avenue crosses the intermittent stream south of the Site. Based on observations made during the site visit, it appears that the Downer Avenue stormwater system is receiving little treatment in regards to TSS removal. Multiple catch basins were observed in the recreation area east of the school as shown in Photo 8 of Attachment B. It is unknown whether these catch basins are connected to one of the parking lot drainage systems, outlet to an alternate location, or are independent dry wells. General grades suggest that overland sheet flow routes to the southern wetlands onsite. Future development of the Site will require modification to or replacement of the existing drainage system to meet the MassDEP stormwater standards and the Town of Hingham stormwater regulations. Natural Gas: National Grid Gas is the supplier of natural gas to the Town of Hingham. Record plans provided by the supplier, titled R1689, dated October 21, 2017, indicate a 4 plastic main located at the approximate center of Downer Avenue. The service line to the school, located just south of the Planter s Field Lane intersection, appears to be constructed of 1 inch high pressure carbon steel with a transition to 0.5 inch high pressure plastic. During the site walk, the connection to the school building was confirmed on the western exterior wall as shown in Photo 9 of Attachment B. Future development of the Site will require with National Grid Gas regarding any service modifications or improvements. Electric: Hingham Municipal Lighting Plant is the supplier of electricity to the Town of Hingham. Record images from the plant s GIS system indicate the location of the underground connection to the school from a utility pole on Downer Avenue. During the site visit, PVC piping running down Utility Pole 74 and into the ground with nearby red flags typical of electrical underground utility marking were observed. The flags indicated an underground conduit running towards the school building as shown in Photo 10 of Attachment B. Future development of the Site will require that the existing system be located and analyzed for capacity. Coordination with Hingham Municipal Lighting Plant will be necessary for any service modifications or improvements. Future Considerations Climate Change Vulnerability: Kleinfelder produced a report titled Climate Change Vulnerability, Risk Assessment and Adaptation Study, dated June 29, 2015, for the Town of Hingham. This report detailed the climate change risks to the Town of Hingham through the year 2070, which as a coastal community, was largely focused on the effects of sea level rise and storm surge from extreme weather events. Relevant sections of the
6 Hingham School Building Committee (6) December 4, 2017 report can be found in Attachment D, which includes methodology and how it was applied to site. The Foster Elementary School was identified as number one in the report s vulnerability assessment for infrastructure assets in 2070, which was ranked as a function of the probability of flooding, and the consequence of failure of that piece of infrastructure. It should be noted that while the probability of flooding in 2070 is listed at 100%, the site faces a 10% chance of flooding as soon as The report had several recommendations for site additions in the present day, by 2030, and by In the present day, they recommended developing an emergency relocation plan for students in the event of flooding. By 2030, the report recommended furnishing the existing building with several flood protection features, including a sump pump system and alarm, concrete enclosures around surface level HVAC entrances and vents, and drop in flood panels at entrances. By 2070, continued use of the school would require a perimeter flood protection walls and/or levees, or the redesign of the Broad Street culvert on Route 3A to accommodate tidal gate controls. Of particular note, the report used recommended design flood elevations of 10 ft and 14 ft (NAVD 88) for their recommended actions in 2030 and 2070, respectively. Any design of a new building should consider these elevations when deciding on a first floor elevation. As the majority of currently buildable area onsite lies between elevation 5 ft and 10 ft (NAVD 88), significant regrading or an elevated building design would be necessary if the site were to be developed in the future. Summary The existing Foster Elementary School site is suitable for future development, but is also limited by a number of factors. Development of the northern portion of the Site is limited by the significant slope and the existing trees while development of the southern portion of the Site is limited by jurisdictional wetlands and the floodplain. These restrictive areas may potentially be used to expand the site s buildable area at the increased cost of excavating and stabilizing a portion of the northern slope or replicating wetlands along the southern portion of the site. Removing the restrictive portions of the Site to the north and south yields a total buildable area of approximately 5 acres. This area currently consists of the school building, an ancillary building, parking areas, tennis courts, basketball courts, athletic fields, and playground. The total buildable area was further refined with the assumption that the existing school would remain in use during future development of the Site. The revised buildable area is approximately 70,000 square feet as shown in the Buildable Area figure provided in Attachment A. The Massachusetts School Building Authority ( MSBA ) Educational Program Space Standards and Guidelines provides the following gross square footage ( GSF ) per elementary school student based on projected enrollment: Projected Enrollment GSF per Student Based on this information, it is anticipated that a new elementary school with an enrollment off 470 to 500 students would require 75,200 to 78,500 GSF. It is assumed that this space would be spread throughout two level, yielding a potential building footprint of approximately 40,000 square feet. This footprint is shown graphically on the Building Area figure provided in Attachment A. Climate change vulnerability is a challenge that will need to be considered if the Site is to be developed in the
7 Hingham School Building Committee (7) December 4, 2017 future. This may include significant grading of the site or an elevated building design. Further investigation of these options would be necessary to determine their relative applicability and cost. Future development of a new elementary school at the Site will likely require a comprehensive phasing plan to mitigate operational impacts to the existing school if it is to remain in use. The existing recreational facilities and open space provides adequate area for a variety of development options including renovation or addition to the existing building, as well as new build scenarios. If you have any questions or comments, please do not hesitate to contact me. Sincerely, PARE CORPORATION Gary DeBlois Senior Project Engineer
8 Attachment A - Constraints Map


9 PARE JOB NO DECEMBER
10
11 Attachment B - Site Photos


12 Attachment B Photos: Photo 1: Parking Entrance Photo 2: Bus Entrance


13 Photo 3: Pickup/dropoff Entrance Photo 4: Southern Wetlands
14 Photo 5: Oil/grease Separator Photo 6: Rear of Parking Lot, Including Hydrant

15 Photo 7: Parking Lot Catch Basins Photo 8: Site Rear Catch Basin

16 Photo 9: Gas Connection to Building Photo 10: Electric Line Running Underground
17 Attachment C - NRCS Web Soil Survey

18 United States Department of Agriculture Natural Resources Conservation Service A product of the National Cooperative Soil Survey, a joint effort of the United States Department of Agriculture and other Federal agencies, State agencies including the Agricultural Experiment Stations, and local participants Custom Soil Resource Report for Plymouth County, Massachusetts October 11, 2017
19 Preface Soil surveys contain information that affects land use planning in survey areas. They highlight soil limitations that affect various land uses and provide information about the properties of the soils in the survey areas. Soil surveys are designed for many different users, including farmers, ranchers, foresters, agronomists, urban planners, community officials, engineers, developers, builders, and home buyers. Also, conservationists, teachers, students, and specialists in recreation, waste disposal, and pollution control can use the surveys to help them understand, protect, or enhance the environment. Various land use regulations of Federal, State, and local governments may impose special restrictions on land use or land treatment. Soil surveys identify soil properties that are used in making various land use or land treatment decisions. The information is intended to help the land users identify and reduce the effects of soil limitations on various land uses. The landowner or user is responsible for identifying and complying with existing laws and regulations. Although soil survey information can be used for general farm, local, and wider area planning, onsite investigation is needed to supplement this information in some cases. Examples include soil quality assessments ( portal/nrcs/main/soils/health/) and certain conservation and engineering applications. For more detailed information, contact your local USDA Service Center ( or your NRCS State Soil Scientist ( cid=nrcs142p2_053951). Great differences in soil properties can occur within short distances. Some soils are seasonally wet or subject to flooding. Some are too unstable to be used as a foundation for buildings or roads. Clayey or wet soils are poorly suited to use as septic tank absorption fields. A high water table makes a soil poorly suited to basements or underground installations. The National Cooperative Soil Survey is a joint effort of the United States Department of Agriculture and other Federal agencies, State agencies including the Agricultural Experiment Stations, and local agencies. The Natural Resources Conservation Service (NRCS) has leadership for the Federal part of the National Cooperative Soil Survey. Information about soils is updated periodically. Updated information is available through the NRCS Web Soil Survey, the site for official soil survey information. The U.S. Department of Agriculture (USDA) prohibits discrimination in all its programs and activities on the basis of race, color, national origin, age, disability, and where applicable, sex, marital status, familial status, parental status, religion, sexual orientation, genetic information, political beliefs, reprisal, or because all or a part of an individual's income is derived from any public assistance program. (Not all prohibited bases apply to all programs.) Persons with disabilities who require 2
20 alternative means for communication of program information (Braille, large print, audiotape, etc.) should contact USDA's TARGET Center at (202) (voice and TDD). To file a complaint of discrimination, write to USDA, Director, Office of Civil Rights, 1400 Independence Avenue, S.W., Washington, D.C or call (800) (voice) or (202) (TDD). USDA is an equal opportunity provider and employer. 3
21 Contents Preface... 2 Soil Map... 5 Soil Map...6 Legend...7 Map Unit Legend... 8 Map Unit Descriptions... 8 Plymouth County, Massachusetts A Massasoit - Mashpee complex, 0 to 3 percent slopes A Norwell mucky fine sandy loam, 0 to 3 percent slopes, extremely stony A Swansea muck, 0 to 1 percent slopes B Canton - Chatfield - Rock outcrop complex, 3 to 8 percent slopes B Newport loam, 3 to 8 percent slopes C Newport loam, 8 to 15 percent slopes E Newport loam, 15 to 35 percent slopes B Pittstown loam, 3 to 8 percent slopes B Urban land, 0 to 8 percent slopes A Urban land, wet substratum. 0 to 3 percent slopes B Urban land, outwash substratum, 0 to 8 percent slopes A Udorthents, wet substratum, 0 to 3 percent slopes A Ipswich-Pawcatuck-Matunuck complex, 0 to 1 percent slopes, freshened...27 References
22 Soil Map The soil map section includes the soil map for the defined area of interest, a list of soil map units on the map and extent of each map unit, and cartographic symbols displayed on the map. Also presented are various metadata about data used to produce the map, and a description of each soil map unit. 5

23 70 54' 12'' W Custom Soil Resource Report Soil Map 70 53' 48'' W ' 20'' N 42 14' 56'' N Soil Map may not be valid at this scale ' 20'' N 42 14' 56'' N 70 54' 12'' W N Map Scale: 1:3,650 if printed on A portrait (8.5" x 11") sheet. Meters Feet Map projection: Web Mercator Corner coordinates: WGS84 Edge tics: UTM Zone 19N WGS ' 48'' W
24 Custom Soil Resource Report MAP LEGEND MAP INFORMATION Area of Interest (AOI) Area of Interest (AOI) Soils Soil Map Unit Polygons Soil Map Unit Lines Soil Map Unit Points Special Point Features Blowout Borrow Pit Clay Spot Closed Depression Gravel Pit Gravelly Spot Landfill Lava Flow Marsh or swamp Mine or Quarry Miscellaneous Water Perennial Water Rock Outcrop Saline Spot Sandy Spot Severely Eroded Spot Spoil Area Stony Spot Very Stony Spot Wet Spot Other Special Line Features Water Features Streams and Canals Transportation Rails Interstate Highways US Routes Major Roads Local Roads Background Aerial Photography The soil surveys that comprise your AOI were mapped at 1:12,000. Warning: Soil Map may not be valid at this scale. Enlargement of maps beyond the scale of mapping can cause misunderstanding of the detail of mapping and accuracy of soil line placement. The maps do not show the small areas of contrasting soils that could have been shown at a more detailed scale. Please rely on the bar scale on each map sheet for map measurements. Source of Map: Natural Resources Conservation Service Web Soil Survey URL: Coordinate System: Web Mercator (EPSG:3857) Maps from the Web Soil Survey are based on the Web Mercator projection, which preserves direction and shape but distorts distance and area. A projection that preserves area, such as the Albers equal-area conic projection, should be used if more accurate calculations of distance or area are required. This product is generated from the USDA-NRCS certified data as of the version date(s) listed below. Soil Survey Area: Plymouth County, Massachusetts Survey Area Data: Version 9, Sep 14, 2016 Soil map units are labeled (as space allows) for map scales 1:50,000 or larger. Sinkhole Slide or Slip Date(s) aerial images were photographed: 25, 2014 Mar 30, 2011 Aug Sodic Spot The orthophoto or other base map on which the soil lines were compiled and digitized probably differs from the background imagery displayed on these maps. As a result, some minor shifting of map unit boundaries may be evident. 7
25 Custom Soil Resource Report Map Unit Legend 37A 49A 51A 110B 325B 325C 325E 345B 602B Map Unit Symbol Map Unit Name Acres in AOI Percent of AOI Massasoit - Mashpee complex, 0 to 3 percent slopes Norwell mucky fine sandy loam, 0 to 3 percent slopes, extremely stony Swansea muck, 0 to 1 percent slopes Canton - Chatfield - Rock outcrop complex, 3 to 8 percent slopes Newport loam, 3 to 8 percent slopes Newport loam, 8 to 15 percent slopes Newport loam, 15 to 35 percent slopes Pittstown loam, 3 to 8 percent slopes Urban land, 0 to 8 percent slopes 603A Urban land, wet substratum. 0 to 3 percent slopes 641B Urban land, outwash substratum, 0 to 8 percent slopes 655A Udorthents, wet substratum, 0 to 3 percent slopes 666A Ipswich-Pawcatuck-Matunuck complex, 0 to 1 percent slopes, freshened % % % % % % % % % % % % % Totals for Area of Interest % Map Unit Descriptions The map units delineated on the detailed soil maps in a soil survey represent the soils or miscellaneous areas in the survey area. The map unit descriptions, along with the maps, can be used to determine the composition and properties of a unit. A map unit delineation on a soil map represents an area dominated by one or more major kinds of soil or miscellaneous areas. A map unit is identified and named according to the taxonomic classification of the dominant soils. Within a taxonomic class there are precisely defined limits for the properties of the soils. On the landscape, however, the soils are natural phenomena, and they have the characteristic variability of all natural phenomena. Thus, the range of some 8
26 Custom Soil Resource Report observed properties may extend beyond the limits defined for a taxonomic class. Areas of soils of a single taxonomic class rarely, if ever, can be mapped without including areas of other taxonomic classes. Consequently, every map unit is made up of the soils or miscellaneous areas for which it is named and some minor components that belong to taxonomic classes other than those of the major soils. Most minor soils have properties similar to those of the dominant soil or soils in the map unit, and thus they do not affect use and management. These are called noncontrasting, or similar, components. They may or may not be mentioned in a particular map unit description. Other minor components, however, have properties and behavioral characteristics divergent enough to affect use or to require different management. These are called contrasting, or dissimilar, components. They generally are in small areas and could not be mapped separately because of the scale used. Some small areas of strongly contrasting soils or miscellaneous areas are identified by a special symbol on the maps. If included in the database for a given area, the contrasting minor components are identified in the map unit descriptions along with some characteristics of each. A few areas of minor components may not have been observed, and consequently they are not mentioned in the descriptions, especially where the pattern was so complex that it was impractical to make enough observations to identify all the soils and miscellaneous areas on the landscape. The presence of minor components in a map unit in no way diminishes the usefulness or accuracy of the data. The objective of mapping is not to delineate pure taxonomic classes but rather to separate the landscape into landforms or landform segments that have similar use and management requirements. The delineation of such segments on the map provides sufficient information for the development of resource plans. If intensive use of small areas is planned, however, onsite investigation is needed to define and locate the soils and miscellaneous areas. An identifying symbol precedes the map unit name in the map unit descriptions. Each description includes general facts about the unit and gives important soil properties and qualities. Soils that have profiles that are almost alike make up a soil series. Except for differences in texture of the surface layer, all the soils of a series have major horizons that are similar in composition, thickness, and arrangement. Soils of one series can differ in texture of the surface layer, slope, stoniness, salinity, degree of erosion, and other characteristics that affect their use. On the basis of such differences, a soil series is divided into soil phases. Most of the areas shown on the detailed soil maps are phases of soil series. The name of a soil phase commonly indicates a feature that affects use or management. For example, Alpha silt loam, 0 to 2 percent slopes, is a phase of the Alpha series. Some map units are made up of two or more major soils or miscellaneous areas. These map units are complexes, associations, or undifferentiated groups. A complex consists of two or more soils or miscellaneous areas in such an intricate pattern or in such small areas that they cannot be shown separately on the maps. The pattern and proportion of the soils or miscellaneous areas are somewhat similar in all areas. Alpha-Beta complex, 0 to 6 percent slopes, is an example. An association is made up of two or more geographically associated soils or miscellaneous areas that are shown as one unit on the maps. Because of present or anticipated uses of the map units in the survey area, it was not considered practical or necessary to map the soils or miscellaneous areas separately. The 9
27 Custom Soil Resource Report pattern and relative proportion of the soils or miscellaneous areas are somewhat similar. Alpha-Beta association, 0 to 2 percent slopes, is an example. An undifferentiated group is made up of two or more soils or miscellaneous areas that could be mapped individually but are mapped as one unit because similar interpretations can be made for use and management. The pattern and proportion of the soils or miscellaneous areas in a mapped area are not uniform. An area can be made up of only one of the major soils or miscellaneous areas, or it can be made up of all of them. Alpha and Beta soils, 0 to 2 percent slopes, is an example. Some surveys include miscellaneous areas. Such areas have little or no soil material and support little or no vegetation. Rock outcrop is an example. 10
28 Custom Soil Resource Report Plymouth County, Massachusetts 37A Massasoit - Mashpee complex, 0 to 3 percent slopes Map Unit Setting National map unit symbol: bd1q Elevation: 0 to 400 feet Mean annual precipitation: 41 to 54 inches Mean annual air temperature: 43 to 54 degrees F Frost-free period: 145 to 240 days Farmland classification: Not prime farmland Map Unit Composition Massasoit and similar soils: 55 percent Mashpee and similar soils: 35 percent Minor components: 10 percent Estimates are based on observations, descriptions, and transects of the mapunit. Description of Massasoit Setting Landform: Depressions, terraces, drainageways Landform position (two-dimensional): Toeslope, footslope Landform position (three-dimensional): Tread Down-slope shape: Concave Across-slope shape: Concave Parent material: Sandy and gravelly glaciofluvial deposits Typical profile Oe - 0 to 1 inches: moderately decomposed plant material Oa - 1 to 3 inches: highly decomposed plant material A - 3 to 5 inches: fine sand Eg1-5 to 11 inches: fine sand Eg2-11 to 13 inches: fine sand Bhs - 13 to 17 inches: fine sand Bsm - 17 to 23 inches: fine sand Bs - 23 to 26 inches: fine sand BC - 26 to 43 inches: fine sand Cg - 43 to 80 inches: loamy very fine sand Properties and qualities Slope: 0 to 3 percent Depth to restrictive feature: 7 to 20 inches to ortstein Natural drainage class: Poorly drained Runoff class: Very high Capacity of the most limiting layer to transmit water (Ksat): Very low to moderately low (0.00 to 0.01 in/hr) Depth to water table: About 0 to 12 inches Frequency of flooding: None Frequency of ponding: Occasional Available water storage in profile: Very low (about 1.3 inches) Interpretive groups Land capability classification (irrigated): None specified Land capability classification (nonirrigated): 4w 11
29 Custom Soil Resource Report Hydrologic Soil Group: D Hydric soil rating: Yes Description of Mashpee Setting Landform: Depressions, terraces, drainageways Landform position (two-dimensional): Footslope, toeslope Landform position (three-dimensional): Tread Down-slope shape: Concave Across-slope shape: Concave Parent material: Sandy and gravelly glaciofluvial deposits Typical profile Oe1-0 to 2 inches: moderately decomposed plant material Oe2-2 to 4 inches: moderately decomposed plant material Oa - 4 to 5 inches: highly decomposed plant material AE - 5 to 7 inches: loamy fine sand Eg - 7 to 11 inches: fine sand Bh1-11 to 13 inches: fine sand Bh2-13 to 17 inches: fine sand Bs - 17 to 24 inches: loamy fine sand C1-24 to 39 inches: fine sand C2-39 to 65 inches: fine sand Properties and qualities Slope: 0 to 3 percent Depth to restrictive feature: More than 80 inches Natural drainage class: Poorly drained Runoff class: Very high Capacity of the most limiting layer to transmit water (Ksat): Moderately high to high (1.42 to 5.95 in/hr) Depth to water table: About 0 to 12 inches Frequency of flooding: None Frequency of ponding: Occasional Available water storage in profile: Low (about 4.8 inches) Interpretive groups Land capability classification (irrigated): None specified Land capability classification (nonirrigated): 4w Hydrologic Soil Group: A/D Hydric soil rating: Yes Minor Components Deerfield Percent of map unit: 5 percent Landform: Deltas, outwash plains, terraces Landform position (two-dimensional): Footslope, summit Landform position (three-dimensional): Tread Down-slope shape: Concave Across-slope shape: Concave Hydric soil rating: No Rainberry Percent of map unit: 3 percent Landform: Depressions, kettles 12
30 Custom Soil Resource Report Landform position (two-dimensional): Toeslope Landform position (three-dimensional): Tread Down-slope shape: Concave Across-slope shape: Linear Hydric soil rating: Yes Squamscott Percent of map unit: 2 percent Landform: Lake terraces, lake plains Landform position (two-dimensional): Footslope, toeslope Landform position (three-dimensional): Talf Down-slope shape: Concave Across-slope shape: Concave Hydric soil rating: Yes 49A Norwell mucky fine sandy loam, 0 to 3 percent slopes, extremely stony Map Unit Setting National map unit symbol: bd1w Elevation: 10 to 400 feet Mean annual precipitation: 41 to 54 inches Mean annual air temperature: 43 to 54 degrees F Frost-free period: 145 to 240 days Farmland classification: Not prime farmland Map Unit Composition Norwell, extremely stony, and similar soils: 80 percent Minor components: 20 percent Estimates are based on observations, descriptions, and transects of the mapunit. Description of Norwell, Extremely Stony Setting Landform: Depressions, drainageways Landform position (two-dimensional): Toeslope, footslope Landform position (three-dimensional): Base slope Down-slope shape: Concave Across-slope shape: Concave Parent material: Sandy supraglacial meltout till over coarse-loamy lodgment till Typical profile Oe - 0 to 4 inches: moderately decomposed plant material A - 4 to 8 inches: mucky fine sandy loam Bg1-8 to 14 inches: gravelly sandy loam Bg2-14 to 19 inches: loamy fine sand Cdg - 19 to 29 inches: gravelly coarse sandy loam Cd - 29 to 65 inches: gravelly fine sandy loam 13
31 Custom Soil Resource Report Properties and qualities Slope: 0 to 3 percent Percent of area covered with surface fragments: 9.0 percent Depth to restrictive feature: 12 to 20 inches to densic material Natural drainage class: Poorly drained Runoff class: Very low Capacity of the most limiting layer to transmit water (Ksat): Low to moderately low (0.00 to 0.14 in/hr) Depth to water table: About 0 to 12 inches Frequency of flooding: None Frequency of ponding: Frequent Available water storage in profile: Very low (about 2.0 inches) Interpretive groups Land capability classification (irrigated): None specified Land capability classification (nonirrigated): 7s Hydrologic Soil Group: D Hydric soil rating: Yes Minor Components Ridgebury, extremely stony Percent of map unit: 5 percent Landform: Depressions, drainageways Landform position (two-dimensional): Toeslope, footslope Landform position (three-dimensional): Base slope Down-slope shape: Concave Across-slope shape: Concave Hydric soil rating: Yes Scituate, very stony Percent of map unit: 5 percent Landform: Drumlins, ridges Landform position (two-dimensional): Footslope, summit Landform position (three-dimensional): Interfluve Down-slope shape: Concave Across-slope shape: Concave Hydric soil rating: No Brockton, extremely stony Percent of map unit: 5 percent Landform: Depressions, drainageways Landform position (two-dimensional): Toeslope Landform position (three-dimensional): Base slope Down-slope shape: Concave Across-slope shape: Concave Hydric soil rating: Yes Mattapoisett, extremely stony Percent of map unit: 5 percent Landform: Depressions, drainageways Landform position (two-dimensional): Toeslope, footslope Landform position (three-dimensional): Base slope Down-slope shape: Concave Across-slope shape: Concave Hydric soil rating: Yes 14
32 Custom Soil Resource Report 51A Swansea muck, 0 to 1 percent slopes Map Unit Setting National map unit symbol: 2trl2 Elevation: 0 to 1,140 feet Mean annual precipitation: 36 to 71 inches Mean annual air temperature: 39 to 55 degrees F Frost-free period: 140 to 240 days Farmland classification: Not prime farmland Map Unit Composition Swansea and similar soils: 80 percent Minor components: 20 percent Estimates are based on observations, descriptions, and transects of the mapunit. Description of Swansea Setting Landform: Bogs, swamps Landform position (three-dimensional): Dip Down-slope shape: Concave Across-slope shape: Concave Parent material: Highly decomposed organic material over loose sandy and gravelly glaciofluvial deposits Typical profile Oa1-0 to 24 inches: muck Oa2-24 to 34 inches: muck Cg - 34 to 79 inches: coarse sand Properties and qualities Slope: 0 to 1 percent Depth to restrictive feature: More than 80 inches Natural drainage class: Very poorly drained Runoff class: Negligible Capacity of the most limiting layer to transmit water (Ksat): Moderately low to high (0.14 to in/hr) Depth to water table: About 0 to 6 inches Frequency of flooding: Rare Frequency of ponding: Frequent Available water storage in profile: Very high (about 16.5 inches) Interpretive groups Land capability classification (irrigated): None specified Land capability classification (nonirrigated): 8w Hydrologic Soil Group: B/D Hydric soil rating: Yes 15
33 Custom Soil Resource Report Minor Components Freetown Percent of map unit: 10 percent Landform: Bogs, swamps Landform position (three-dimensional): Dip Down-slope shape: Concave Across-slope shape: Concave Hydric soil rating: Yes Whitman Percent of map unit: 5 percent Landform: Depressions, drainageways Landform position (two-dimensional): Toeslope Landform position (three-dimensional): Base slope Down-slope shape: Concave Across-slope shape: Concave Hydric soil rating: Yes Scarboro Percent of map unit: 5 percent Landform: Depressions, drainageways Landform position (two-dimensional): Toeslope Landform position (three-dimensional): Base slope, tread, dip Down-slope shape: Concave Across-slope shape: Concave Hydric soil rating: Yes 110B Canton - Chatfield - Rock outcrop complex, 3 to 8 percent slopes Map Unit Setting National map unit symbol: 9y4v Elevation: 30 to 400 feet Mean annual precipitation: 41 to 54 inches Mean annual air temperature: 43 to 54 degrees F Frost-free period: 145 to 240 days Farmland classification: Not prime farmland Map Unit Composition Canton and similar soils: 40 percent Chatfield and similar soils: 25 percent Rock outcrop: 20 percent Minor components: 15 percent Estimates are based on observations, descriptions, and transects of the mapunit. Description of Canton Setting Landform: Ridges, hills, till plains Landform position (two-dimensional): Summit, shoulder 16
34 Custom Soil Resource Report Landform position (three-dimensional): Interfluve Down-slope shape: Convex Across-slope shape: Convex Parent material: Coarse-loamy eolian deposits over sandy and gravelly supraglacial meltout till Typical profile Oi - 0 to 1 inches: slightly decomposed plant material Oe - 1 to 2 inches: moderately decomposed plant material A - 2 to 3 inches: very fine sandy loam E - 3 to 4 inches: very fine sandy loam Bw1-4 to 5 inches: very fine sandy loam Bw2-5 to 15 inches: very fine sandy loam Bw3-15 to 24 inches: fine sandy loam BC - 24 to 28 inches: gravelly loamy sand 2C1-28 to 49 inches: gravelly coarse sand 2C2-49 to 73 inches: gravelly loamy coarse sand Properties and qualities Slope: 3 to 8 percent Depth to restrictive feature: 20 to 36 inches to strongly contrasting textural stratification Natural drainage class: Well drained Runoff class: Low Capacity of the most limiting layer to transmit water (Ksat): High (1.98 to 5.95 in/hr) Depth to water table: More than 80 inches Frequency of flooding: None Frequency of ponding: None Available water storage in profile: Low (about 3.4 inches) Interpretive groups Land capability classification (irrigated): None specified Land capability classification (nonirrigated): 7s Hydrologic Soil Group: A Hydric soil rating: No Description of Chatfield Setting Landform: Ridges, hills, till plains Landform position (two-dimensional): Shoulder, summit Landform position (three-dimensional): Interfluve Down-slope shape: Convex Across-slope shape: Convex Parent material: Coarse-loamy supraglacial meltout till Typical profile Oi - 0 to 1 inches: slightly decomposed plant material Oe - 1 to 2 inches: moderately decomposed plant material Oa - 2 to 3 inches: highly decomposed plant material A - 3 to 6 inches: very fine sandy loam Bw1-6 to 16 inches: very fine sandy loam Bw2-16 to 28 inches: very fine sandy loam 2R - 28 to 80 inches: bedrock 17
35 Custom Soil Resource Report Properties and qualities Slope: 3 to 8 percent Depth to restrictive feature: 20 to 39 inches to lithic bedrock Natural drainage class: Well drained Runoff class: Low Capacity of the most limiting layer to transmit water (Ksat): Moderately low to high (0.14 to 5.95 in/hr) Depth to water table: More than 80 inches Frequency of flooding: None Frequency of ponding: None Available water storage in profile: Low (about 3.4 inches) Interpretive groups Land capability classification (irrigated): None specified Land capability classification (nonirrigated): 6s Hydrologic Soil Group: B Hydric soil rating: No Description of Rock Outcrop Properties and qualities Slope: 3 to 8 percent Depth to restrictive feature: 0 inches to lithic bedrock Interpretive groups Land capability classification (irrigated): None specified Land capability classification (nonirrigated): 8s Minor Components Newfields Percent of map unit: 10 percent Landform: Hills, moraines, till plains Landform position (two-dimensional): Footslope, shoulder Landform position (three-dimensional): Interfluve Down-slope shape: Linear Across-slope shape: Concave Hydric soil rating: No Hollis Percent of map unit: 5 percent Landform: Ridges, hills Landform position (two-dimensional): Summit, shoulder Landform position (three-dimensional): Interfluve Down-slope shape: Convex Across-slope shape: Convex Hydric soil rating: No 18
36 Custom Soil Resource Report 325B Newport loam, 3 to 8 percent slopes Map Unit Setting National map unit symbol: bcxy Elevation: 30 to 400 feet Mean annual precipitation: 41 to 54 inches Mean annual air temperature: 43 to 54 degrees F Frost-free period: 145 to 240 days Farmland classification: All areas are prime farmland Map Unit Composition Newport and similar soils: 80 percent Minor components: 20 percent Estimates are based on observations, descriptions, and transects of the mapunit. Description of Newport Setting Landform: Drumlins, hills, till plains Landform position (two-dimensional): Summit, shoulder Landform position (three-dimensional): Interfluve Down-slope shape: Convex Across-slope shape: Convex Parent material: Coarse-loamy eolian deposits over coarse-loamy lodgment till Typical profile Ap - 0 to 9 inches: loam Bw1-9 to 23 inches: loam Bw2-23 to 29 inches: loam Cd1-29 to 42 inches: loam Cd2-42 to 63 inches: loam Properties and qualities Slope: 3 to 8 percent Depth to restrictive feature: 20 to 39 inches to densic material Natural drainage class: Well drained Runoff class: Low Capacity of the most limiting layer to transmit water (Ksat): Very low to moderately high (0.00 to 0.20 in/hr) Depth to water table: About 20 to 29 inches Frequency of flooding: None Frequency of ponding: None Available water storage in profile: Low (about 4.8 inches) Interpretive groups Land capability classification (irrigated): None specified Land capability classification (nonirrigated): 2e 19
37 Custom Soil Resource Report Hydrologic Soil Group: B/D Hydric soil rating: No Minor Components Pittstown Percent of map unit: 8 percent Landform: Drumlins, ridges, till plains Landform position (two-dimensional): Shoulder, footslope Landform position (three-dimensional): Interfluve Down-slope shape: Concave Across-slope shape: Concave Hydric soil rating: No Montauk Percent of map unit: 5 percent Landform: Drumlins, ground moraines, till plains Landform position (two-dimensional): Summit, shoulder Landform position (three-dimensional): Interfluve Down-slope shape: Convex Across-slope shape: Convex Hydric soil rating: No Paxton Percent of map unit: 5 percent Landform: Drumlins, ground moraines, hills, till plains Landform position (two-dimensional): Shoulder, summit Landform position (three-dimensional): Interfluve Down-slope shape: Convex Across-slope shape: Convex Hydric soil rating: No Woodbridge Percent of map unit: 2 percent Landform: Drumlins, hills, till plains Landform position (two-dimensional): Summit, shoulder Landform position (three-dimensional): Interfluve Down-slope shape: Concave Across-slope shape: Concave Hydric soil rating: No 325C Newport loam, 8 to 15 percent slopes Map Unit Setting National map unit symbol: bcxz Elevation: 30 to 400 feet Mean annual precipitation: 41 to 54 inches Mean annual air temperature: 43 to 54 degrees F Frost-free period: 145 to 240 days Farmland classification: Farmland of statewide importance 20
38 Custom Soil Resource Report Map Unit Composition Newport and similar soils: 80 percent Minor components: 20 percent Estimates are based on observations, descriptions, and transects of the mapunit. Description of Newport Setting Landform: Drumlins, hills, till plains Landform position (two-dimensional): Shoulder, backslope Landform position (three-dimensional): Side slope Down-slope shape: Linear Across-slope shape: Convex Parent material: Coarse-loamy eolian deposits over coarse-loamy lodgment till Typical profile Ap - 0 to 9 inches: loam Bw1-9 to 23 inches: loam Bw2-23 to 29 inches: loam Cd1-29 to 42 inches: loam Cd2-42 to 63 inches: loam Properties and qualities Slope: 8 to 15 percent Depth to restrictive feature: 20 to 39 inches to densic material Natural drainage class: Well drained Runoff class: Low Capacity of the most limiting layer to transmit water (Ksat): Very low to moderately high (0.00 to 0.20 in/hr) Depth to water table: About 20 to 29 inches Frequency of flooding: None Frequency of ponding: None Available water storage in profile: Low (about 4.8 inches) Interpretive groups Land capability classification (irrigated): None specified Land capability classification (nonirrigated): 3e Hydrologic Soil Group: B/D Hydric soil rating: No Minor Components Pittstown Percent of map unit: 8 percent Landform: Drumlins, ridges, till plains Landform position (two-dimensional): Shoulder, footslope Landform position (three-dimensional): Interfluve Down-slope shape: Concave Across-slope shape: Concave Hydric soil rating: No Paxton Percent of map unit: 5 percent Landform: Drumlins, ground moraines, hills, till plains Landform position (two-dimensional): Shoulder, backslope Landform position (three-dimensional): Side slope 21
39 Custom Soil Resource Report Down-slope shape: Linear Across-slope shape: Convex Hydric soil rating: No Montauk Percent of map unit: 5 percent Landform: Drumlins, ground moraines, till plains Landform position (two-dimensional): Shoulder, backslope Landform position (three-dimensional): Side slope Down-slope shape: Linear Across-slope shape: Convex Hydric soil rating: No Woodbridge Percent of map unit: 2 percent Landform: Drumlins, hills, till plains Landform position (two-dimensional): Shoulder, backslope Landform position (three-dimensional): Side slope Down-slope shape: Linear Across-slope shape: Concave Hydric soil rating: No 325E Newport loam, 15 to 35 percent slopes Map Unit Setting National map unit symbol: bcy0 Elevation: 30 to 400 feet Mean annual precipitation: 41 to 54 inches Mean annual air temperature: 43 to 54 degrees F Frost-free period: 145 to 240 days Farmland classification: Not prime farmland Map Unit Composition Newport and similar soils: 80 percent Minor components: 20 percent Estimates are based on observations, descriptions, and transects of the mapunit. Description of Newport Setting Landform: Drumlins, hills, till plains Landform position (two-dimensional): Backslope Landform position (three-dimensional): Side slope Down-slope shape: Linear Across-slope shape: Convex Parent material: Coarse-loamy eolian deposits over coarse-loamy lodgment till Typical profile Ap - 0 to 9 inches: loam Bw1-9 to 23 inches: loam Bw2-23 to 29 inches: loam 22
40 Custom Soil Resource Report Cd1-29 to 42 inches: loam Cd2-42 to 63 inches: loam Properties and qualities Slope: 15 to 35 percent Depth to restrictive feature: 20 to 39 inches to densic material Natural drainage class: Well drained Runoff class: Low Capacity of the most limiting layer to transmit water (Ksat): Very low to moderately high (0.00 to 0.20 in/hr) Depth to water table: About 20 to 29 inches Frequency of flooding: None Frequency of ponding: None Available water storage in profile: Low (about 4.8 inches) Interpretive groups Land capability classification (irrigated): None specified Land capability classification (nonirrigated): 6e Hydrologic Soil Group: B/D Hydric soil rating: No Minor Components Paxton Percent of map unit: 10 percent Landform: Drumlins, ground moraines, hills, till plains Landform position (two-dimensional): Backslope Landform position (three-dimensional): Side slope Down-slope shape: Linear Across-slope shape: Convex Hydric soil rating: No Montauk Percent of map unit: 5 percent Landform: Drumlins, ground moraines, till plains Landform position (two-dimensional): Backslope Landform position (three-dimensional): Side slope Down-slope shape: Linear Across-slope shape: Convex Hydric soil rating: No Pittstown Percent of map unit: 5 percent Landform: Drumlins, ridges, till plains Landform position (two-dimensional): Shoulder, footslope Landform position (three-dimensional): Interfluve Down-slope shape: Concave Across-slope shape: Concave Hydric soil rating: No 23
41 Custom Soil Resource Report 345B Pittstown loam, 3 to 8 percent slopes Map Unit Setting National map unit symbol: bcyh Elevation: 30 to 400 feet Mean annual precipitation: 41 to 54 inches Mean annual air temperature: 43 to 54 degrees F Frost-free period: 145 to 240 days Farmland classification: All areas are prime farmland Map Unit Composition Pittstown and similar soils: 80 percent Minor components: 20 percent Estimates are based on observations, descriptions, and transects of the mapunit. Description of Pittstown Setting Landform: Drumlins, ridges, till plains Landform position (two-dimensional): Footslope, shoulder Landform position (three-dimensional): Interfluve Down-slope shape: Concave Across-slope shape: Concave Parent material: Coarse-loamy eolian deposits over coarse-loamy lodgment till Typical profile Ap - 0 to 9 inches: loam Bw1-9 to 14 inches: loam Bw2-14 to 19 inches: loam BC - 19 to 21 inches: gravelly loam Cd1-21 to 33 inches: gravelly loam Cd2-33 to 68 inches: gravelly loam Properties and qualities Slope: 3 to 8 percent Depth to restrictive feature: 20 to 39 inches to densic material Natural drainage class: Moderately well drained Runoff class: Low Capacity of the most limiting layer to transmit water (Ksat): Moderately low to moderately high (0.06 to 0.20 in/hr) Depth to water table: About 14 to 21 inches Frequency of flooding: None Frequency of ponding: None Available water storage in profile: Low (about 3.2 inches) Interpretive groups Land capability classification (irrigated): None specified Land capability classification (nonirrigated): 2e Hydrologic Soil Group: D Hydric soil rating: No 24
42 Custom Soil Resource Report Minor Components Scituate Percent of map unit: 5 percent Landform: Drumlins, ridges Landform position (two-dimensional): Footslope, shoulder Landform position (three-dimensional): Interfluve Down-slope shape: Concave Across-slope shape: Concave Hydric soil rating: No Newport Percent of map unit: 5 percent Landform: Drumlins, hills, till plains Landform position (two-dimensional): Shoulder, summit Landform position (three-dimensional): Interfluve Down-slope shape: Convex Across-slope shape: Convex Hydric soil rating: No Woodbridge Percent of map unit: 5 percent Landform: Drumlins, hills, till plains Landform position (two-dimensional): Summit, shoulder Landform position (three-dimensional): Interfluve Down-slope shape: Concave Across-slope shape: Concave Hydric soil rating: No Ridgebury Percent of map unit: 5 percent Landform: Depressions, drainageways Landform position (two-dimensional): Toeslope, footslope Landform position (three-dimensional): Base slope Down-slope shape: Concave Across-slope shape: Concave Hydric soil rating: Yes 602B Urban land, 0 to 8 percent slopes Map Unit Composition Urban land: 95 percent Minor components: 5 percent Estimates are based on observations, descriptions, and transects of the mapunit. Minor Components Urban land, wet substratum Percent of map unit: 5 percent 25
43 Custom Soil Resource Report 603A Urban land, wet substratum. 0 to 3 percent slopes Map Unit Composition Urban land, wet substratum: 95 percent Minor components: 5 percent Estimates are based on observations, descriptions, and transects of the mapunit. Minor Components Urban land Percent of map unit: 5 percent 641B Urban land, outwash substratum, 0 to 8 percent slopes Map Unit Composition Urban land, outwash substratum: 100 percent Estimates are based on observations, descriptions, and transects of the mapunit. 655A Udorthents, wet substratum, 0 to 3 percent slopes Map Unit Setting National map unit symbol: bd0f Elevation: 0 to 390 feet Mean annual precipitation: 41 to 54 inches Mean annual air temperature: 43 to 54 degrees F Frost-free period: 145 to 240 days Farmland classification: Not prime farmland Map Unit Composition Udorthents, wet substratum, and similar soils: 85 percent Minor components: 15 percent Estimates are based on observations, descriptions, and transects of the mapunit. Description of Udorthents, Wet Substratum Setting Landform position (two-dimensional): Footslope Landform position (three-dimensional): Tread Down-slope shape: Linear Across-slope shape: Linear Parent material: Coarse-loamy human transported material Typical profile ^A - 0 to 5 inches: loam ^C1-5 to 21 inches: gravelly loam ^C2-21 to 80 inches: gravelly sandy loam 26
44 Custom Soil Resource Report Properties and qualities Slope: 0 to 3 percent Depth to restrictive feature: More than 80 inches Natural drainage class: Moderately well drained Runoff class: Low Capacity of the most limiting layer to transmit water (Ksat): Moderately low to very high (0.01 to in/hr) Depth to water table: About 20 to 21 inches Frequency of flooding: None Frequency of ponding: None Available water storage in profile: Moderate (about 7.9 inches) Interpretive groups Land capability classification (irrigated): None specified Land capability classification (nonirrigated): 2w Hydrologic Soil Group: B/D Hydric soil rating: No Minor Components Udipsamments, wet substratum Percent of map unit: 5 percent Landform: Dikes Landform position (two-dimensional): Footslope Landform position (three-dimensional): Tread Down-slope shape: Linear, convex Across-slope shape: Linear Hydric soil rating: No Udipsamments Percent of map unit: 5 percent Landform: Dikes Landform position (two-dimensional): Summit Landform position (three-dimensional): Tread Down-slope shape: Linear, convex Across-slope shape: Linear Hydric soil rating: No Udorthents, loamy Percent of map unit: 5 percent Landform position (three-dimensional): Tread Down-slope shape: Linear Across-slope shape: Linear Hydric soil rating: No 666A Ipswich-Pawcatuck-Matunuck complex, 0 to 1 percent slopes, freshened Map Unit Setting National map unit symbol: 2pfdl 27
45 Custom Soil Resource Report Elevation: 0 to 30 feet Mean annual precipitation: 41 to 54 inches Mean annual air temperature: 43 to 54 degrees F Frost-free period: 145 to 240 days Farmland classification: Not prime farmland Map Unit Composition Ipswich, freshened, and similar soils: 45 percent Pawcatuck, freshened, and similar soils: 25 percent Matunuck, freshened, and similar soils: 20 percent Minor components: 10 percent Estimates are based on observations, descriptions, and transects of the mapunit. Description of Ipswich, Freshened Setting Landform: Salt marshes, tidal marshes Landform position (two-dimensional): Toeslope Landform position (three-dimensional): Talf Down-slope shape: Linear Across-slope shape: Linear Parent material: Herbaceous organic material Typical profile Oe1-0 to 18 inches: mucky peat Oe2-18 to 42 inches: mucky peat Oa - 42 to 62 inches: muck Properties and qualities Slope: 0 to 1 percent Depth to restrictive feature: More than 80 inches Natural drainage class: Very poorly drained Runoff class: High Capacity of the most limiting layer to transmit water (Ksat): Moderately high to very high (0.57 to in/hr) Depth to water table: About 0 to 12 inches Frequency of flooding: Rare Frequency of ponding: Frequent Available water storage in profile: Very high (about 16.2 inches) Interpretive groups Land capability classification (irrigated): None specified Land capability classification (nonirrigated): 8w Hydrologic Soil Group: A/D Hydric soil rating: Yes Description of Pawcatuck, Freshened Setting Landform: Salt marshes, tidal marshes Landform position (two-dimensional): Toeslope Landform position (three-dimensional): Talf Down-slope shape: Linear Across-slope shape: Linear Parent material: Herbaceous organic material over sandy and gravelly glaciofluvial deposits and/or sandy and gravelly marine deposits 28
46 Custom Soil Resource Report Typical profile Oi - 0 to 23 inches: peat Oa - 23 to 26 inches: muck Cg - 26 to 72 inches: sand Properties and qualities Slope: 0 to 1 percent Depth to restrictive feature: More than 80 inches Natural drainage class: Very poorly drained Runoff class: High Capacity of the most limiting layer to transmit water (Ksat): Moderately high to very high (0.57 to in/hr) Depth to water table: About 0 to 12 inches Frequency of flooding: Rare Frequency of ponding: Frequent Available water storage in profile: Low (about 3.5 inches) Interpretive groups Land capability classification (irrigated): None specified Land capability classification (nonirrigated): 8w Hydrologic Soil Group: A/D Hydric soil rating: Yes Description of Matunuck, Freshened Setting Landform: Salt marshes, tidal marshes Landform position (two-dimensional): Toeslope Landform position (three-dimensional): Talf Down-slope shape: Linear Across-slope shape: Linear Parent material: Herbaceous organic material over sandy and gravelly glaciofluvial deposits and/or sandy and gravelly marine deposits Typical profile Oe - 0 to 6 inches: mucky peat Oi - 6 to 12 inches: peat Cg - 12 to 72 inches: sand Properties and qualities Slope: 0 to 1 percent Depth to restrictive feature: More than 80 inches Natural drainage class: Very poorly drained Runoff class: High Capacity of the most limiting layer to transmit water (Ksat): Moderately high to very high (0.57 to in/hr) Depth to water table: About 0 to 12 inches Frequency of flooding: Rare Frequency of ponding: Frequent Available water storage in profile: Low (about 5.2 inches) Interpretive groups Land capability classification (irrigated): None specified Land capability classification (nonirrigated): 8w Hydrologic Soil Group: A/D Hydric soil rating: Yes 29
47 Custom Soil Resource Report Minor Components Water Percent of map unit: 2 percent Dune land Percent of map unit: 2 percent Landform: Dunes Landform position (two-dimensional): Backslope Landform position (three-dimensional): Riser Down-slope shape: Convex Across-slope shape: Convex Hydric soil rating: Unranked Beaches, sandy Percent of map unit: 2 percent Landform: Barrier beaches, beaches, shores, back-barrier beaches Landform position (two-dimensional): Footslope Landform position (three-dimensional): Riser Down-slope shape: Convex Across-slope shape: Linear Hydric soil rating: Unranked Hooksan Percent of map unit: 2 percent Landform: Beaches, dunes Landform position (two-dimensional): Shoulder Landform position (three-dimensional): Riser Down-slope shape: Convex Across-slope shape: Convex Hydric soil rating: No Oxyaquic udipsamments Percent of map unit: 2 percent Landform: Beaches, dunes Landform position (two-dimensional): Footslope Landform position (three-dimensional): Tread Down-slope shape: Linear Across-slope shape: Linear Hydric soil rating: No 30
48 References American Association of State Highway and Transportation Officials (AASHTO) Standard specifications for transportation materials and methods of sampling and testing. 24th edition. American Society for Testing and Materials (ASTM) Standard classification of soils for engineering purposes. ASTM Standard D Cowardin, L.M., V. Carter, F.C. Golet, and E.T. LaRoe Classification of wetlands and deep-water habitats of the United States. U.S. Fish and Wildlife Service FWS/OBS-79/31. Federal Register. July 13, Changes in hydric soils of the United States. Federal Register. September 18, Hydric soils of the United States. Hurt, G.W., and L.M. Vasilas, editors. Version 6.0, Field indicators of hydric soils in the United States. National Research Council Wetlands: Characteristics and boundaries. Soil Survey Division Staff Soil survey manual. Soil Conservation Service. U.S. Department of Agriculture Handbook nrcs/detail/national/soils/?cid=nrcs142p2_ Soil Survey Staff Soil taxonomy: A basic system of soil classification for making and interpreting soil surveys. 2nd edition. Natural Resources Conservation Service, U.S. Department of Agriculture Handbook Soil Survey Staff Keys to soil taxonomy. 11th edition. U.S. Department of Agriculture, Natural Resources Conservation Service. Tiner, R.W., Jr Wetlands of Delaware. U.S. Fish and Wildlife Service and Delaware Department of Natural Resources and Environmental Control, Wetlands Section. United States Army Corps of Engineers, Environmental Laboratory Corps of Engineers wetlands delineation manual. Waterways Experiment Station Technical Report Y United States Department of Agriculture, Natural Resources Conservation Service. National forestry manual. home/?cid=nrcs142p2_ United States Department of Agriculture, Natural Resources Conservation Service. National range and pasture handbook. detail/national/landuse/rangepasture/?cid=stelprdb
49 Custom Soil Resource Report United States Department of Agriculture, Natural Resources Conservation Service. National soil survey handbook, title 430-VI. nrcs/detail/soils/scientists/?cid=nrcs142p2_ United States Department of Agriculture, Natural Resources Conservation Service Land resource regions and major land resource areas of the United States, the Caribbean, and the Pacific Basin. U.S. Department of Agriculture Handbook cid=nrcs142p2_ United States Department of Agriculture, Soil Conservation Service Land capability classification. U.S. Department of Agriculture Handbook
50 Attachment A - Constraints Map


51 Climate Change Vulnerability, Risk Assessment and Adaptation Study Town of Hingham, MA June 29, 2015
52 Climate Change Vulnerability, Risk Assessment and Adaptation Study Hingham, MA TABLE OF CONTENTS INTRODUCTION... 3 Project Team... 3 Public Outreach... 3 Acknowledgements... 4 INUNDATION MODELING... 5 Sea Level Rise and Storm Surge Model... 5 Storm Events and Climatology... 6 Sea Level Rise Scenarios... 7 Planning Horizons... 9 Modeling the Effects of Coastal Storms and Climate Change...10 Model Calibration and Validation...11 Inundation Maps D Image Renderings...12 NATURAL RESOURCES MODELING...13 Modeling...13 Elevation Information...13 Wetland Classification Information...13 Sea Level Rise Projections...13 Additional Data Input...14 Impacts to Natural Resources...14 INFRASTRUCTURE VULNERABILITY ASSESSMENT Scope of Infrastructure Vulnerability Assessment...16 Using Risk to Understand the Vulnerability of Infrastructure Susceptible To Flooding...16 Risk Assessment A Five Step Process...17 Vulnerability Assessment Results...23 ADAPTATION STRATEGIES...28 General...28 Recommended Base Flood Elevations...28 Recommendations for Infrastructure...30 Coastal Stabilization Structures
53 Climate Change Vulnerability, Risk Assessment and Adaptation Study Hingham, MA Facilities/Buildings...32 Roadways...38 Recommendations for Natural Resources...45 Policies/Regulations...47 Potential Amendments to Hingham Wetland Regulations...47 Potential Zoning By-Law Changes...48 Potential Changes to the Planning Board Rules and Regulations for Subdivisions...49 Land/Resource Acquisition...49 Potential Policies for Public Development...49 Install a Tide Gauge in Hingham Harbor...50 Develop a Coastal Flood Operations Plan...50 LIMITATIONS...51 APPENDICES APPENDIX A INUNDATION MAPS A-1: 2030 Percent Risk of Flooding A-2: Percent Risk of Flooding A-3: Present Depth of Flooding at 1% Annual Probability ( 100 year recurrence) A-4: 2030 Depth of Flooding at 1% Annual Probability ( 100 year recurrence) A-5: Depth of Flooding at 1% Annual Probability ( 100 year recurrence) A-6: Present - Depth of Flooding at 0.2% Annual Probability ( 500 year recurrence) A-7: Depth of Flooding at 0.2% Annual Probability ( 500 year recurrence) A-8: Depth of Flooding at 0.2% Annual Probability ( 500 year recurrence) A-9: Depth of Flooding Sea Level Rise Only A-10: Depth of Flooding Sea Level Rise Only APPENDIX B WETLAND CLASSIFICATION MAPS AND DATA B1: 2011 Wetland Classification Areas In Hingham B2: 2030 Wetland Classification Areas In Hingham B3: 2070 Wetland Classification Areas In Hingham Table B1 NWI Category to SLAMM Code Conversion Table APPENDIX C RISK ASSESSMENT DATA Table C1: Risk Assessment Summary Table for All Assets -2-
54 Climate Change Vulnerability, Risk Assessment and Adaptation Study Hingham, MA INTRODUCTION The Town of Hingham is particularly vulnerable to sea level rise being a coastal community located on Hingham Bay and the edge of Boston Harbor. The Hingham coastline has extensive floodplains and estuaries that reach into the inland areas of the town and extensive salt marshes associated with rivers as well as beaches that are subject to tidal action and the effects of storm surge. Sections of the Town subject to potential flooding contain public infrastructure, commercial development and residential areas that can be severely affected by flooding. Given its exposure to the combined effects of sea level rise and storm surge from extreme storm events, the Town of Hingham applied for and was a awarded a Coastal Community Resilience Grant from the Massachusetts Coastal Zone Management Agency (CZM) under CZM s Pilot Grants Program for Fiscal Year This project has four primary goals: 1. Identify areas of the town that are vulnerable to the combined effects of sea level rise and storm surge from extreme storm events 2. Assess the vulnerability of municipally-owned public infrastructure and natural resources 3. Identify adaptation strategies that will help to mitigate the long-term effects of sea level rise and storm surge. 4. Educate the public, town officials and state legislators about those potential impacts Project Team The Town of Hingham selected the team of Kleinfelder and Woods Hole Group through a Request for Proposal process. Kleinfelder, located in Cambridge, MA, was the prime consultant responsible for client liaison, vulnerability assessment, adaptation planning, and public process. Woods Hole Group, located in Falmouth, MA, was responsible for inundation modeling and natural resource impacts. The team s primary members included: Andre Martecchini, PE Kleinfelder - Project Manager, Public Process Nasser Brahim Kleinfelder - Project Scientist, Vulnerability Assessment, Adaptation Planning Indrani Ghosh, PhD Kleinfelder Project Engineer, Inundation Modeling and Vulnerability Assessment Kirk Bosma, PE Woods Hole Group Inundation and Natural Resources Modeling Kleinfelder worked closely with a Town Steering Committee which included the following members: Abby Piersall (Town Project Scott McIsaac Richard Cook Manager) Mary Savage Dunham Jim Murphy Ken Corson Monica Conyngham Walter Sullivan Brian Knies Roger Fernandes Randy Sylvester -3-
55 Climate Change Vulnerability, Risk Assessment and Adaptation Study Hingham, MA Public Outreach As noted above, one of the primary goals of the project was to raise public awareness of both the escalating flood risks posed by sea level rise and storm surge, and the strategies available to adapt to those changes over time. The Town organized public outreach events at each project milestone to keep the public abreast of the latest findings, gather input at crucial junctures, and facilitate active engagement over the lifetime of the project. At these events, the Project Team shared information on climate change, flood modeling, Hingham s coastal flood hazards, vulnerability and risk of Hingham s public infrastructure and natural resources, and adaptation options and costs. Following is a list of the public outreach events organized as part of the project: Steering Committee meetings o September 15, 2014 (Kick-off) o October 20, 2014 (Phase I: Study Parameters) o February 3, 2015 (Phase II: Vulnerability Assessment) o April 6, 2015 (Phase II: Vulnerability Assessment) o June 10,2015 (Phase III: Adaptation) o July 2015, TBD (Final meeting) Board of Selectmen briefings o November 6, 2014 o July 2015, TBD Joint meetings of the Planning Board and Conservation Commission (Board of Selectmen invited) o November 17, 2014 (Phase I: Study Parameters) o April 6, 2015 (Phase II: Vulnerability Assessment) o July 2015, TBD Project-specific Public Meetings o April 16, 2015 (Phase II: Vulnerability Assessment) o July 2015, TBD (Phase III: Adaptation) with Planning Board/Conservation Commission Acknowledgements We wish to acknowledge the contribution of the Massachusetts Department of Transportation under the direction of Steven Miller, Project Manager, and the Federal Highway Administration related to the modeling associated with the Boston Harbor Flood Risk Model (BH-FRM). We also wish to acknowledge the participation of Jason Burtner and Tricia Bowen of the Massachusetts Coastal Zone Management (CZM) during Steering Committee meetings and public presentations for this project. -4-
56 Climate Change Vulnerability, Risk Assessment and Adaptation Study Hingham, MA INUNDATION MODELING Sea Level Rise and Storm Surge Model The hydrodynamic modeling utilized for this study is based on mathematical representations of the processes that affect coastal water levels including tides, waves, winds, storm surge, sea level rise, wave set-up, etc. at a fine enough resolution to identify site-specific locations that may require adaptation alternatives. The water surface was modelled using the ADvanced CIRCulation (ADCIRC) software to predict storm surge flooding coupled with the Simulated WAves Nearshore (SWAN) software, a wave generation and transformation model. Water surface modeling was performed by the Woods Hole Group as part of the Boston Harbor Flood Risk Model (BH-FRM), which was developed for the Massachusetts Department of Transportation (MassDOT) and the Federal Highway Administration (FHWA) to assess potential flooding vulnerabilities in the Central Artery tunnel system and other transportation infrastructure. Since the BH-FRM model domain includes the entire greater Boston area, including the Town of Hingham, this model was ideally suited to assess the vulnerability and risk of coastal flooding to Hingham s infrastructure and natural resources. Using this existing model was beneficial to the Town of Hingham since much of the upfront work in developing the model was already conducted as part of the MassDOT/FHWA project. The ADCIRC model is tightly coupled with SWAN, dynamically exchanging physical processes information during each time step, to provide an accurate representation of water surface elevations, winds, waves, and flooding along the Hingham coastline and surrounding upland areas. The spatial resolution of the model is 10 meters or less, sometimes as low as 2-3 meters to capture important changes in topography and physical processes related to storm dynamics. This high-resolution model offers more accuracy than other storm surge models, such as SLOSH. This modeling approach is also far superior compared to a more rudimentary bathtub approach, since the latter does not account for critical physical processes that occur during a storm event, including waves and winds, nor can it determine the volumetric flux of water that may be able to access certain areas. The model explicitly and quantitatively incorporates climate change influences on sea level rise, tides, waves, storm track, and storm intensity for the present (2013), 2030, and 2070 time horizons. It models a statistically-robust sample of storms, including tropical (hurricanes) and extra-tropical (nor easters), based on the region s existing and evolving climatology, calculates associated water elevations, and runs mathematical and geospatial analyses on the water elevations generated to estimate the probability of different water elevations being exceeded at nodal points within the model boundary. The resulting flood risk maps and probability curves can be interpreted using geographic information systems (GIS) to identify the estimated annual probability, or likelihood, that any node within the model will experience flooding, and if so, up to what elevation. The proposed modeling approach is probability-based, which will be beneficial to the Town to assess the vulnerability and risk of infrastructure, evaluate its resiliency, and plan for adaptation options to mitigate future flooding damage for the Town of Hingham. It will also produce information that can be used to inform engineering design criteria since it provides the probability of an event occurring in this changing regime, such as the new 1% event flood levels (equivalent to a 100 year recurrence event). This risk-based approach uses a fully optimized Monte Carlo approach, simulating a statistically robust set of storms (both tropical and extra-tropical) for each sea level rise (SLR) scenario. Results of the Monte Carlo simulations are used to generate Cumulative probability Distribution Functions (CDFs) of the storm surge water levels at a high degree of spatial precision. In particular, an accurate and precise -5-

57 Climate Change Vulnerability, Risk Assessment and Adaptation Study Hingham, MA assessment of the exceedance probability of combined SLR and storm surge is provided that can help decision makers to identify areas of existing vulnerability requiring immediate action in Hingham, as well as areas that benefit from present planning for future preparedness. Some of the unique aspects of the BH-FRM model include the following: An extensive understanding of the physical system as a whole. Inclusion of significant physical processes affecting water levels (e.g., tides, waves, winds, storm surge, sea level rise, wave set-up, etc.). Full consideration of the interaction between physical processes. Characterization of forcing functions that correspond with real world observations. Resolution that will be able to resolve physical and energetic processes, while also being able to identify site-specific locations that may require adaptation alternatives. Storm Events and Storm Climatology Figure 1 - Storms input into ADCIRC/SWAN model The types of storms included in the Monte Carlo simulations include both tropical storms (hurricanes) and extra-tropical storm (nor easters). Figure 1 shows the track lines of some of the associated hurricanes included in the model. The storm climatology parameters that are included in the BH-FRM model include, but are not limited to, wind directions and speeds, radius of maximum winds, pressure fields, and forward track of the storms in the Boston region. While hurricanes are typically shorter duration events that often last over only one tidal cycle, nor easters are longer duration events that typically last over multiple tidal cycles spanning multiple days. So the probability of a nor easter occurring or lasting through a high tide is more likely than a hurricane. Also, the diameter of a nor easter is usually 3-4 times that of hurricanes, and therefore they impact much larger areas of inland as well. The inclusion of nor easters is one of the unique aspects of the BH-FRM model that is not available in other storm surge models, such as SLOSH. Figure 1 shows a representation of storms included in the model. The probability of flooding due to both hurricanes and nor easters was estimated by developing composite probability distributions for flooding. Under current (circa 2013) and near-term future (2030) climate conditions, the probability of flooding due to nor easters dominates because the annual average frequency of nor easters (~2.3) is much higher than that of hurricanes (~0.34). The storm climatology for the hundreds of different types of storms are all factored in the Monte Carlo simulations of these storm events. The storm climatology is based on present climate for planning horizons until 2050, but for storm simulations beyond 2050, 21 st century climatology is used to simulate the storms. The latter half of 21 st century climatology projections factored into the BH-FRM model are based on climatology projections by the notable MIT professor Dr. Kerry Emmanuel. -6-
58 Climate Change Vulnerability, Risk Assessment and Adaptation Study Hingham, MA Sea Level Rise Scenarios Sea level rise (SLR) scenarios recommended by Parris et al. (2012) for the U.S. National Climate Assessment (Global Sea Level Rise Scenarios for the United States National Climate Assessment, NOAA Technical Report OAR CPO-1, December 12, 2012) were utilized in this study (Figure 2). These scenarios are the same scenarios recommended by Massachusetts CZM for assessing sea level rise, as well as those being used by the Massachusetts Department of Transportation and other state agencies and communities for vulnerability assessments. Figure 2 - Global mean sea level rise scenarios In addition to global SLR, local mean sea level changes are also factored in. Local mean sea level changes were estimated by considering local tide gage records in combination with models or actual measurements of the Earth s local tectonic movements. The NOAA tidal gage at Boston Harbor (station ID ) has recorded an increase in relative mean sea level of 2.63 mm (+/ mm) annually based on monthly mean sea level data from 1921 to 2006 (Figure 3). Over that same time period, the global rate of sea level rise was about 1.7 mm annually. This difference implies that there is about 1 mm (0.04 in./yr) per year local land subsidence in the relative sea level record for the Boston area (MA Adaptation report 2011). Since there are no long-term (> 50 years) tidal gages available for the Hingham Bay area, the rate of subsidence recorded at Boston Harbor was deemed appropriate to be factored in with the global SLR scenarios to determine the relative SLR projections for Hingham. -7-
59 Climate Change Vulnerability, Risk Assessment and Adaptation Study Hingham, MA Observed Rate of Sea Level Rise = 2.63+/-0.18 mm per year Figure 3 - Mean sea level trend at Boston Tide Gage (# ) Figure 4 below presents the total relative SLR values (global SLR and local land subsidence rate of 0.04 in./yr) for years 2020 through 2100 in 10 year increments for the Town of Hingham, considering a start year of 2013 (since 2013 was used as the start year for the SLR calculations in the BH-FRM model). Calculations were also performed using 2015 as the start year, considering 2015 will be the completion year of this project, and it was found that the difference in SLR projections between using 2013 and 2015 as the start years is less than one-tenth of a foot. Hence it was agreed to use the same SLR values that have been used in the BH-FRM model. Figure 4 presents the SLR projections for Hingham using the NOAA Highest, Intermediate-High and Intermediate-Low scenarios for the purposes of comparison. While selection of the Highest scenario may be interpreted as conservative, this selection also allows for representing a range of scenarios that allows decision makers to consider multiple future conditions and to develop multiple response options. For example the value for the Highest scenario at 2030, is also similar to the Intermediate-High value at that same time period, and approximately the Intermediate-Low value for The SLR scenarios that were utilized in the Hingham vulnerability assessment are: Existing conditions for the current time period (considered to be 2013). The value for the Highest scenario at 2030 (0.66 ft of SLR), which is also close to the Intermediate-High value at that same time period, and approximately the Intermediate-Low value for The value for the Highest scenario at 2070 (3.39 ft of SLR), which is also approximately the Intermediate-High scenario value for
60 Climate Change Vulnerability, Risk Assessment and Adaptation Study Hingham, MA Scenarios Global SLR (from 2013-year of interest) "Highest" (feet) Global SLR (from 2013-year of interest) "Intermediate- High" (feet) Global SLR (from 2013-year of interest) "Intermediate- Low" (feet) Land subsidence 0.04 in./yr Total Relative SLR - "Highest" (feet) Total Relative SLR "Intermediate-High" (feet) Total Relative SLR "Intermediate-Low" (feet) Figure 4 Sea level rise estimates for Hingham using the 2012 NOAA NCA SLR scenarios Planning Horizons 2030 and 2070 were selected as appropriate planning horizons for Hingham s vulnerability analysis to provide an estimate of short-term and mid-term vulnerabilities. As discussed above, risk-based scenarios are used to assess potential vulnerabilities in the Town of Hingham. The BH-FRM model was developed for the years 2030, 2070, and Since the Steering Committee requested the study to include only two planning horizons, 2030 and 2070 planning horizons with corresponding sea level rise projections were chosen for the following reasons: The BH-FRM model developed for the greater Boston area includes the Town of Hingham. The Town of Hingham benefits from using best-available model results at a lower cost than it would take to run any other modeling scenario. In addition, the model s performance and accuracy has already been peer-reviewed by MassDOT s scientific advisory team (15 years from 2015) planning horizon for near-term inundation modeling are consistent with planning horizons used in the majority of studies in Eastern Massachusetts, therefore allowing for easy comparisons (55 years from 2015) was recommended as a more useful long-term planning horizon for the following reasons: (a) The level of uncertainty associated with sea rise projections for the end-of-century (2100 and beyond) are quite high. (b) The expected service life of most infrastructure to be evaluated for risk is well below 100 years, and 2070 is closer to the expected life of typical infrastructure. (c) The 2070 timeframe is more consistent with other regional climate change vulnerability studies (e.g. Cities of Cambridge and Boston, MassDOT/FHWA). -9-

61 Climate Change Vulnerability, Risk Assessment and Adaptation Study Hingham, MA Modeling the Effects of Coastal Storms and Climate Change The first step in building the BH-FRM ADCIRC/SWAN model was construction of the modeling grid. The grid is a digital representation of the domain geometry that provides the spatial discretization on which the model equations are solved. The grid was developed at three resolutions: 1) a regional-scale mesh, which is a previously validated model mesh used in numerous Federal Emergency Management Agency (FEMA) studies, National Oceanic and Atmospheric Administration (NOAA) operational models, and most recently the United States Army Corps of Engineers North Atlantic Coast Comprehensive Study (NACCS); 2) a local-scale mesh providing an intermediate level of mesh resolution to transition from the regional-scale mesh to the highly resolved mesh along the Massachusetts coastline; and 3) a site-specific mesh of sufficient resolution to ensure that all critical topographic and bathymetric features that influence flow dynamics along the near shore are captured. The site-specific mesh includes areas of open water, along with a substantial portion of upland subject to present and future flooding. A screenshot of the model mesh for part of Hingham is shown in Figure 5. Figure 5 - Model mesh for BH-FRM ADCIRC/SWAN model -10-
62 Climate Change Vulnerability, Risk Assessment and Adaptation Study Hingham, MA Model Calibration and Validation The BH-FRM model was calibrated and validated at three levels. First, the BH-FRM model was calibrated to average tidal conditions over the entire model domain, Caribbean Islands to Canada to ensure the model was capable of reproducing water levels and coastal hydrodynamics. The magnitude of the bias is equal or less than 0.02 feet at all locations meaning that the calibration simulation reproduced average water levels within a quarter of an inch at all locations. Second, the model was calibrated to both water surface elevation time series data (measured at NOAA gages) and observed high water marks from the Blizzard of 1978, which had significant impact in the Hingham area. The water surface elevation time series comparison had a bias of less than a ¼ inch, root mean square error (RMSE) of 3 inches, and a percent error of 2.5%. The model had an 8% relative error to the observed high water mark data, which is quite reasonable considering the uncertainty associated with the high water mark observations. Greater error is expected when comparing model results to observed high water marks due to the uncertainty associated with the high water marks themselves, which are subject to human interpretation and judgment errors (e.g., wet mark on the side of a building). Finally, the model was validated to the Perfect Storm of 1991, to observed water surface elevation time series with bias of ¼ inch and RMSE of ¾ of an inch. This storm also had significant impacts in the Hingham area, hence was an appropriate storm for validation in this area as well. In order to select appropriate historical storm events for model calibration and validation, a number of key factors were considered, including: The historic storm must be considered a significant storm for the Boston area (a historic storm of record) that was of large enough magnitude to produce substantial upland flooding. The historic storm must have adequate meteorological conditions to be able to generate pressure and wind fields for ADCIRC input. This required the use of global reanalysis data, which were generally available for historic storm events post The historic storm must have sufficient observations and/or measurements of flooding within the northeast and Boston area. This could consist of high water marks data, tide station observations, wave observations, and other data measures. Complete details on the calibration and validation of the model can be found in the MassDOT-FHWA Pilot Project Report: Climate Change and Extreme Weather Vulnerability Assessments and Adaptation Options for the Central Artery (2015), which is available from MassDOT. In addition, the model was reviewed by a technical advisory committee made up of experts from the USGS, EPA, NOAA, USACE, and Woods Hole Oceanographic Institute. Inundation Maps The results of BH-FRM simulations for 2013, 2030 and 2070 were used to generate maps of potential flooding and associated water depths throughout the Town if Hingham. Two different types of maps were produced: Percent Risk of Flooding Maps - These maps can be used to identify locations, structures, assets, etc. that lie within different flood risk levels. For example, a building that lies within the 2% flood exceedance probability zone would have a 2% chance of flooding occurring in that study year. Stakeholders can then determine if that level of risk is acceptable, or if some action -11-
63 Climate Change Vulnerability, Risk Assessment and Adaptation Study Hingham, MA may be required to improve resiliency, engineer an adaption, consider relocation, or implement an operational plan. Depth of Flooding Maps These maps show the estimated difference between the projected water surface elevation for a given percent risk of flooding during the study year and existing ground elevations derived from the 2011 Northeast LiDAR (Light Detection and Ranging) survey. For this study, two sets of Depth of Flooding Maps were produced: - Depths at 1% Probability of Exceedence which has approximately a 100 year recurrence interval. - Depths at 0.2% Probability of Exceedence which has approximately a 500 year recurrence interval. Depths of flooding maps were also developed for the effects of sea level rise alone, which do not include any effects from storm surge. These maps were developed as bath-tub models by creating a planar water surface consisting of the predicted sea level rise (global SLR plus land subsidence) for the years 2030 and 2070 plus the current Mean Higher High Water (MHHW) elevation. As described above, the total SLR values based on the high scenario used to develop the sea level rise alone maps are as follows: 2030: 0.66 feet 2070: 3.39 feet The following inundation maps are included in Appendix A: A-1: 2030 Percent Risk of Flooding A-2: Percent Risk of Flooding A-3: Present Depth of Flooding at 1% Annual Probability ( 100 year recurrence) A-4: 2030 Depth of Flooding at 1% Annual Probability ( 100 year recurrence) A-5: Depth of Flooding at 1% Annual Probability ( 100 year recurrence) A-6: Present - Depth of Flooding at 0.2% Annual Probability ( 500 year recurrence) A-7: Depth of Flooding at 0.2% Annual Probability ( 500 year recurrence) A-8: Depth of Flooding at 0.2% Annual Probability ( 500 year recurrence) A-9: Depth of Flooding Sea Level Rise Only A-10: Depth of Flooding Sea Level Rise Only 3D Image Renderings Based on the inundation results, three critical roadway intersections were identified to generate 3D image renderings to better visualize the flooding impacts in these areas. For each image, the visualization specialist chose key points, and then collected data for each point s exact location and elevation. The elevation data provided the means for creating a 3D terrain of the landscape in each image. Next, massing models were created for all major objects in the images. A digital camera was aligned to view the same vantage point for each image. Sea level rise was simulated to projected levels for each scene, and then the projected water levels were rendered and the rendering was composited into the original photograph to show the results. -12-
64 Climate Change Vulnerability, Risk Assessment and Adaptation Study Hingham, MA NATURAL RESOURCES MODELING Modeling Impacts to natural resources including beaches, coves and salt marsh, were assessed on a qualitative basis. Woods Hole Group is currently working for the Massachusetts Office of Coastal Zone Management (CZM) to model the effects of sea level rise on coastal wetlands and natural resources statewide. The software Sea Level Rise Affecting Marshes Model (SLAMM) is being used to assess the impacts to natural resources for that project. The SLAMM results are also being linked to results from the Marsh Equilibrium Model (MEM). Final model simulations are currently being run for both subsite and state-wide simulation for four out-year scenarios and four projected sea level rise curves. The results of this statewide project were incorporated into this study. Elevation Information High resolution elevation data are the most important SLAMM model data requirement, since the elevation data demarcate not only where salt water penetration is expected, but also the frequency of inundation for wetlands and marshes when combined with tidal range data. Input elevation data also helps define the lower elevation range for beaches, wetlands and tidal flats, which dictates when they should be converted to a different land-cover type or open water due to an increased frequency of inundation. For this project, LiDAR was acquired from MassGIS. The majority of the state was covered with the 2011 USGS LiDAR for the Northeast project, and this covers the Hingham area. In order to reduce processing time within the SLAMM model, areas of higher elevation within each regional panel that are unlikely to be affected by coastal processes, such as sea level rise, were excluded prior to processing; all areas above an elevation of 60 feet (NAVD88) were clipped from the input files. Wetland Classification Information The 2011 wetland layer developed by the National Wetlands Inventory (NWI) is used as the baseline source for the wetlands input file for marsh migration modeling. Utilizing the NWI data had two key benefits over the 1990s MassDEP wetland layer. First, the NWI data not only provided a more recent dataset, but also matches that of the LiDAR datasets. Although different input years were used, most of the LiDAR data used was collected in or around The second benefit to utilizing the NWI data is that it streamlined the conversion between source wetland categories and SLAMM model wetland codes. The documentation provided with the SLAMM software contains a key to convert each NWI classification to the wetland classification system used by SLAMM. A summary of this conversion key is present in Table B1 included in Appendix B. Sea Level Rise Projections The sea level rise (SLR) projections used in the marsh migration modeling are consistent with those used in the BH-FRM modeling to produce the inundation risk maps. -13-
65 Climate Change Vulnerability, Risk Assessment and Adaptation Study Hingham, MA Additional Data Input Additional model input includes, but is not limited to, accretion rates (marsh, beach, etc.), erosion rates, tidal range and attenuation, freshwater parameters, dikes and dams, and impervious surfaces. For complete details, see the Statewide Modeling: the Effects of Sea Level Rise on Coastal Wetlands for Massachusetts Coastal Zone Management. (ENV 14 CZM 08 in publication, 2015). Impacts to Natural Resources Figures B1 through B3 in Appendix B show the wetland classification areas for 2011, 2030, and 2070 respectively based on the marsh migration modeling. Figure B1 presents the current conditions, as defined by the NWI (with the exception of non-tidal upland swamp). Figure B2 shows the change in wetland classification locations projected to 2030, impacted by SLR. Similarly, Figure B3 shows the change in wetland classification locations projected to 2070 impacted by SLR. Both the results shown in Figures B2 and B3 for 2030 and 2070, respectively, are based on the marsh migration SLAMM modeling. Primary Areas where natural resources are evolving in response to SLR: Broad Cove o By 2030, Broad Cove shows a reduction in transitional marsh, which has been converted to a mix of low and high marsh. Fringing high marsh begins to transition to low marsh and the estuarine open water (subtidal portions of the Cove) has expanded. There is also a relatively significant loss of upland area in the region. o By 2070, there is a major loss of upland area, all existing high marsh has essentially disappeared and has transitioned to low marsh and/or un-vegetated tidal flats. While there is some room for marsh migration, Broad Cove has become a degraded system by Home Meadow - The Home Meadow system shows growth of the Tidal Creeks/ Estuarine Open Waters resources in 2030, and continued expansion by Due to the restricted tidal signal in this region, the existing marsh regions (including low, high, and transitional areas all remain relatively constant through time. Hingham Harbor Shoreline The shoreline shows retreat through 2030, with conversion of beach and upland to open water areas. By 2070, there is a significant loss of shoreline area transitioning to open water resources. There is also the start of some transitional marsh resources in areas that were previously upland. World s End The World s End area, which currently consists of estuarine open water with fringing transitional marsh area, converts to all open water by 2030, and then expands into upland areas and forms un-vegetated tidal flats and some fringing marsh area. Foundry Pond and Lyford Lyking Area These areas, in the northeast corner of Hingham show minor changes by 2030 with slight loss of upland and marsh expansion. By 2070; however, -14-
66 Climate Change Vulnerability, Risk Assessment and Adaptation Study Hingham, MA there is a significant transition of high marsh to low marsh, loss of major upland areas, and connection of various marsh regions along the river. Tidal creeks have also expanded and created a system that is transitioning to open water from marsh. Back River and Beal Cove The areas along the Back River show minimal changes between 2011 and 2030, with the exception of minor shoreline retreat. By 2070, the tidal creeks have expanded and there is loss of upland area and estuarine beach. All high marsh has either transitioned to open water or low marsh in this area. Major changes from 2011 to 2030: Town-wide there is a significant loss of area identified in three major classifications: Loss of approximately 13 acres of irregularly flooded marsh (high marsh). This is loss of high marsh that is transitioning to low marsh, which is not necessarily a problem, at least initially. Loss of approximately acres of upland area. As expected, this loss occurs along the edges of water bodies (in the areas discussed above). Loss of 28 acres of transitional marsh, where marsh is converted to high marsh. Town-wide there is a significant gain of area identified in two major classifications: Gain of approximately 28 acres of regularly flooded marsh (low marsh). Gain of approximately 25 acres of tidal flats. Major changes from 2030 to 2070: Town-wide there is a significant loss of area identified in three major classifications: Loss of approximately 92 additional acres of irregularly flooded marsh (high marsh). This is loss of high marsh that is transitioning to low marsh, which is not necessarily a problem, at least initially. Loss of approximately 70 to 100 additional acres of upland area. As expected, this loss occurs along the edges of water bodies (in the areas discussed above). Loss of 26 acres of estuarine beach. This occurs along the edge of estuaries and results in the expansion of Tidal Creeks. Town-wide there is a significant gain of area identified in three major classifications: Gain of approximately 100 additional acres of regularly flooded marsh (low marsh), a lot of area that was formerly upland has transitioned all the way to low marsh, especially in the Broad Cove region. Gain of approximately 32 additional acres of tidal flats, most occurring in the Broad Cove region. Gain of approximately 38 acres of Tidal Creeks, likely expansion of existing creeks and formation of new creeks. -15-
67 Climate Change Vulnerability, Risk Assessment and Adaptation Study Hingham, MA INFRASTRUCTURE VULNERABILITY ASSESSMENT Scope of Infrastructure Vulnerability Assessment A vulnerability assessment was performed on municipally-owned infrastructure subject to flooding. Municipally-owned infrastructure includes sewer pump stations, roads, bridges, wharves, seawalls, major drainage outfalls, and other critical facilities such as schools, police stations, fire stations, etc. owned and operated by the Town of Hingham. Critical infrastructure was selected based on the inundation modeling results, using infrastructure information obtained from the Town of Hingham Hazard Mitigation Plan Update (2012), and by information provided by various Town departments. Infrastructure that is not municipally owned (e.g. federal, state or privately owned) that is subject to flooding is shown on the maps, but vulnerability assessments are not performed on these assets. In some limited cases, several state-owned roadways, which are critical transportation links in Hingham, are included in the vulnerability assessment. Survey data for both public coastal stabilization structures, including sea walls, revetments and groins, were obtained from Hingham Department of Public Works, as well as the Massachusetts office of Coastal Zone Management (CZM) as part of a report titled Mapping and Analysis of Privately Owned Coastal Structures Along the Massachusetts Shoreline (March, 2013). A risk-based vulnerability assessment was performed for each of the municipally-owned assets impacted by flooding. These assets are built assets and do not include natural resources. The impacts of flooding were assessed for each asset deemed to be susceptible to flooding during any one of the time periods being investigated. The following is a description of the vulnerability assessment methodology for infrastructure. Using Risk to Understand the Vulnerability of Infrastructure Susceptible to Flooding Risk is defined here as the probability of an asset failing times the consequence of that asset failing. Put into mathematical terms: Risk (R) = Probability of Failure (P) x Consequence of Failure (C) or R = P x C For this flood-related vulnerability assessment application, the Probability of Failure (P) is considered as the Percent Risk of Flooding. Each node in the mesh for the ADCIRC model has a unique Probability of Exceedance curve associated with it, which gives the probabilities of exceeding various water elevations at that node. Using risk to assess the vulnerability of infrastructure allows one to take into account both how likely a damaging flood event is, and also, what the consequence of that damaging flood is to the community. Relative risk rankings are an excellent way for helping to prioritize scarce capital funds. -16-
68 Climate Change Vulnerability, Risk Assessment and Adaptation Study Hingham, MA Risk Assessment - A Five Step Process The risk assessment process is implemented using the following five basic steps: 1. Determine Critical Assets Subject to Flooding 2. Determine Critical Elevations 3. Obtain Probability of Exceedance Data 4. Determine Consequence of Failure Score 5. Calculate Risk Scores and Rankings 1. Determine Critical Assets Subject to Flooding All identified municipally-owned infrastructure are located as an overlay in the GIS project map. The Percent Risk map for flooding for 2070 was then used to screen out assets that show no probability of flooding in Any assets that show no probability of flooding are excluded from further analysis, but still remain as reference points on the inundation maps. The following municipally-owned infrastructure assets have been identified in Figures 6, 7 and 8 as being vulnerable to flooding at the indicated time between the present time and 2070: Time Horizon Facility/Building Name Present Heliport at Bathing Beach West Corner Pump Station Hingham Bathing Beach Parking Lot William L. Foster Elementary School Mill St. Pump Station Bel Air Pump Station Broad Cove Sewer Pump Station Whitney Wharf Beal St Sewer Pump Station Downer Ave Sewer Pump Howe St Pump Station Walton Cove Sewer Pump Station Figure 6 - Facilities/Buildings Vulnerable to Flooding -17-
69 Climate Change Vulnerability, Risk Assessment and Adaptation Study Hingham, MA Time Horizon Location Structure Type CZM Coastal Stabilization Structure Number Present Bridge Street Revetment Bridge Street Bulkhead/ Seawall Bridge Street Revetment Bridge Street Groin/ Jetty Broad Cove Entrance Revetment Hingham Shipyard Revetment Hingham Yacht Club Peninsula Bulkhead/ Seawall Hingham Yacht Club Peninsula Bulkhead/ Seawall Hingham Yacht Club Peninsula Revetment Iron Horse Park Area Bulkhead/ Seawall Iron Horse Park Area Bulkhead/ Seawall B-200 Iron Horse Park Area Bulkhead/ Seawall Iron Horse Park Area Bulkhead/ Seawall Iron Horse Park Area Bulkhead/ Seawall Iron Horse Park Area Bulkhead/ Seawall Iron Horse Park Area Bulkhead/ Seawall Iron Horse Park Area Revetment Martin's Well Revetment Martin's Well Bulkhead/ Seawall Walton Cove Bulkhead/ Seawall Hingham Yacht Club Peninsula Bulkhead/ Seawall Hingham Yacht Club Peninsula Revetment Iron Horse Park Area Bulkhead/ Seawall Iron Horse Park Area Bulkhead/ Seawall Iron Horse Park Area Bulkhead/ Seawall B-100 Iron Horse Park Area Bulkhead/ Seawall Stodders Neck Revetment Stodders Neck Revetment Hingham Shipyard Bulkhead/ Seawall Broad Cove Entrance Revetment Broad Cove Entrance Revetment Hingham Shipyard Bulkhead/ Seawall Stodders Neck Revetment Figure 7 Coastal Stabilization Structures Vulnerable to Flooding -18-
70 Climate Change Vulnerability, Risk Assessment and Adaptation Study Hingham, MA Time Horizon Roadway Name(s) Present Rockland St and Kilby St Beach Road and Beach Lane Otis St (Rt 3A) at Hingham Bathing Beach Broad Cove Road (Rt 3A) Downer Ave and Condito Rd Downer Ave and Planters Field Ln Howe St and Parker Dr Summer St (Rt 3A) Rotary North St Eldridge Ct Main St and Winter St Hull St and Rockland St Rockland St and Meadow Rd Lincoln St and Broad Cove Rd Water St Andrews Isle Fresh River Ave Otis St at Walton Cove Wompatuck Rd and Wokomis Rd Blackberry Ln and Park Circle Condito Rd and Langlee Rd Hingham Shipyard Rd Green St George Washington Blvd Bridge (Approach) Tupelo Rd and Langlee Rd Figure 8 Roadways Vulnerable to Flooding 2. Determine Critical Elevations Critical elevations (NAVD88 datum) for each asset that may be subject to flooding at some point were then determined. Critical elevations are defined as that elevation at which flood water will cause the asset to cease to function as intended. For example, the critical elevation may be the first floor of a building. In another case, the critical elevation could be a basement window sill elevation, above which water can enter the basement and damage critical mechanical equipment located in the basement. In another case, the critical elevation could be the bottom of a critical electrical transformer or electrical panel, above which flood water would damage the equipment and shut down the facility. For buildings, pump stations and similar facilities, critical elevations are determined using a variety of data sources, including: -19-
71 Climate Change Vulnerability, Risk Assessment and Adaptation Study Hingham, MA Survey information provided by the Town of Hingham staff. As-built drawings or other similar documents provided by Hingham staff LiDAR survey and aerial photography Critical elevations for roads and bridges are determined using LiDAR survey data. The low points of a roadway section subject to flooding are used as the critical elevation. Critical elevations for bridges are set as the lowest approach road elevations at the ends of the bridge. Critical elevations for coastal stabilization structures are determined using either survey data and asbuilt drawings provided by the Town of Hingham staff or survey elevations included in CZM s Mapping and Analysis of Privately Owned Coastal Structures Along the Massachusetts Shoreline (March, 2013). 3. Obtain Probability of Exceedance Data Probability of Exceedance data for the present, 2030 and 2070 time horizons for each critical infrastructure asset was obtained directly from the BH-FRM ADCIRC model. Data is obtained from the closest mesh node to the asset. A representative example of Probability of Exceedance data from the Mill Street Pump Station is shown in Figure 9. For this facility, the critical elevation is 8.69 NAVD88. This data shows some of the following information: For the present year time frame, the pumping station does not show any probability of flooding. In the 2030 time frame, there is a 5% chance that water will exceed the critical elevation of 8.69 feet, and at a 1% (100 year recurrence interval) the water level could be approximately 1.61 feet above the critical elevation. In the 2070 time frame, the probability of exceeding the 8.69 feet critical elevation increases to 50% while the depth of water above the critical elevation at a 1% (100 year recurrence interval) increases to about 4.11 feet. -20-


72 Climate Change Vulnerability, Risk Assessment and Adaptation Study Hingham, MA Figure 9 Probability of Exceedence Data for Mill Street Pump Station 4. Determine Consequence of Failure Score The Consequence of Failure for each infrastructure asset subject to flooding was rated for six different potential impacts in accordance with the guide shown in Figure 10. Each impact is rated separately and then a composite consequence of failure score is determined by summing the scores and normalizing to 100 using the following equation: Composite Consequence of Failure Score = all six ratings x Figure 11 shows a representative example of the Consequence of Failure rating for the Mill Street Pump Station with a total rating of 63 out of a possible 100. The higher the rating, the higher the consequence of failure of the asset. Figure 10 Consequence of Failure Rating Guide -21-

73 Climate Change Vulnerability, Risk Assessment and Adaptation Study Hingham, MA Figure 11 Consequence of Failure Scoring Example for Mill Street Pump Station 5. Calculate Risk Scores and Rankings The risk score for an infrastructure asset subject to flooding for a given time horizon was calculated using the following equation: Where: Rtn = Ptn x Ctn R tn = Risk Score at a given time horizon P tn = Probability of Exceedence at a given time horizon C tn = Consequence of Failure rating at a given time horizon tn = Time horizon n (present, 2030 or 2070) This risk score can be used to rank an asset s vulnerability to flooding for a given time horizon. A composite ranking can also be developed taking into account the rankings from all time horizons using the following equation: Rcomp = (Rpresent x Wpresent) + (R2030 x W2030) + (R2070 x W2070) Where: R comp = Composite risk score for all time horizons R Present = Risk score for present day time horizon R 2030 = Risk score for 2030 time horizon R 2070 = Risk score for 2070 time horizon W Present, W 2030 W 2070 = Weighting factors for each respective time horizon A weighting factor is used to give more emphasis to assets vulnerable to flooding in the nearer time horizons. For example, a facility which is susceptible to flooding today and more flooding in the future, should get more priority than a facility that is only vulnerable to flooding starting in The weighting factors can be adjusted, but for the purposes of this study the following factors were selected: W Present = 50% ( or 0.50) W 2030 = 30% ( or 0.30) W 2070 = 20% ( or 0.20) 100% -22-

74 Climate Change Vulnerability, Risk Assessment and Adaptation Study Hingham, MA An Excel spreadsheet was developed which incorporated the Probability of Exceedance data, Consequence of Failure scores and the Risk formulas to automate the ranking process. An example of the Risk Scoring for the Mill Street Pump Station is shown in Figure 12. Figure 12 - Risk Scoring Example Matrix for Mill Street Pump Station (Note - Multiplication not exact due to round-off of Consequence Score) Note that the Consequence of Failure score remains constant for an asset over the life of the asset, and that only the Probabilities of Flooding change over time. The only instance where the Consequence of Failure score would change is if some known changes can be anticipated in the future, such as construction of a redundant facility, which would make failure of the asset in question less consequential. For the purposes of this study, we have not anticipated any future changes that would change the Consequence of Failure scores. Vulnerability Assessment Results Using the risk-based ranking methodology described above, the top 20 ranked assets in terms of vulnerability to flooding based on composite scores are shown in Figure 13. The top 20 ranked assets in terms of vulnerability to flooding based on risk scores for the present day time horizon are shown in Figure 14. The top 20 ranked assets in terms of vulnerability to flooding based on risk scores for the 2030 time horizon are shown in Figure 15. The top 20 ranked assets in terms of vulnerability to flooding based on risk scores for the 2070 time horizon are shown in Figure
75 Climate Change Vulnerability, Risk Assessment and Adaptation Study Hingham, MA Asset Name Type Consequence Score Present Probability (%) 2030 Probability (%) 2070 Probability (%) Composite Risk Score Walton Cove Iron Horse Park Area Iron Horse Park Area B-200 Bridge Street Iron Horse Park Area Iron Horse Park Area Bridge Street Bridge Street William L. Foster Elementary School Iron Horse Park Area Iron Horse Park Area Bulkhead/ Seawall Bulkhead/ Seawall Bulkhead/ Seawall Revetment Bulkhead/ Seawall Bulkhead/ Seawall Bulkhead/ Seawall Revetment Facility Bulkhead/ Seawall Bulkhead/ Seawall Rockland St and Kilby St Roadway Otis St (Rt 3A) at Hingham Bathing Beach Roadway Martin's Well Revetment Bridge Street Groin/ Jetty Iron Horse Park Area Bulkhead/ Seawall Broad Cove Entrance Revetment West Corner Pump Station Facility Broad Cove Rd (Rt 3A) Roadway Beach Rd and Beach Ln Roadway Figure 13 Top 20 Ranked Infrastructure Assets Vulnerable to Flooding, Ranked by Composite Risk Score (Note Multiplication not exact due to round-off of Consequence Score) -24-
76 Climate Change Vulnerability, Risk Assessment and Adaptation Study Hingham, MA Asset Name Type Consequence Score 2030 Probability (%) 2030 Risk Score Walton Cove Iron Horse Park Area Iron Horse Park Area B-200 Bridge Street Iron Horse Park Area Iron Horse Park Area Bridge Street Bridge Street Bulkhead/Seawall Bulkhead/Seawall Bulkhead/Seawall Revetment Bulkhead/Seawall Bulkhead/Seawall Bulkhead/Seawall Revetment Rockland St and Kilby St Roadway Iron Horse Park Area Martin's Well Bridge Street Bulkhead/Seawall Revetment Groin/Jetty Beach Rd and Beach Ln Roadway Martin's Well Hingham Yacht Club Peninsula William L Foster Elementary School Iron Horse Park Area Otis St (Rt 3A) at Hingham Bathing Beach Iron Horse Park Area Broad Cove Entrance Bulkhead/Seawall Bulkhead/Seawall Facility Bulkhead/Seawall Roadway Bulkhead/Seawall Revetment Figure 15 Top 20 Ranked Infrastructure Assets Vulnerable to Flooding, Ranked by 2030 Risk Scores(Note Multiplication not exact due to round-off of Consequence Score) -26-
77 Climate Change Vulnerability, Risk Assessment and Adaptation Study Hingham, MA Name/Number Type Consequence Score 2070 Probability (%) 2070 Risk Score William L Foster Elementary School Iron Horse Park Area Iron Horse Park Area Iron Horse Park Area Iron Horse Park Area B-200 Bridge Street Bridge Street Bridge Street Otis St (Rt 3A) at Hingham Bathing Beach Iron Horse Park Area Facility Bulkhead/Seawall Bulkhead/Seawall Bulkhead/Seawall Bulkhead/Seawall Revetment Bulkhead/Seawall Revetment Roadway Bulkhead/Seawall West Corner Pump Station Facility Broad Cove Entrance Revetment Broad Cove Rd (Rt 3A) Roadway Hingham Bathing Beach Parking Lot Facility Iron Horse Park Area Bulkhead/Seawall Walton Cove Bulkhead/Seawall Hingham Yacht Club Peninsula Bulkhead/Seawall Iron Horse Park Area Bulkhead/Seawall Beach Rd and Beach Ln Roadway Martin's Well Bulkhead/Seawall Figure 16 Top 20 Ranked Infrastructure Assets Vulnerable to Flooding, Ranked by 2070 Risk Scores (Note Multiplication not exact due to round-off of Consequence Score) -27-
78 Climate Change Vulnerability, Risk Assessment and Adaptation Study Hingham, MA ADAPTATION STRATEGIES General There are three general approaches for adapting to the long-term effects of flooding due to sea level rise and storm surge from extreme weather events: Protection Accommodation Retreat Protection - Protection includes adaptation strategies that try to prevent damage to essential infrastructure by creating a barrier between the flood water and the infrastructure being protected. Sea walls, dikes, bulkheads, levees, revetments, flood gates, temporary flood protection barriers, and hurricane barriers are all examples of protection strategies that aim to prevent water from reaching sensitive areas. To be truly effective over the long term, many of these types of structures need to be massive to withstand the forces of the sea and can be costly and difficult to get permitted under our current regulatory system. Infrastructure outside of these structures is left unprotected. Accommodation - Accommodation adaptation strategies allow flood waters to reach essential infrastructure, but damage to the infrastructure is minimized and controlled. Accommodation strategies acknowledge that structures and infrastructure will be exposed to flood water and will get wet, but actions are taken to minimize potential damage. Examples of accommodation adaptation strategies include raising structures above flood elevations, constructing sacrificial dunes and structures that are designed to absorb the impact of large storms to prevent major damage to infrastructure behind them with the understanding that they will need repair or replacement if destroyed, protecting utilities in waterproof enclosures; flood-proofing structures, instituting new building codes and zoning, such as increased setbacks, that require accommodation strategies to be implemented for all new construction and major renovation projects. Retreat - Retreat adaptation strategies recognize the fact that in some areas it may be too costly, technically not feasible, or politically unrealistic to prevent damage from rising sea levels and storm surge, and that the best strategy is to remove the structures and infrastructure from harm s way. Retreat strategies relocate affected infrastructure away from the ocean to higher ground and transform the affected areas back to natural barriers which can migrate landward naturally. Examples of retreat adaptation strategies include property buyouts, relocation of roads, buildings and infrastructure, and implementation of new zoning or other regulations limiting new construction, reconstruction, or expansion of existing structures. Adaptation strategies investigated in this study are a combination of protection and accommodation strategies. In the Town of Hingham, true retreat strategies do not appear to be warranted or will likely not be politically feasible given the extent of expected inundation by However, retreat strategies may become more important by 2100 if sea levels continue to rise as currently predicted. Recommended Base Flood Elevations Prior to developing adaptation strategies, it is important to select a base flood elevation that will be the level to which a structure or infrastructure asset is adapted to. -28-

.")
79 Climate Change Vulnerability, Risk Assessment and Adaptation Study Hingham, MA Figure 17 shows representative flood elevations at different probabilities of exceedance for present, 2030 and 2070 time horizons. These flood elevations do not include additional height for wave run-up, nor do they include freeboard - height often added above the expected flood level for additional safety. For the purposes of this study, we have based recommended adaptation options on a base flood elevation equivalent to the 0.2% probability of exceedance flood levels in 2030 and 2070 (approximately 500 year recurrence interval). This decision reflects the high criticality of the facilities in question and sets a relatively conservative design parameter from which to begin planning. These recommendations should periodically be reviewed (e.g., once every five to ten years) and adjusted as needed based on the latest climate change science and sea level rise observations and projections. Selecting a conservative base flood elevation can have an impact on the feasibility and cost of adaptation strategies, especially if planning for the longer term (i.e., 2070). In 2030, the difference between the 1% and 0.2% events is only 0.2 feet. However, in 2070, the difference between the 1% event (12.8 ft) and the 0.2% event (14.0 ft.) is much greater at 1.2 ft. In addition, the 0.2% event in 2070 is 3.8 ft. higher than the % event, whereas the 1% event in 2070 is only 2.8 ft. higher than the 1% event in Higher base flood elevations introduce more significant design challenges and costs to modify what exists today in vulnerable areas. Recommended Base Flood Elevations Figure 17 Water Levels at Different Probabilities of Exceedance for Present, 2030 and
80 Climate Change Vulnerability, Risk Assessment and Adaptation Study Hingham, MA $15,000,000. The 5,000 ft. wall length does not include Kimball s Wharf which is privately owned. The length of seawall along Kimball Wharf is approximately 450 ft. The cost range to raise and replace the Kimball s Wharf seawall would be approximately $450,000 to $1,3500,000. Lincoln Street/Bridge Street/Route 3A Bridge Recommended Base Flood Elevation for 2030: 10.6 ft NAVD88 Recommended Base Flood Elevation for 2070: 14.1 ft NAVD88 The seawalls and revetments located around the base of the Lincoln Street/Bridge Street/Route 3A Bridge are in relatively good condition, according to CZM (2013). Despite the relatively high probability of flood waters exceeding the heights of these structures and the significant consequences for mobility if the bridge itself were to fail, neither the bridge nor the roadway approach are predicted to be exceeded by flood waters, even under the 0.2% event in Recommendation: (Present) Continue monitoring structures for condition and scour, which could be worsened by more frequent and extreme flooding events. (2030) Carry out regular maintenance as needed over the lifetime of the structures. (2070) During next bridge replacement, design all associated structures according to the 2070 base flood elevation plus appropriate wave run-up and freeboard, taking into account their longterm design life. Walton Cove The dilapidated seawall structure at Walton Cove has not been in service for some time. The Town has indicated that this it is unlikely to be restored to service and may eventually be removed. Recommendation: No adaptation is recommended. Facilities/Buildings William L. Foster Elementary School Recommended Design Flood Elevation for 2030: 10 ft NAVD88 Recommended Design Flood Elevation for 2070: 14 ft NAVD88 The Foster School is located at the northwest corner of the Broad Cove wetland. The parking lot on the south side of the school, directly adjacent to the wetlands, ranges in elevation from approximately 5.5 ft -32-

.")
81 Climate Change Vulnerability, Risk Assessment and Adaptation Study Hingham, MA NAVD88 to 6.5 ft NAVD88. Flooding at the school from sea level rise and storm surge would emanate from the Broad Cove wetland, pass across the parking lot, and flow down a small staircase that leads from the parking lot down to the HVAC crawl space below the building. If flood levels were higher, they could enter the crawl space through vents in the building exterior close to the ground. The first floor of the school building is about 2 ft. higher in elevation than the parking lot, but in the 2030, the 0.2% flood water would inundate the first floor (Figure 20). While it is unlikely that the school grounds will experience flooding from sea level rise and storm surge in the present time frame due to tidal attenuation at the Broad Cove culvert, by 2030 projections show water overtopping Route 3A at the Broad Cove entrance putting the Foster School at greater risk of flooding. By 2070, sea level rise alone could cause daily flooding of the parking lot and sports facilities at high tide (Figure 21). Figure 20 - Foster Elementary School Elevation and Flood Risk (SLR and Storm Surge) Figure 21 - Depth of Flooding at High Tide in 2030 and 2070 at Foster Elementary School with Highest SLR -33-

 (2030) Replace metal railings around HVAC crawl space staircase with concrete enclosure walls to 10 ft NAVD88.")
 (2030) Build concrete enclosures to 10 ft NAVD88 around vents to prevent water from entering HVAC crawl space.")
 (2070) Design, permit and construct perimeter flood protection barrier system to 14 ft NAVD88, using retaining walls and/or levees.")
82 Climate Change Vulnerability, Risk Assessment and Adaptation Study Hingham, MA Recommendation: (Present) Develop an emergency student relocation plan for the scenario that the school is flooded and unable to be occupied for an extended period of time. (2030) Install a high level water alarm and sump pump system tied to an emergency generator to allow for monitoring of and pumping out of any water that leaks into the crawl space. (Approximate cost = $10,000) (2030) Replace metal railings around HVAC crawl space staircase with concrete enclosure walls to 10 ft NAVD88. Add drop-in flood panel at opening to staircase prior to storm events to prevent water from entering HVAC crawl space. (Approximate cost = $10,000) (2030) Build concrete enclosures to 10 ft NAVD88 around vents to prevent water from entering HVAC crawl space. (Approximate cost = $15,000) (2030) Install drop-in flood panels at vulnerable doorways. (Approximate cost = $15,000) (2030) Seal or install shut-off valves for other conduits for water entry. (Approximate cost = $5,000) (2070) Design, permit and construct perimeter flood protection barrier system to 14 ft NAVD88, using retaining walls and/or levees. (Approximate cost = $820,000) Drop-in flood panels such as shown here for illustration can be installed at existing doors. Enclosures such as shown here for illustration can be built around the vents. Figure 22 - Foster School Adaptation Options for 2030 Alternative Recommendations: By raising Route 3A at the Broad Cover culvert and installing a tide gate control as described later in the roadway adaptation section, the flooding at the Foster School can be eliminated and the adaption measures described above would not be required. -34-

83 Climate Change Vulnerability, Risk Assessment and Adaptation Study Hingham, MA well are located on a sufficiently elevated area so as to be protected from the 0.2% coastal flood in However, by 2070 it becomes significantly more vulnerable to flooding. Figure 26 - Bel Air Pump Station Recommendation: (2070) Construct a low flood wall inside the perimeter fence with a temporary access closure for drop-in flood panels at the gate. (Approximate cost = $120,000) (2070) Seal interior conduits for water entry (e.g., through-floor/wall pipes, utility conduits) to 14.0 ft NAVD88. (Approximate cost = $2,000) (2070) Purchase portable fuel-powered pumping system. (Approximate cost = $2,000) Roadways Route 3A/Otis Street/Summer Street Recommended Design Flood Elevation for 2030: 10.2 ft NAVD88 Recommended Design Flood Elevation for 2070: 14 ft NAVD88 In the 2030 time horizon and beyond, sections of Route 3A in Hingham are at relatively high risk of flooding, including at the entrance to Broad Cove, at Hingham Bathing Beach, between North Street and Water Street, and at the Rotary (Figure 27). In addition to the negative impacts for mobility, the flooding of these roadway sections would have significant impact on public and private infrastructure located on the landward side of Route 3A. If Route 3A is exceeded at the Broad Cove entrance, for example, the following assets could be flooded (Figure 28): Broad Cove Road, Downer Ave, and Lincoln Street Foster Elementary School and Derby Academy Broad Cove Sewer Pump Station -38-