2002 Water Quality Monitoring Report
|
|
|
- Janis Bishop
- 5 years ago
- Views:
Transcription
1 22 Water Quality Monitoring Report Wenck File #2-49 Prepared for: CLEARWATER RIVER WATERSHED DISTRICT Box 276 Annandale, MN Prepared by: WENCK ASSOCIATES, INC. 18 Pioneer Creek Center P.O. Box 249 Maple Plain, Minnesota (763) January 23 Wenck
2 Table of Contents 1. INTRODUCTION PRECIPITATION STREAMS Runoff Total Phosphorus Fecal Coliform ANNANDALE AREA WATER QUALITY WATER QUALITY OF LAKES SAMPLED IN YEAR Lake Augusta Lake Betsy Lake Caroline Clearwater Lake Henshaw Lake Lake Marie Little Mud Lake Scott Lake Union Lake Weigand Lake CONCLUSIONS RECOMMENDATIONS T:\2\49\22 Report\WaterQualityMonitoringReport.doc i
3 Table of Contents (Cont.) TABLES 1 Yearly Precipitation and Runoff Totals 2 Historical Summary of Stream Flows, Phosphorus Concentrations, and Loadings FIGURES 1 22 Regular Stream and Lake Monitoring Locations 2 22 Precipitation Data of Annandale Station and Annual Highs 3 22 Precipitation Data of Watkins Station and Annual Highs 4 22 Precipitation Data of Kimball Station and Annual Highs 5 22 Upper Watershed Monitoring Results 6 22 Middle Watershed Monitoring Results 7 22 Warner Creek Area Monitoring Results 8 22 Annandale Area Sampling Results and Historical Pleasant Lake Data 9 22 Graphical Summary of Lake Water Quality 1 Lake Augusta Historical Data 11 Lake Betsy Historical Data 12 Lake Caroline Historical Data 13 Clearwater Lake West Historical Data 14 Clearwater Lake East Historical Data 15 Henshaw Lake Historical Data 16 Lake Marie Historical Data 17 Little Mud Lake Historical Data 18 Lake Scott Historical Data 19 Union Lake Historical Data 2 Weigand Lake Historical Data APPENDICES A 22 Monitoring Plan Summary B Citizen s Lake Monitoring Program Secchi Data C 22 Water Quality Laboratory Reports and Data T:\2\49\22 Report\WaterQualityMonitoringReport.doc ii
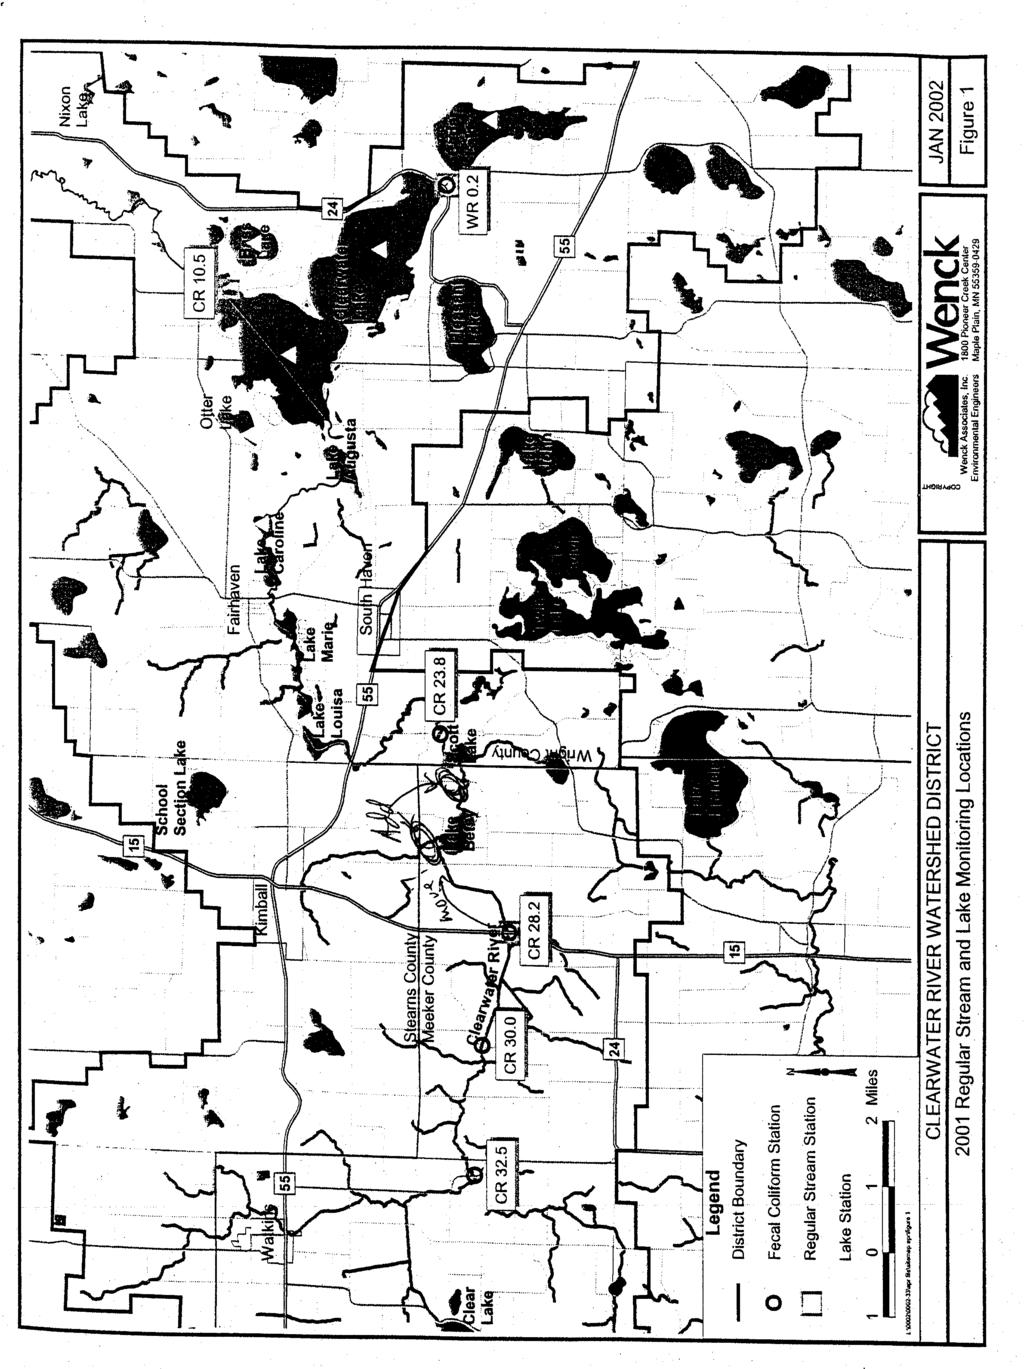
4 1. Introduction The Clearwater River Watershed District has conducted a stream, precipitation and lake monitoring program since 198. The monitoring program has focused on collecting baseline data to provide long-term analysis of water quality within the District. The base line monitoring consists of monitoring the Clearwater River, Warner Creek, and lakes on a rotating schedule. In recent years the program has expanded to include additional monitoring for fecal coliform bacteria and phosphorus on more Clearwater River sites and tributaries. In 22 the Clearwater River was monitored at two locations (CR-28.2 and CR-1.5). Warner Creek was monitored near its inflow to Clearwater Lake at WR-.2. Forty-seven sites in the watershed were monitored for fecal coliform bacteria; the lakes monitored were Clearwater (East and West basins), Augusta, Betsy, Caroline, Henshaw, Little Mud, Marie, Scott, Union and Weigand. Citizen volunteers collect precipitation data from three stations and Secchi depths for numerous lakes. Figure 1 shows the baseline monitoring locations and Appendix A gives the monitoring plan. T:\2\49\22 Report\WaterQualityMonitoringReport.doc-rlb 1-1
5 2. Precipitation Precipitation was above or near historical highs in 22. Flooding due to both short, intense storms, and long periods of inundation was experienced in the watershed. Figures 2, 3, and 4, show the volunteer precipitation records for the CRWD. The Annandale station recorded inches for the year, the Watkins station recorded 37.5 inches, and the Kimball station recorded 4.27 inches. The volunteer stations annual totals were compared to annual highs for three nearby precipitation stations-- Cokato, Litchfield, and St. Cloud-- in the Midwestern Regional Climate Center (MRCC) database. The MRCC is a program of the National Climatic Data Center (National Oceanic and Atmospheric Administration, U.S. Department of Commerce). The annual highs are given on each figure, and show Litchfield at inches in 1965, Cokato at 4.78 inches in 1991, and St. Cloud at 41.1 inches in The longest periods of record were for the Litchfield (1887 to 21) and St. Cloud (1893 to 21) stations, and Cokato has a record from 1971 to 2. The Annandale volunteer station annual total exceeded the annual highs for all three MRCC stations, the Kimball station exceeded the Litchfield annual high, and the Watkins station was below the annual highs. Rainfall during the summer months was especially high, but November and December were actually quite dry. T:\2\49\22 Report\WaterQualityMonitoringReport.doc-rlb 2-1
6 3. Streams 3.1 RUNOFF The average stream flow at the outlet of Clearwater Lake (station CR-1.5) was about 87 cubic feet per second in 22. This flow rate was equivalent to 7.6 inches of runoff from the 155- square mile watershed. The lake outflow remained high well into the fall as a result of very high rainfall through the summer months. 3.2 TOTAL PHOSPHORUS Baseline Monitoring: Baseline phosphorus levels in the Clearwater River remain low, especially as compared with conditions monitored in the early 198s. The most upstream station, station CR-28.2 had flowweighted mean total phosphorus concentration of.291 mg/l (milligrams per liter, or parts per million). Historically this has ranged from.74 to 1.4 mg/l in the early 198s. Sites WR-.2 and CR-1.5 had very low flow-weighted mean concentrations of.114 mg/l and.38 mg/l, respectively. The phosphorus loadings were 9,46 pounds at CR-28.2, and 2,6 and 6,5 pounds, respectively, at WR-.2 and CR-1.5. Soluble reactive phosphorus (dissolved form of phosphorus utilized by algae) was also monitored and represents 62%, 12.5%, and 11.3 % of the total phosphorus value at the three stations CR-28.2, WR-.2 and CR-1.5 respectively. The higher value at CR-28.2 may be indicative of agricultural sources. The low percentage (12.5%) at WR-.2 is an indicator that the wetlands upstream of this sampling point are assimilating phosphorus successfully. T:\2\49\22 Report\WaterQualityMonitoringReport.doc-rlb 3-1
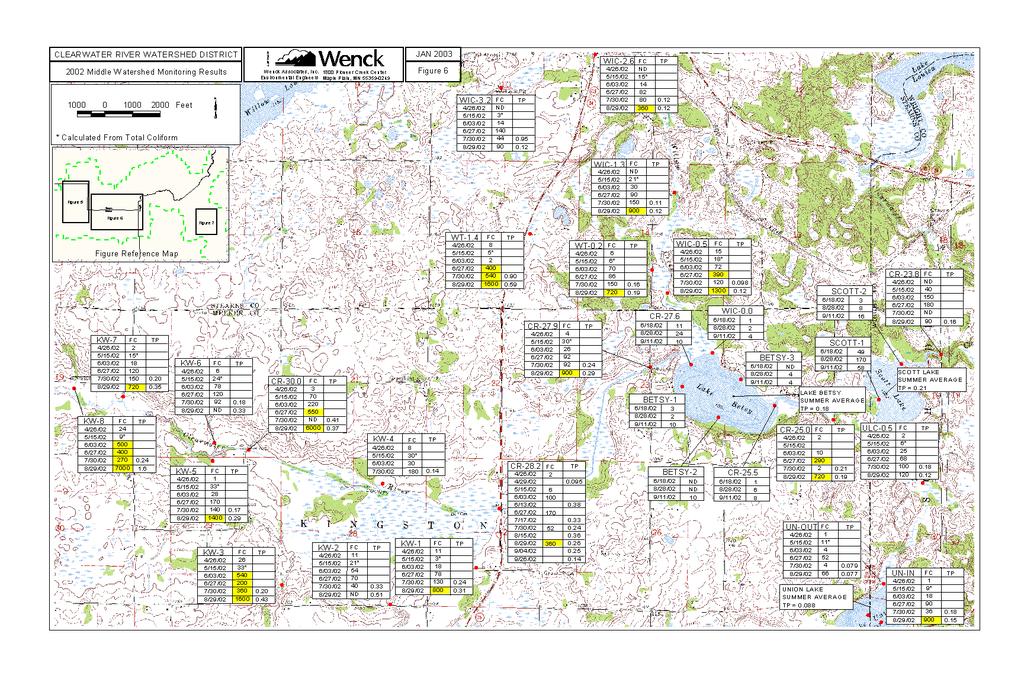
7 Special Monitoring: Results of special phosphorus monitoring are shown on Figures 5, 6 and 7. Upper Watershed: Phosphorus values were elevated at 9 of the 1 sites monitored, with WAT-8 being the only site with both values below.25 mg/l. Phosphorus concentrations are an issue for the Upper Watershed. Middle Watershed: Phosphorus values decreased as the sample location moved downstream along the Clearwater River. From CR-3. to CR-28.2 to CR-27.6 to CR-25. to CR-23.8 phosphorus values decreased except for one sample (CR-27.9 was slightly (.3 mg/l) greater than CR-28.2 in August). Above State Highway 15, tributaries off of the Clearwater River, except for KW-4 had elevated phosphorus levels. This includes seven of the eight Kingston wetland tributaries. The Willow Creek stations had low levels of phosphorus except for WIC-3.2 (July sample at.95 mg/l) and WT-1.4 (July sample of.9 mg/l and August sample of.59 mg/l). Warner Creek: The west branch of Warner Creek that drains Annandale had elevated concentrations except for WC-1 (water from south of Highway 55). The water quality degrades from State Highway 55 to the site near the Wastewater Treatment Plant (WC-3), and the degradation is not only from runoff from the WWTP, although the pipe outlet from the Wastewater Treatment Plant had elevated values (WC-3A). Water quality improves downstream of the CRWD Annandale Wetland Treatment Project (WC-4). 3.3 FECAL COLIFORM The state standard of 2 colony-forming units per 1 milliliters is used as a benchmark for coliform contamination in the District. T:\2\49\22 Report\WaterQualityMonitoringReport.doc-rlb 3-2
8 Upper Watershed: Results on Figure 5 show that for the six fecal coliform monitoring events, each site except for CL-3 had at least one value greater than 2 colony forming units per 1 milliliters (cfu/1 ml). Seasonal effects are also noticeable, in that no values greater than 2 cfu/1 ml were found during the April and May events. Therefore bacteria contamination is an issue throughout the Upper Watershed after June. Middle Watershed: Thirty sites were monitored in the Middle Watershed. Twelve of the sites had no values greater than 2 cfu/1 ml. Eleven of these twelve sites were around lakes Betsy, Scott, and Union. Therefore, fecal coliform contamination is less of an issue near or in these lakes. Upstream of State Highway 15, nine of the ten sites had values above 2 ml. Therefore, fecal contamination is an issue above Highway 15. Warner Creek: Concentrations above the 2 cfu/1 ml benchmark were detected at six of the eight stations. Five of the six stations had two exceedances, and concentrations above 1, cfu occurred at WC-3, WC-3A and WC-6. Stations WC-3 and WC-3A are near the City of Annandale Wastewater Treatment Plant, and WC-6 is at the outlet of Cedar Lake. Fecal coliform contamination remains an issue for the Warner Creek watershed. T:\2\49\22 Report\WaterQualityMonitoringReport.doc-rlb 3-3
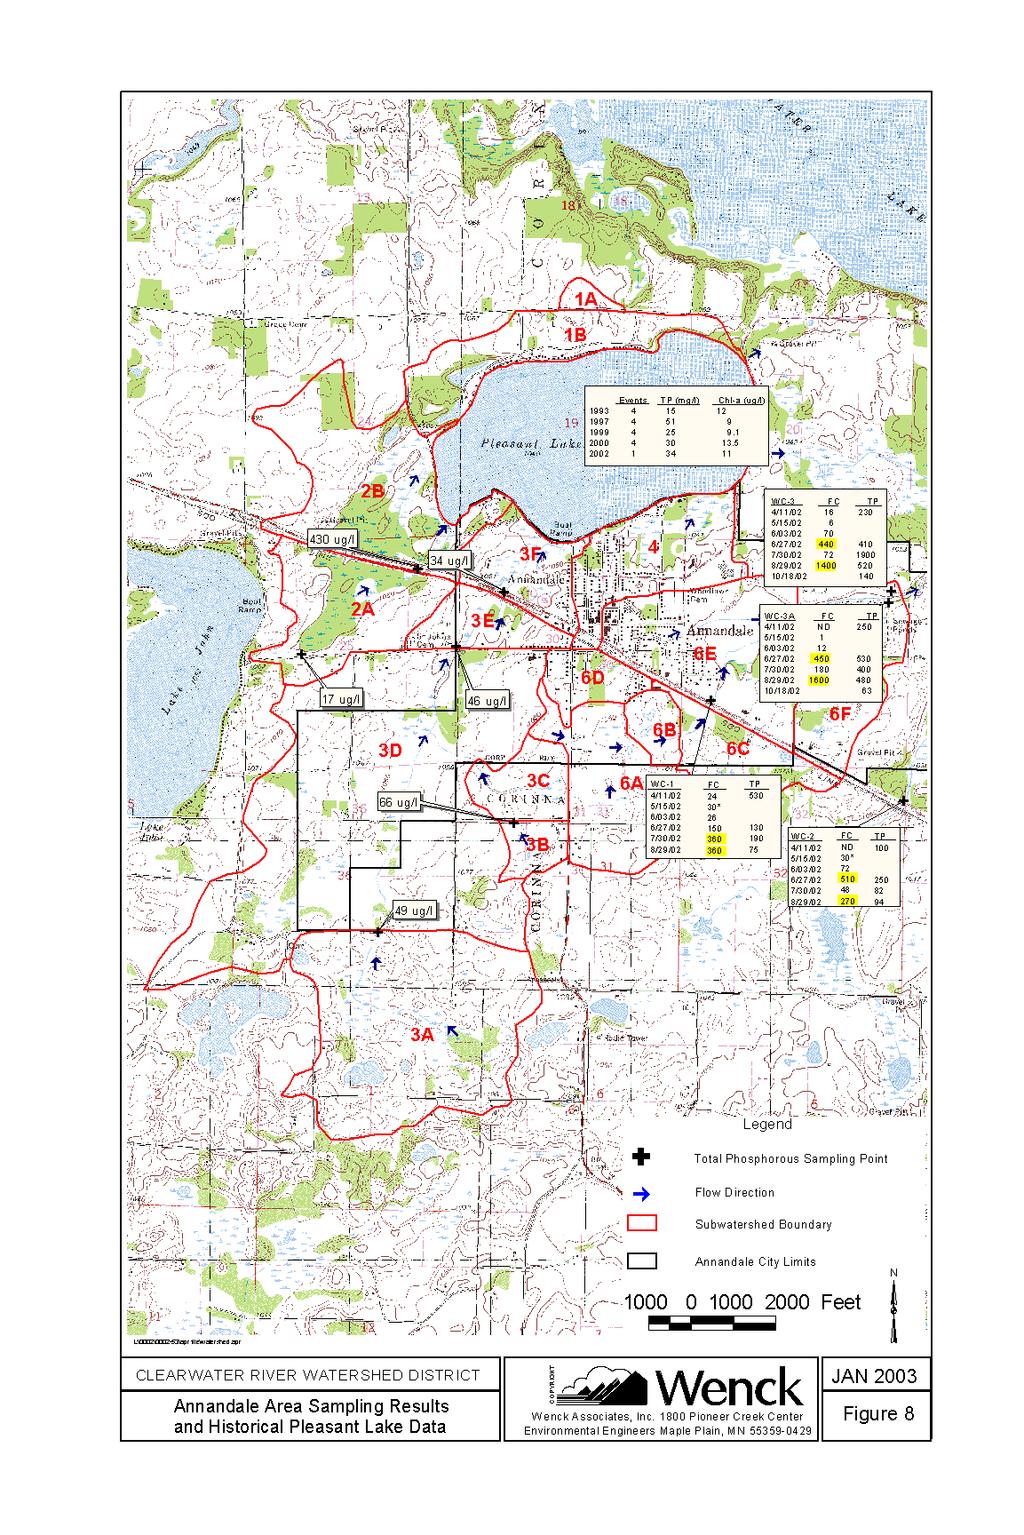
9 4. Annandale Area Water Quality A CRWD cooperative Annandale Area Stormwater Study was conducted in 22 with the City of Annandale and Pleasant Lake Improvement Association. The project consisted of modeling, determining sensitive areas for flooding and water quality, determining green space planning areas for the city, and one grab sampling event. Water quality results are shown on Figure 8. Results for samples taken within the Pleasant Lake watershed, in Subwatersheds 2 and 3, were relatively low except for Subwatershed 2A which had a value of.43 mg/l. Results for the Clearwater Lake Subwatershed (Subwatershed 6) were relatively high. Water quality degrades as it travels from WC-1 through an urbanized area to WC-3 (except for the April 11 event). The cooperative study concluded that several opportunities exist (Subwatershed 6C, 6D and 4) for water quality improvement projects in the Annandale area. T:\2\49\22 Report\WaterQualityMonitoringReport.doc-rlb 4-1
10 5. Water Quality of Lakes Sampled in Year 22 Ten lakes were sampled in 22. Figure 9 displays summer average total phosphorus concentration, chlorophyll-a concentration, and Secchi depth (water clarity, or transparency) for these lakes. Appendix B presents the Citizen s Lake Monitoring Program Secchi Data. Appendix C presents the 22 Water Quality Laboratory Reports and Data. Each lake is discussed below. 5.1 LAKE AUGUSTA Lake Augusta s water quality was good in 22. The clarity of Augusta (Figure 1) was 6.2 ft in 22. This lake was monitored by the Wright SWCD and early season readings were 19.5 feet in May and 16 feet in June (not included in above average). Phosphorus was the highest (84.3 µg/l) since 199, however, chlorophyll-a remained at moderate levels, averaging 13.5 µg/l. 5.2 LAKE BETSY Lake Betsy s water quality was poor. In most years, the Secchi depth is between 2 and 4 feet (Figure 11), and in 22 it was within this range at 3. feet. Phosphorus was the second lowest in the lake s sampling record (18 µg/l); however, chlorophyll-a was the third highest value (91.9 µg/l). T:\2\49\22 Report\WaterQualityMonitoringReport.doc-rlb 5-1
11 5.3 LAKE CAROLINE Water quality in Lake Caroline was fair. Phosphorus increased in 22 to 95 µg/l, the highest value since 1987 (Figure 12). Chlorophyll-a (45 µg/l) and Secchi depth (5.1 feet) have remained steady since 1994, with chlorophyll-a being between 36 and 55 µg/l for eight of eleven years. Secchi has been between three and five feet for seven of eleven years. In 22, chlorophyll-a was within the typical range and Secchi was slightly greater at 5.1 feet. 5.4 CLEARWATER LAKE Clearwater Lake is sampled in both the West and East basins every year as part of the long-term monitoring plan. Data for 22 showed good water quality for both basins. Clearwater West: Secchi remained good at 6.3 feet and phosphorus remains similar to values since 1993 at 42 µg/l (Figure 13). Chlorophyll-a increased significantly as compared to the last few years (18. µg/l). Clearwater East: The east bay (Figure 14) had similar characteristics as the west bay an increase in chlorophylla (to 14 µg/l), and phosphorus (36 mg/l) and Secchi (5.9 feet) values similar to recent years. 5.5 HENSHAW LAKE Historical data for Henshaw Lake dates back to 1995 (Figure 15). Water quality in 22 was poor, with low clarity of 2.3 feet, high phosphorus of 21 µg/l, and high chlorophyll-a at 13 µg/l. T:\2\49\22 Report\WaterQualityMonitoringReport.doc-rlb 5-2
12 5.6 LAKE MARIE Water quality of Lake Marie was fair (Figure 16), with chlorophyll-a (37 µg/l) and Secchi (4. feet) typical of recent years. However, phosphorus was at a historical low concentration of 7 µg/l. 5.7 LITTLE MUD LAKE Little Mud Lake (Figure 17) has been sampled in only three years (1995, 1999 and 22). Secchi was lower than previous years (4.6 feet), total phosphorus (49 µg/l) was slightly lower than previous years, and chlorophyll-a (21 µg/l) was near the average of previous years. Overall, Little Mud Lake s water quality was fair. 5.8 SCOTT LAKE Clarity was low in Scott Lake (2.4 feet on Figure 18), and total phosphorus remained high (21 µg/l), though it continues to decline. Chlorophyll-a was also high at 13 µg/l. Overall, water quality was poor. 5.9 UNION LAKE Water quality in Union Lake was poor in 22 (Figure 19). Secchi decreased to 3.3 feet and phosphorus (88 µg/l) and chlorophyll-a (39 µg/l) increased dramatically relative to levels in T:\2\49\22 Report\WaterQualityMonitoringReport.doc-rlb 5-3
13 5.1 WEIGAND LAKE Weigand Lake s water quality was very good in 22, with a very high clarity at 1. feet and low phosphorus (37 µg/l) and chlorophyll-a (5.3 µg/l) concentrations. T:\2\49\22 Report\WaterQualityMonitoringReport.doc-rlb 5-4
14 6. Conclusions 1. Precipitation for the year was high, inches, which is 155% of normal at the Annandale Station. 2. The high precipitation resulted in extremely wet conditions with 7.6 inches of runoff. 3. The Clearwater River phosphorus load was about 9,46 pounds at CR-28.2, similar to 21 but significantly higher than previous years due to the high precipitation. 4. Fecal coliform bacteria were found at levels of concern in Clearwater River and Warner Creek. These findings confirm the 2 and 21 fecal coliform monitoring results. 5. The water quality of Weigand Lake was very good, while Lake Augusta and Clearwater Lake continued to be good. Caroline s, Marie s, and Little Mud Lake s water quality was fair; but Betsy s, Henshaw s, Scott s, and Union s water quality was poor. 6. The Annandale Area Stormwater Study performed jointly with the City of Annandale and Pleasant Lake Improvement Association confirmed some areas of concern and identified opportunities for water quality improvement projects. T:\2\49\22 Report\WaterQualityMonitoringReport.doc-rlb 6-1
15 7. Recommendations 1. Continue the District s water quality and hydrologic monitoring program. 2. Consider using genetic identification methods to investigate the sources of fecal coliform bacteria in the District, and evaluate bacteria control methods. 3. Continue pursuing methods to improve the water quality of the District lakes. 4. Pursue a Total Maximum Daily Load (TMDL) grant from the Minnesota Pollution Control Agency (MPCA) to develop a plan to address the impaired waters of the District. 5. Consider a groundwater monitoring or data collection program since fecal coliform is prevalent throughout the District and may indicate a public health concern. 6. Consider Stormwater Studies around the areas of Watkins and Kimball to identify opportunities for water quality improvement projects. 7. Consider enhanced phosphorus reduction methods upstream of Lake Betsy and Scott Lake to reduce phosphorus loads to the Chain of Lakes. T:\2\49\22 Report\WaterQualityMonitoringReport.doc 7-1
16 Tables
17 TABLE 1 YEARLY PRECIPITATION AND RUNOFF TOTALS Clearwater River Watershed District Precipitation (inches of water) Maine Area-Weighted Runoff YEAR Watkins Kingston Prairie Corinna Average (inches) (1) (1) (2) (2) (2) (2) (2) (2) Mean Std. Dev NOTES: Whole watershed runoff is based on time-weighted average flow at Clearwater Lake outlet (station CR 1.5), and total drainage area of 155 square miles. (1) Data for single gauge in east-central part of watershed (Camp Heritage on Lake Caroline). (2) Average values of other stations in District were used to fill in missing data. T:\2\49\Table_1.xls\Historical Runoff
18 TABLE 2 HISTORICAL SUMMARY OF STREAM FLOWS, PHOSPHORUS CONCENTRATIONS, AND LOADINGS Clearwater River Watershed District Average Total Phosphorus Average Stream Flow Concentration Total Phosphorus Load Station Year (cu m/sec) (cfs) (mg/l) (kg) (lb) Main Stem: CR (1) (1) ,7 43, , 168, ,7 78, ,5 144, ,2 122, , ,85 4, ,4 15, ,2 22, ,66 3, ,6 25, ,1 22, ,4 22, ,86 6, ,17 4, ,19 7, (4),(5) ,39 9, ,29 9,46 CR (1) ,6 4, (1) ,99 11, ,5 4, ,62 14, ,7 36, ,7 52, , ,34 5, ,6 6, ,5 23, ,9 17, ,33 14, ,85 6, ,4 6, ,97 4, ,69 5, ,33 5, ,52 3, (4),(5) , ,95 6,5 T:\2\49\Table2_old Table 4.XLS\Warner Creek calcs 1/9/23 1 of 2
19 TABLE 2 HISTORICAL SUMMARY OF STREAM FLOWS, PHOSPHORUS CONCENTRATIONS, AND LOADINGS Clearwater River Watershed District Average Total Phosphorus Average Stream Flow Concentration Total Phosphorus Load Station Year (cu m/sec) (cfs) (mg/l) (kg) (lb) Tributaries: NOTES: WR.2 (2) 1981 (1) (1) , ,27 2, , ,13 4, ,63 1, , , , (3) (4),(5) ,6 Flow values are time-weighted averages unless otherwise noted. Total phosphorus values are flow- and time-weighted averages unless otherwise noted. (1) Values in 1981 and 1982 are arithmetic means (2) Station WR.2 was designated Station WC.2 in (3) Phosphorus values in 2 are flow-weighted and adjusted per log-log regression on flow so as to correspond to annual mean flows. (4) 21 Flow and total phosphorus values are arithmetic averages. (5) 21 total phosphorus loads estimated from arithmetic averages of flow and total phosphorus values. T:\2\49\Table2_old Table 4.XLS\Warner Creek calcs 1/9/23 2 of 2
20 Figures

21
22 Monthly Precipitation Monthly Normal JAN FEB MAR APR MAY JUN JUL AUG SEPT OCT NOV DEC Cumulative Precipitation Cumulative Normal Cumulative Litchfield inches (1965) Cokato 4.78 inches (1991) St. Cloud 41.1 inches (1897) Normal Year = JAN FEB MAR APR MAY JUN JUL AUG SEPT OCT NOV DEC CLEARWATER RIVER WATERSHED DISTRICT 22 Precipitation Data of Annandale Station and Annual Highs Wenck Associates, Inc. Environmental Engineers Wenck 18 Pioneer Creek Center Maple Plain, MN JAN. 23 Figure 2 T:\2\49\precipitation_22.xls22 Novotne
23 Monthly Precipitation Monthly Normal JAN FEB MAR APR MAY JUN JUL AUG SEPT OCT NOV DEC Cumulative Precipitation Cumulative Normal Cumulative Litchfield inches (1965) Cokato 4.78 inches (1991) St. Cloud 41.1 inches (1897) Normal Year = JAN FEB MAR APR MAY JUN JUL AUG SEPT OCT NOV DEC CLEARWATER RIVER WATERSHED DISTRICT 22 Precipitation Data of Watkins Station and Annual Highs Wenck Associates, Inc. Environmental Engineers Wenck JAN Pioneer Creek Center Maple Plain, MN Figure 3 T:\2\49\precipitation_22.xls22 Klein
24 Monthly Precipitation Monthly 6.81 Normal JAN FEB MAR APR MAY JUN JUL AUG SEPT OCT NOV DEC Cumulative Precipitation Cumulative Normal Cumulative Litchfield inches (1965) Cokato 4.78 inches (1991) St. Cloud 41.1 inches (1897) Normal Year = JAN FEB MAR APR MAY JUN JUL AUG SEPT OCT NOV DEC CLEARWATER RIVER WATERSHED DISTRICT 22 Precipitation Data of Kimball Station and Annual Highs Wenck Associates, Inc. Environmental Engineers Wenck 18 Pioneer Creek Center Maple Plain, MN JAN. 23 Figure 4 T:\2\49\precipitation_22.xls22 Eckman

25
26

27
28
29 Total Phosphorus Means (u g/l) Augusta Betsy Caroline Clearwater East Clearwater West Henshaw Little Mud Marie Scott Union Weigand Chlorophyll-a Means (u g/l) Augusta Betsy Caroline Clearwater East Clearwater West Henshaw Little Mud Marie Scott Union Weigand Secchi Means (feet) Augusta 3. Betsy 5.1 Caroline Clearwater East Clearwater West Henshaw Little Mud Marie 2.4 Scott 3.3 Union Weigand Clearwater River Watershed District 22 Graphical Summary of Lake Water Quality Wenck Associates, Inc. Environmental Engineers Wenck 18 Pioneer Creek Center Maple Plain, MN Jan 23 Figure 9 T:\2\49\22Report\LAKE_WQ_2.xls\Figure 9 All Lake Summary
30 Total Phosphorus Concentration (ug/l) Mean Concentration Chlorophyll-a Concentration (ug/l) Mean Concentration Secchi Depth Feet Mean Depth Meters Clearwater River Watershed District Lake Augusta Historical Data Wenck Associates, Inc. Environmental Engineers Wenck 18 Pioneer Creek Center Maple Plain, MN Jan 23 Figure 1 T:\2\49\LAKE_WQ_2.xls\Lake Augusta.xls
31 Total Phosphorus Concentration (ug/l) Mean Concentration Chlorophyll-a Concentration (ug/l) Mean Concentration Secchi Depth Feet Mean Depth Meters Clearwater River Watershed District Lake Betsy Historical Data T:\2\49\LAKE_WQ_2.xls\Lake Betsy.xls Wenck Wenck Associates, Inc. 18 Pioneer Creek Center Environmental Engineers Maple Plain, MN Jan 23 Figure 11
32 Total Phosphorus Concentration (ug/l) Mean Concentration Chlorophyll-a Concentration (ug/l) Mean Concentration Secchi Depth Feet Mean Depth 12. Historical Data Meters Clearwater River Watershed District Lake Caroline Historical Data T:\2\49\LAKE_WQ_2.xls\Lake Caroline.xls Wenck Wenck Associates, Inc. 18 Pioneer Creek Center Environmental Engineers Maple Plain, MN Jan 23 Figure 12
33 Total Phosphorus Concentration (ug/l) Mean Concentration Chlorophyll-a Concentration (ug/l) Mean Concentration Secchi Depth Feet Mean Depth Meters Clearwater River Watershed District Clearwater Lake West Historical Data T:\2\49\LAKE_WQ_2.xls\Clearwater West.xls Wenck Wenck Associates, Inc. 18 Pioneer Creek Center Environmental Engineers Maple Plain, MN Jan 23 Figure 13
34 Total Phosphorus Concentration (ug/l) Mean Concentration Chlorophyll-a Concentration (ug/l) Mean Concentration Secchi Depth Feet Meters Mean Depth Clearwater River Watershed District Clearwater Lake East Historical Data T:\2\49\LAKE_WQ_2.xls\Clearwater East.xls Wenck Wenck Associates, Inc. 18 Pioneer Creek Center Environmental Engineers Maple Plain, MN Jan 23 Figure 14
35 Total Phosphorus Concentration (ug/l) Mean Concentration Chlorophyll-a Concentration (ug/l) Mean Concentration Secchi Depth Feet Mean Depth Meters Clearwater River Watershed District Henshaw Lake Historical Data T:\2\49\LAKE_WQ_2.xls\Henshaw.xls Wenck Wenck Associates, Inc. 18 Pioneer Creek Center Environmental Engineers Maple Plain, MN Jan 23 Figure 15
36 Total Phosphorus Concentration (ug/l) Mean Concentration Mean Concentration Chlorophyll-a Concentration (ug/l) Secchi Depth Feet Mean Depth Meters Clearwater River Watershed District Lake Marie Historical Data Wenck Wenck Associates, Inc. 18 Pioneer Creek Center Environmental Engineers Maple Plain, MN Jan 23 Figure 16 T:\2\49\LAKE_WQ_2.xls\Marie.xls
37 Total Phosphorus Concentration (ug/l) Mean Concentration Chlorophyll-a Concentration (ug/l) Mean Concentration Secchi Depth Feet Mean Depth Meters Clearwater River Watershed District Little Mud Lake Historical Data Jan 23 Wenck Figure 17 Wenck Associates, Inc. 18 Pioneer Creek Center Environmental Engineers Maple Plain, MN T:\2\49\LAKE_WQ_2.xls\Little Mud.xls
38 Total Phosphorus Concentration (ug/l) Mean Concentration Chlorophyll-a Concentration (ug/l) Mean Concentration Secchi Depth Feet Mean Depth Meters Clearwater River Watershed District Scott Lake Historical Data T:\2\49\LAKE_WQ_2.xls\Scott.xls Wenck Wenck Associates, Inc. 18 Pioneer Creek Center Environmental Engineers Maple Plain, MN Jan 23 Figure 18
39 Concentration (ug/l) Mean Concentration Total Phosphorus Mean Concentration Chlorophyll-a 5 Concentration (ug/l) Mean Depth Secchi Depth Feet Meters Clearwater River Watershed District Union Lake Historical Data T:\2\49\LAKE_WQ_2.xls\Union.xls Wenck Wenck Associates, Inc. 18 Pioneer Creek Center Environmental Engineers Maple Plain, MN Jan 23 Figure 19
40 Total Phosphorus Concentration (ug/l) Mean Concentration Chlorophyll-a Concentration (ug/l) Mean Concentration Secchi Depth Feet Mean Depth Meters Clearwater River Watershed District Weigand Lake Historical Data T:\2\49\LAKE_WQ_2.xls\Weigand.xls Wenck Wenck Associates, Inc. 18 Pioneer Creek Center Environmental Engineers Maple Plain, MN Jan 23 Figure 2
41 Appendix A 22 Monitoring Plan Summary
42
43
44
45
46
47 Appendix B Citizen s Lake Monitoring Program Secchi Data
48 Secchi Means 2 to 22 Augusta Betsy Bass Caroline Cedar Clear Clearwater W Clearwater E Grass Little Mud Louisa Marie Millpond Nixon Otter Pleasant School Section Union Secchi Depth in Feet Wenck Associates, Inc. Environmental Engineers Wenc CLEARWATER RIVER WATERSHED JAN 23 DISTRICT Citizen Secchi Data Pioneer Creek Center Maple Plain, MN Figure B-1 T:\2\49\secchi_anrpt_22.xls\Fig B-1.xls
49 Lake Augusta (Kampa) Secchi (ft) Jan- Mar- May- Jul- Sep- Nov- Jan-1 Mar-1 May-1 Jul-1 Sep-1 Nov-1 Jan-2 Mar-2 May-2 Jul-2 Sep-2 Nov-2 Jan Secchi (ft) Jan- Mar- May- Jul- Sep- Nov- Bass Lake (Ross) Jan-1 Mar-1 May-1 Jul-1 Sep-1 Nov-1 Jan-2 Mar-2 May-2 Jul-2 Sep-2 Nov-2 Jan-3 Lake Betsy (Saukkola) Secchi (ft) Jan- Mar- May- Jul- Sep- Nov- Jan-1 Mar-1 May-1 Jul-1 Sep-1 Nov-1 Jan-2 Mar-2 May-2 Jul-2 Sep-2 Nov-2 Jan-3 2 CLEARWATER RIVER WATERSHED DISTRICT Citizen Secchi Data Wenck Associates, Inc. Environmental Engineers Wenck 18 Pioneer Creek Center Maple Plain, MN JAN 23 Figure B-2 T:\2\49\secchi_anrpt_22.xls\Fig B-2.xls
50 Lake Caroline (Bechtold) Secchi (ft) Jan- Mar- May- Jul- Sep- Nov- Jan-1 Mar-1 May-1 Jul-1 Sep-1 Nov-1 Jan-2 Mar-2 May-2 Jul-2 Sep-2 Nov-2 Jan-3 Cedar Lake (Badger & Johnson) Secchi (ft) Jan- Mar- May- Jul- Sep- Nov- Jan-1 Mar-1 May-1 Jul-1 Sep-1 Nov-1 Jan-2 Mar-2 May-2 Jul-2 Sep-2 Nov-2 Jan-3 Clear Lake (Brandenburg) Secchi (ft) Jan- Mar- May- Jul- Sep- Nov- Jan-1 Mar-1 May-1 Jul-1 Sep-1 Nov-1 Jan-2 Mar-2 May-2 Jul-2 Sep-2 Nov-2 Jan-3 CLEARWATER RIVER WATERSHED DISTRICT Wenck Wenck Associates, Inc. Citizen Secchi Data Environmental Engineers Maple Plain, MN Pioneer Creek Center JAN 23 Figure B-3 T:\2\49\secchi_anrpt_22.xls\Fig B-3.xls
51 Clearwater Lake (Roeder) NW Near Bridge Secchi (ft) Jan- Mar- May- Jul- Sep- Nov- Jan-1 Mar-1 May-1 Jul-1 Sep-1 Nov-1 Jan-2 Mar-2 May-2 Jul-2 Sep-2 Nov-2 Jan-3 Clearwater Lake (Roeder) West Jan- Mar- May- Jul- Sep- Nov- Jan-1 Mar-1 May-1 Jul-1 Sep-1 Nov-1 Jan-2 Mar-2 May-2 Jul-2 Sep-2 Nov-2 Jan Secchi (ft) Grass Lake (Liebrenz) Secchi (ft) Jan- Mar- May- Jul- Sep- Nov- Jan-1 Mar-1 May-1 Jul-1 Sep-1 Nov-1 Jan-2 Mar-2 May-2 Jul-2 Sep-2 Nov-2 Jan-3 CLEARWATER RIVER WATERSHED DISTRICT Wenck Wenck Associates, Inc. Citizen Secchi Data Environmental Engineers Maple Plain, MN Pioneer Creek Center JAN 23 Figure B-4 T:\2\49\secchi_anrpt_22.xls\Fig B-4.xls
52 Little Mud Lake (Stenger) Secchi (ft) Jan- Mar- May- Jul- Sep- Nov- Jan-1 Mar-1 May-1 Jul-1 Sep-1 Nov-1 Jan-2 Mar-2 May-2 Jul-2 Sep-2 Nov-2 Jan-3 Lakes Louisa-Marie (Driver) Secchi (ft) Jan- Mar- May- Jul- Sep- Nov- Jan-1 Mar-1 May-1 Jul-1 Sep-1 Nov-1 Jan-2 Mar-2 May-2 Jul-2 Sep-2 Nov-2 Jan-3 Millpond-Lake Marie Secchi (ft) Jan- Mar- May- Jul- Sep- Nov- Jan-1 Mar-1 May-1 Jul-1 Sep-1 Nov-1 Jan-2 Mar-2 May-2 Jul-2 Sep-2 Nov-2 Jan-3 CLEARWATER RIVER WATERSHED DISTRICT Wenck Wenck Associates, Inc. Citizen Secchi Data Environmental Engineers Maple Plain, MN Pioneer Creek Center JAN 23 Figure B-5 T:\2\49\secchi_anrpt_22.xls\Fig B-5.xls
53 Lake Nixon (Lee) Secchi (ft) Jan Mar- May- Jul- Sep- Nov- Jan-1 Mar-1 May-1 Jul-1 Sep-1 Nov-1 Jan-2 Mar-2 May-2 Jul-2 Sep-2 Nov-2 Jan-3 Otter Lake (No 22 Data) Secchi (ft) Jan- Mar- May- Jul- Sep- Nov- Jan-1 Mar-1 May-1 Jul-1 Sep-1 Nov-1 Jan-2 Mar-2 May-2 Jul-2 Sep-2 Nov-2 Jan-3 Pleasant Lake (Lundberg) Secchi (ft) Jan- Mar- May- Jul- Sep- Nov- Jan-1 Mar-1 May-1 Jul-1 Sep-1 Nov-1 Jan-2 Mar-2 May-2 Jul-2 Sep-2 Nov-2 Jan-3 CLEARWATER RIVER WATERSHED DISTRICT Citizen Secchi Data Environmental Engineers Maple Plain, MN T:\2\49\secchi_anrpt_22.xls\Fig B-6.xls Wenck Associates, Inc. Wenck 18 Pioneer Creek Center JAN 23 Figure B-6
54 School Section Lake (Eckman) Secchi (ft) Jan- Mar- May- Jul- Sep- Nov- Jan-1 Mar-1 May-1 Jul-1 Sep-1 Nov-1 Jan-2 Mar-2 May-2 Jul-2 Sep-2 Nov-2 Jan-3 Union Lake (Jonas) Secchi (ft) Jan- Mar- May- Jul- Sep- Nov- Jan-1 Mar-1 May-1 Jul-1 Sep-1 Nov-1 Jan-2 Mar-2 May-2 Jul-2 Sep-2 Nov-2 Jan-3 CLEARWATER RIVER WATERSHED DISTRICT Citizen Secchi Data Environmental Engineers Maple Plain, MN T:\2\49\secchi_anrpt_22.xls\Fig B-7.xls Wenck Associates, Inc. Wenck 18 Pioneer Creek Center JAN 23 Figure B-7
55 Appendix C 22 Water Quality Laboratory Reports and Data