FIGURE ENVIRONMENTAL ASSESSMENT OF THE CAPITAL REGION RESOURCE RECOVERY CENTRE LEGEND NOTE REFERENCE
|
|
|
- Nathaniel Garrison
- 5 years ago
- Views:
Transcription

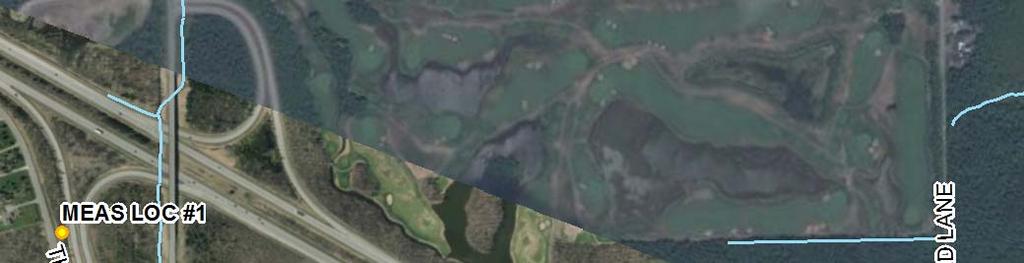
1 Path: N:\Active\Spatial_IM\Miller_Paving_Ltd\CRRRC\\MXDs\ \Reporting\Phase\Vol.1\ Vol mxd LEGEND NOISE MONITORING LOCATIONS.! 2 SCALE 1:12, METRES POINT OF RECEPTION LOCATIONS PROPERTY BOUNDARY THIS FIGURE IS TO BE READ IN CONJUNCTION WITH THE ACCOMPANYING REPORT. REFERENCE BACKGROUND IMAGERY - BING MAPS AERIAL (C) 21 MICROSOFT CORPORATION AND ITS DATA SUPPLIERS. AERIAL PHOTOGRAPHS PURCHASED FROM THE CITY OF OTTAWA. LAND INFORMATION ONTARIO (LIO) DATA PRODUCED BY GOLDER ASSOCIATES LTD. UNDER LICENCE FROM ONTARIO MINISTRY OF NATURAL RESOURCES, QUEENS PRINTER 212. ION: TRANSVERSE MERCATOR DATUM: NAD 83 COORDINATE SYSTEM: UTM ZONE 18 NOISE MONITORING AND ASSESSMENT Ottawa, Ontario No DEC. 213 DESIGN TG BR DEC. 213 AUG. 214 CHECK PLE AUG. 214 REVIEW PAS SCALE AS SHOWN REV.. FIGURE

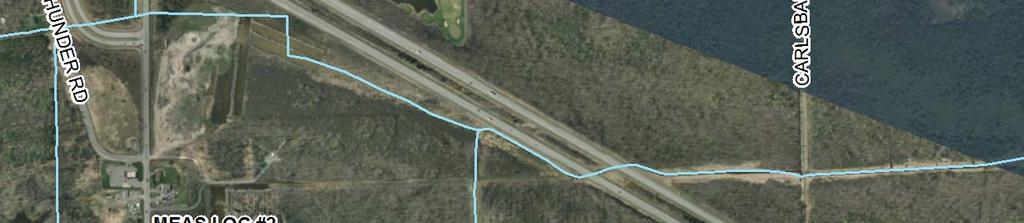


2 518 Path: N:\Active\Spatial_IM\Miller_Paving_Ltd\CRRRC\\MXDs\ \Working\Phase2\Task11-Atmosphere\ _VacantLot.mxd LEGEND # RECEPTOR LOCATION SURFACE WATER FEATURE VACANT LOT PROPERTY BOUNDARY 2 SCALE 1:14, METRES THIS FIGURE IS TO BE READ IN CONJUNCTION WITH THE ACCOMPANYING REPORT. REFERENCE BACKGROUND IMAGERY - BING MAPS AERIAL (C) 21 MICROSOFT CORPORATION AND ITS DATA SUPPLIERS. AERIAL PHOTOGRAPHS PURCHASED FROM THE CITY OF OTTAWA. LAND INFORMATION ONTARIO (LIO) DATA PRODUCED BY GOLDER ASSOCIATES LTD. UNDER LICENCE FROM ONTARIO MINISTRY OF NATURAL RESOURCES, QUEENS PRINTER 212. ION: TRANSVERSE MERCATOR DATUM: NAD 83 COORDINATE SYSTEM: UTM ZONE 18 VACANT LOT LOCATIONS Ottawa, Ontario No TG NOV. 213 DESIGN BR NOV. 213 AUG. 214 CHECK PLE AUG. 214 REVIEW PAS SCALE AS SHOWN REV.. FIGURE
3 ENVIRONMENTAL ASSESSMENT OF PROPOSED CAPITAL REGION RESOURCE RECOVERY CENTRE VOLUME I Air Quality and Odour This section presents a characterization of existing background air quality within the Site and Site-vicinity study areas. In Ontario, limits and guidelines for regulating air quality are established under O. Reg. 419/5 (Air Pollution Local Air Quality) (MOE, 213a). These include standards, point-of-impingement guidelines and AAQC for various compounds. In characterizing the existing environment for air quality and odour, a local meteorological station was identified, the Stetson Flyer meteorological station located on the south part of the Boundary Road Site. The Stetson Flyer meteorological station s suitability as a source of weather data was assessed by examining the meteorological tower installation and its location, as well as the meteorological data. Based on this review, it was determined that the meteorological data from the Stetson Flyer station was not adequate for use in the EA, as the data was not of sufficient quality or quantity. Instead, background air quality was determined from existing MOECC monitoring stations. The closest air quality monitoring stations to the proposed CRRRC are the two stations located in Ottawa: Ottawa Downtown (Ottawa DT) and Ottawa Central (Ottawa C) (MOE, 211). The location of each of these stations relative to the CRRRC is set out in Table Table : Location of Air Monitoring Stations Station City Location ID Lat/Long Distance to Site (km) Direction Ottawa Downtown (Ottawa DT) Ottawa Central (Ottawa C) 511 Outside Sitevicinity Area Outside Sitevicinity Area , West-Northwest (generally upwind) West-Northwest (generally upwind) For compounds relevant to the CRRRC, monitoring data for sulphur dioxide (SO 2), nitrogen dioxide (NO 2), oxides of nitrogen (NO X), carbon monoxide (CO) and PM 2.5 are available. Ambient monitoring is not available directly for background SPM (Suspended Particulate Matter) and PM 1 concentrations. However, background PM 1 and SPM can be determined from the fine particulate (PM 2.5 ) monitoring results. Overall, ambient levels of PM 2.5 have been found to be about 5% of the PM 1 concentration (Health Canada, 1998). The SPM concentrations in Canada are about twice the corresponding PM 1 concentrations (Health Canada, 1998). These ratios were used to derive the background SPM and PM 1 from the PM 2.5 monitoring data at each station. Table provides a summary of the monitoring data available from each of the air monitoring stations. December
4 ENVIRONMENTAL ASSESSMENT OF PROPOSED CAPITAL REGION RESOURCE RECOVERY CENTRE VOLUME I Table : Availability of Ambient Air Quality Data Compound Ottawa DT Ottawa C SPM N/A N/A PM 1 N/A N/A PM NO x NO SO 2 21, CO 21, Note: N/A indicates that data for the compound were not available at that station. The historic monitoring data for the two stations evaluated indicate that the compound levels in the area are typical when compared to other locations in Southeastern Ontario. All measured values were below their respective AAQC values. The existing values considered to be representative of background air quality are outlined in Table Generally, the 9 th percentile of measured concentration is considered representative of local background air quality. Table : Background Air Quality Concentrations (9th Percentile) Compound Averaging Period Ottawa DT (µg/m³) Ottawa C (µg/m³) PM hour NO X 1-hour hour Annual NO 2 1-hour hour Annual SO 2 1-hour hour Annual CO 1-hour hour Note: µg/m 3 = micrograms per cubic metre. These stations are considered generally indicative of background air quality levels for the Site. An important existing condition component to the assessment is wind direction. The MOECC meteorological 5-year dataset was used to generate a wind rose showing the wind direction as blowing from in Figure (MOE, 211). December
5 THIS FIGURE IS TO BE READ IN CONJUNCTION WITH THE ACCOMPANYING REPORT. EASTERN REGION WIND ROSE No DESIGN CST LEB Dec. 213 Dec. 213 CHECK PLE Aug. 214 REVIEW PAS Aug. 214 PHASE No. 45 NOT TO SCALE REV. FIGURE