HEMSON C o n s u l t i n g L t d. 30 St. Patrick St., Suite 1000 Toronto, Ontario M5T 3A3 POPULATION AND GROWTH PROJECTIONS
|
|
|
- Blaise Sherman
- 5 years ago
- Views:
Transcription

1 POPULATION AND GROWTH PROJECTIONS United Counties of Stormont, Dundas and Glengarry HEMSON C o n s u l t i n g L t d. 30 St. Patrick St., Suite 1000 Toronto, Ontario M5T 3A3 January 2013
2 TABLE OF CONTENTS I INTRODUCTION... 1 A. PURPOSE OF STUDY... 2 B. FRAMEWORK FOR ANALYSIS... 2 C. STRUCTURE OF THIS REPORT... 4 II GROWTH OUTLOOK... 5 A. COUNTY S RELATIONSHIP WITH SURROUNDING AREAS IS THE KEY FORECASTING ISSUE... 5 B. OUTLOOK IS FOR MODEST GROWTH OVER THE PERIOD TO C. GROWTH DISTRIBUTED LOCALLY BASED ON PLANNING POLICY AND MARKET DEMAND FACTORS III LAND SUPPLY AND CAPACITY ANALYSIS A. ANALYSIS OF LAND SUPPLY INDICATES A SIGNIFICANT CAPACITY TO ACCOMMODATE GROWTH B. EXCESS SUPPLY MEANS NO OVERALL ADDITION TO THE LAND SUPPLY IS JUSTIFIED IV SETTLEMENT AREA BOUNDARY REVISIONS A. AN ITERATIVE AND CONSULTATIVE APPROACH HAS BEEN TAKEN TO RATIONALIZE THE BOUNDARIES B. MAPPING AND ADMINISTRATIVE CHANGES ARE TREATED SEPERATELY C. PREFERRED OPTION BALANCES PLANNING POLICY OBJECTIVES WITH LOCAL PRIORITIES V KEY POLICY RECOMMENDATIONS APPENDIX Detailed Forecast Results Detailed Results for the Land Supply Capacity Analysis Revised Settlement Area Boundary Mapping HEMSON
3 I INTRODUCTION The United Counties of Stormont, Dundas and Glengarry ( the County ) will soon begin a review and update of its current official plan. The process is undertaken periodically as good planning practice and is required every five years under the Planning Act. One of the key components of the plan review will be an update of the long-range growth outlook and associated settlement area land requirements for the community. Among other matters, it will be important for the review to satisfy Provincial policies; particularly the Provincial Policy Statement (PPS) requirement that settlement area expansions only be allowed where such expansions have been justified through a comprehensive review. The County s current official plan forecasts are based on work prepared in 2000 and need to be updated and their horizon extended to The County plan is also based on a set of legacy settlement area boundaries which were established by the local municipalities prior to the amalgamation in 1998, which resulted in the creation of the six Townships. 1 As a result, the boundaries established by the previous municipalities are, in some cases, very old and were determined on a different basis for each community. A more consistent set of settlement area boundaries will need to be put in place in the County s updated plan. As an initial step in the process, County staff recently undertook a review of the residential and employment land supply as well as an analysis of current settlement area boundaries. The results are described in the Comprehensive Settlement Area Boundary Study Summary, (2011) and include recommendations for a variety of changes including area expansions, removal of lands not suitable for development and some minor technical or housekeeping adjustments. After the 2011 boundary report was completed, however, the County determined that further economic, demographic and land supply analysis was required to take into account more recent information as well as to address emerging growth pressures, including a number of development proposals involving contiguous land holdings that are partly within and partly outside of the settlement areas. Further analysis is also required to establish the appropriate density targets and housing unit allocations to the Townships within the County as part of the updated official plan. 1 The six townships were amalgamated from 20 former local municipalities and are the Townships of North and South Dundas, North and South Stormont and North and South Glengarry.
4 2 A. PURPOSE OF STUDY The primary purpose of the study is undertake the analysis necessary to determine the appropriateness of the current settlement area boundaries and to confirm or, as appropriate, recommend changes or refinements to the 2011 boundary report. The analysis is undertaken in three steps: The first step is to establish the demand outlook by preparing a set of updated population, housing and employment forecasts over the period to A low, medium and high forecast scenario is prepared for population and employment to provide a range on the future growth outlook; Next, the capacity of the designated land supply to accommodate future demand is estimated, with a focus on the supply of designated urban and rural settlement area lands within the County. The capacity of the land supply is estimated by applying a range of density factors to land areas measured from the County s Geographic Information System (GIS); Finally, based on a comparison of supply and demand, conclusions are reached on the appropriateness of current settlement area boundaries, particularly as they relate to conclusions of the 2011 Settlement Area Boundary Report. The conclusions are translated into recommended changes to settlement area boundaries as part of the updated official plan. Arising out of the first step of the analysis, overall population forecasts and housing unit allocations for the local municipalities within the County are being provided as input to the updated official plan. More detailed forecast results are also being provided, including an age structure forecast to assist the County and the local municipalities in decision-making for financial and service delivery planning. The age structure forecast is provided in the Appendix. B. FRAMEWORK FOR ANALYSIS In order to understand the conclusions of the study, particularly those related to the proposed settlement area boundaries, it is important to understand the framework for analysis. The analysis is undertaken within the context of the 2005 Provincial Policy Statement (PPS), particularly Section 1.0 Building Strong Communities which provides direction on the time horizon for designating growth areas and the requirements to allow for settlement area expansions. In particular, Section indicates that: HEMSON
5 3 A planning authority may identify a settlement area or allow the expansion of a settlement area boundary only at the time of a comprehensive review and only where it has been demonstrated that: a) sufficient opportunities for growth are not available through intensification, redevelopment and designated growth areas to accommodate the projected needs over the identified planning horizon; b) the infrastructure and public service facilities which are planned or available are suitable for the development over the long term and protect public health and safety; c) in prime agricultural areas: 1. the lands do not comprise specialty crop areas; 2. there are no reasonable alternatives which avoid prime agricultural areas; and 3. there are no reasonable alternatives on lower priority agricultural lands in prime agricultural areas; and d) impacts from new or expanding settlement areas on agricultural operations which are adjacent or close to the settlement area are mitigated to the extent feasible. In determining the most appropriate direction for expansions to the boundaries of settlement areas or the identification of a settlement area by a planning authority, a planning authority shall apply the policies of Section 2: Wise Use and Management of Resources and Section 3: Protecting Public Health and Safety. The overall objective of the PPS policies is to direct growth to designated settlement areas and prevent the over-designation of new urban development lands to accommodate growth. As such, this policy direction has a clear application to large rapidly growing urban areas, particularly those in the Greater Toronto and Hamilton Area (GTHA) as well as some rapidly growing communities beyond the GTHA such as the County of Simcoe and Region of Waterloo. Although it does not apply to the County, the Provincial Growth Plan for the Greater Golden Horseshoe (the Growth Plan) reinforces the PPS policies, particularly with respect to encouraging a more compact urban form, the protection of the natural environment and the requirement for settlement area expansions to be justified through a comprehensive review. HEMSON
6 4 The application of the PPS policies regarding settlement area expansions outside of GTHA, however, is somewhat less clear, particularly in slower growing communities that already have a large supply of land designated to accommodate growth. In accordance with the PPS, the presence of a large land supply does not mean that growth should be stopped: new development can still proceed where the land is already designated and for which servicing has already been approved and allocated. Decisions regarding settlement area expansions, however, must still meet Provincial planning objectives to focus growth within designated settlement areas and prevent the over-designation of new urban lands. C. STRUCTURE OF THIS REPORT Consistent with the structure of the analysis, the remainder of this report is organized into four sections. The following section describes the growth forecast, including the high, low and reference scenarios for population and employment. Next is a section describing the land supply and capacity analysis, including the estimated unit potential for each of the Townships. Based upon the results of the demand and land supply analysis, recommendations for settlement area boundary revisions are then made in the next section. This is followed by a final section setting out our overall conclusions as well as the inputs and recommendations for consideration by County staff as input to the updated official plan. HEMSON
7 5 II GROWTH OUTLOOK This chapter describes the growth outlook, beginning with a discussion of the key factors influencing the forecast. This is followed by a description of the County-wide forecast results and their local distribution A. COUNTY S RELATIONSHIP WITH SURROUNDING AREAS IS THE KEY FORECASTING ISSUE The most important factor driving the overall growth forecast is the economic and urban structural relationship between the County and broader regional economy centred on the City of Ottawa and, to a lesser extent, Montreal. Much of the growth that has occurred in recent years in the County as well as the current distribution of population within the County can be explained by these relationships, which are illustrated in Table 1 below and shown graphically on the following page. Commuting Behaviour of the UCSDG Resident Employed Labour Force 2006 Census Information Portion of County (see note 1) Western Central Eastern Table 1 Total County Resident Employed Labour Force with a Usual Place of Work (See Note 2) 9,655 26,385 10,675 46,715 Working within the UCSDG Share of Employed Residents 6, % 23, % 8, % 38, % Share to City of Cornwall 3.1% 66.0% 25.2% 43.9% Working Outside the UCSDG 3,665 3,000 1,745 8,410 Share to Ottawa Share to Elsewhere (mainly other parts of Ontario) 70.5% 29.5% 48.5% 51.5% 28.1% 71.9% 53.9% 46.1% Source: Hemson Consulting Ltd. based on Statistics Canada 2006 Census data. Notes: Western portion is North and South Dundas. Central portion is North Stormont, South Stormont and the City of Cornwall. Eastern portion is North and South Glengarrry.The approximately 5,000 persons living in the UCSDG with no fixed place of work are not included. HEMSON
8 6 UCSDG 2006 Commuting Patterns ORIGIN DESTINATION Prescott & Russell 750 Montreal 190 Prescott & Russell 1,015 Montreal 795 Ottawa 520 UCSDG 41,585 Ottawa 4,530 UCSDG 46,730 Leeds & Grenville 830 Leeds & Grenville 975 Toronto 15 Toronto 105 NET COMMUTING Prescott & Russell -310 Montreal -605 Ottawa -4,010 UCSDG -5,145 Leeds & Grenville -145 Toronto -90 Source: Hemson Consulting Ltd. based on Statistics Canada 2006 Census data. HEMSON
9 7 As can be seen from the table and the graphic, overall, the County is an exporter of labour with just over 80% of the total resident employed labour force living and working in the community. This ratio is higher than the United Counties of Prescott and Russell to the north, where just over 50% of the resident employed labour force actually lives and works within the community. The central and eastern areas of the County enjoy a fairly high ratio, largely as s result of employment opportunities in the City of Cornwall. The ratio drops, however, to just over 60% in the western parts of the County, the result of commuting to job opportunities concentrated in the City of Ottawa. This commuting relationship is leading to increased development pressures in the northwest part of the County, in particular communities such as Hallville, Winchester and Harmony in the Township of North Dundas. Although not reflected in the 2006 Census information, according to County staff some communities in the south-east part of the County such as the Lancaster area are also attracting greater development interest as a result of Montreal-based commuter traffic. These relationships are anticipated to have a strong effect on both the amount of and distribution of future growth, particularly related to the demand for commuterrelated housing. The outlook for employment is also tied, in part, to the County s relationship to the broader economic region, in particular the outlook for the City of Cornwall and the Townships of South Stormont and South Glengarry. The health and diversity of the Cornwall economy as well as the County s economy and broader regional economy will all exert an influence on the housing outlook by location and choice of housing type and, as a result, the local distribution of growth. B. OUTLOOK IS FOR MODEST GROWTH OVER THE PERIOD TO 2031 On a County-wide basis, population is forecast to grow to a total of 121,600 by 2031, representing fairly modest growth. Employment is forecast to decline, largely as a result of the aging of the population and continued out-migration from the County although this does not mean that no new development will occur. The decline overall is likely to be balanced by growth in specific locations and sectors, such as goods movement and distribution. The population forecast is translated into a forecast of housing units, as input to the land supply and capacity analysis presented in the next chapter. The forecast method and results are described in more detail below. The detailed age structure results are provided in the Appendix. HEMSON
10 1. Forecasts Are Prepared Using Well-Established Methods 8 The population forecast for the County is prepared using the well-established cohort survival model which accounts for: births by age of mother, deaths by age and sex, and migration by its seven components, each also by age and sex, at both Provincial and sub-provincial geographies. The forecast takes into account information from the 2006 Census and the first release of data from the 2011 Census of Canada: population and population by age and sex. The cohort survival model operates by taking a five year age group (e.g. 20 to 24 in 2011), ages them by five years (they become 24 to 29 in 2016), deducts deaths in that age group (the natural increase ) and, finally, adds net migration for that age group. Births during the five year period produced by this age group are then added to the 0 to 4 year age group. A sub-provincial forecast is then prepared for the GGH, GTHA and rest of Ontario including the County using the same method, including a forecast of migration by component and age structure. The employment forecast is driven by the population forecast, prepared by applying age-specific labour force participation rates to the population forecast and adjusting for unemployment and commuting patterns. In most locations in Ontario, commuting (both in and out from a municipality) has been increasing faster than the rate of employment overall. Within Ontario, the GTHA is forecast to remain in a positive net in-commuting position throughout the forecast period. Negative net incommuting (or net out-commuting) is anticipated to increase steadily throughout most communities in the rest of Ontario, including the County. A low, high and reference forecast is prepared for population, employment and households in order to provide a range on the future growth outlook. The reference forecast represents the most likely growth outlook and is the most appropriate basis for the County s planning purposes. The high and low forecasts are prepared by incorporating deliberately optimistic and pessimistic assumptions, mainly related to the amount and growth of in migration from Ottawa and Montreal. 2. Population Is Forecast to Grow to Approximately 122,000 by 2031 As shown in Table 2 on the following page, under the Hemson reference scenario, the total population of the County area, including the City of Cornwall is forecast to grow to nearly 122,000 by The figures shown are for total population including a net-under coverage factor of approximately 4%. HEMSON
11 9 Forecast Total Population United Counties of Stormont, Dundas and Glengarry Including the City of Cornwall Table 2 Hemson Forecast Range Census Year Low Reference High 115, , , , , , , , , , , ,600 Growth ,900 5,000 10,200 Source: Hemson Consulting Ltd Low forecast based on Ministry of Finance Projections. Figures are rounded. The population forecasts in Table 2 are shown for the County including the City of Cornwall to allow for comparison with other existing forecasts, including the current official plan forecasts, as well as to illustrate the anticipated relationship between Cornwall and the rest of the County over the period. The reference forecast for County, excluding Cornwall, is shown in Table 3 below. Forecast Total Population United Counties of Stormont, Dundas and Glengarry (Excluding the City of Cornwall) Table 3 Census Year Hemson Reference Forecast ,300 67,500 68,000 67,900 68,500 70,000 Growth ,000 Source: Hemson Consulting Ltd Figures are rounded. HEMSON
12 10 The reference forecast is considered to be the most likely scenario and is driven by an increased level of in-migration from the economic region centred on Ottawa- Gatineau and Montreal. The high forecast reflects more optimistic expectations about the level of in migration while the low forecast, for illustration purposes, is the forecast prepared by the Ministry of Finance which anticipates a decline in population overall. The reference population forecast is shown graphically below, along with the existing official plan forecasts and the Ministry of Finance forecasts. As can be seen, the forecasts on which the current County official plan is based are proving optimistic: the anticipated 2021 population of 132,700 would not be reached under the Hemson reference forecast until beyond Unlike the official plan or Hemson reference forecast, however, the Ministry of Finance anticipates an overall decline in population. Although the Ministry of Finance (MOF) is forecasting a decline in population, the forecasts are based on a continuation of recent trends and likely underestimate future growth potential. In particular the forecast does not take into account the anticipated increase in levels of in-migration from the Ottawa and Montreal areas. Compared to these two forecasts, the Hemson reference forecast is considered to be a reasonable and appropriate basis for land use planning in the County. HEMSON
13 11 3. Employment Is Forecast to Decline Unlike population, on a County-wide basis including the City of Cornwall, labour force employment is forecast to gradually decline. As shown graphically below, this forecast is unlike those on which the current official plan is based, which anticipated fairly substantial growth. A decline is also forecast for Place of Work employment: approximately 4,500 jobs of which a decline of 1,800 jobs is forecast for the City of Cornwall and the remainder, a decline of 2,700 jobs, are forecast for the municipal County. Employment is forecast to decline under all growth scenarios, including the high forecast. Again, this pattern is driven largely by migration patterns as well as an aging population over the forecast period. While population growth will be driven primarily by in-migration from Ottawa and Montreal, a continued out-commuting of residents to employment opportunities in these locations is anticipated to generate an overall decline in employment. It is important to note again that, although employment is forecast to decline, this does not mean that no new building activity will take place. New investment will continue to occur in the form of retail and related services associated with new housing growth. Some new industrial-type development can also be anticipated to occur in specific areas, particularly in locations with good transportation access. HEMSON
14 12 Forecast Total Employment United Counties of Stormont, Dundas and Glengarry Including the City of Cornwall Table 4 Hemson Forecast Census Year Low Reference High 45,300 46,500 46,700 46,500 45,000 42,200 46,700 45,500 44,600 Growth Source: Hemson Consulting Ltd ,500-2, Housing Forecast Prepared as Input to the Land Capacity Analysis Growth in housing units is of most relevance for the land capacity analysis because many of the settlement area expansions proposed in the 2011 boundary report are to accommodate additional residential development, the notable exception being the proposed expansion in the community of Long Sault, which is for a combination of both employment and residential uses. As shown in Table 5 on the following the page, the Hemson reference population forecast translates into growth of approximately 4,900 housing units in the County area: approximately 2,400 units are forecast for the City of Cornwall and approximately 2,500 units are forecast for municipal Stormont, Dundas and Glengarry. Housing preference is anticipated to remain overwhelmingly for single and semi-detached units, again driven primarily by demand for commuter-related housing from Ottawa and Montreal. Demand for medium and higher-density forms is forecast to be limited. HEMSON
15 13 Hemson Reference Forecast Total Housing Units United Counties of Stormont, Dundas and Glengarry and the City of Cornwall Table 5 Census Years Total Occupied Households City of Cornwall S, D & G (excl. Cornwall) Total 19,000 19,700 20,400 21,200 21,800 22,800 23,800 24,600 25,600 26,300 26,900 28,100 42,800 44,300 46,000 47,400 48,700 50,900 Growth ,400 2,500 4,900 Source: Hemson Consulting Ltd Figures are rounded. C. GROWTH DISTRIBUTED LOCALLY BASED ON PLANNING POLICY AND MARKET DEMAND FACTORS In order to provide the necessary input for the land capacity analysis, the overall County forecast must be distributed to the local municipalities. The first step is the distribution of growth to the local municipalities, based mainly upon the anticipated pattern of in-migration from Ottawa and Montreal. Next, growth is distributed to the settlement areas within the local municipalities based on observed patterns of market demand and planning policy factors. 1. Growth is Distributed to the Local Municipalities Based on Commuting Patterns It is anticipated that migration from the City of Ottawa will continue to be a key driver of growth both in terms of the overall amount and its distribution within the County. Current planning initiatives to limit the amount of new urban lands to accommodate growth in Ottawa may further increase development pressure in the surrounding regional market area, in particular in the western portion of UCSDG. The local municipal housing forecast reflects the anticipation that Ottawacommuter based development pressure will continue in coming decades. The results are shown in Table 6. HEMSON
16 14 Distribution of Hemson Reference Household Forecast to Local Municipalities Within the County Table 6 Total Occupied Households Township Growth North Dundas South Dundas North Stormont South Stormont North Glengarry South Glengarry 4,400 4,400 2,500 4,800 4,300 5,200 5,400 4,900 2,700 5,200 4,400 5,500 1, County Total 25,600 28,100 2,500 Source: Hemson Consulting Ltd Figures are rounded. 2. Growth is Distributed to the Settlement Areas Based on a Combination of Planning Policy and Market Demand Factors The local municipal housing forecast is distributed to the Settlement Areas based on two key considerations: The County official plan, which sets a range of between 80 to 85% of future growth to be directed to the settlement areas, in keeping with provincial policy that also seeks to concentrate growth within the designated settlement areas; Similar to the distribution of growth within the County, the historic pattern of market demand, as measured by building permit information provided by County staff and local municipalities; and Information from the 2011 Settlement Area Boundary, in particular with respect to proposed settlement area expansions; and The shares of development for each settlement area are adjusted to account for the build-out of settlement areas were no expansion is being proposed in the 2011 report. Consideration is also given to shifting broader regional market trends; known development activity in approved plans of subdivision and anticipated development proposals as indicated by municipal staff. The associated population forecast is shown in Table 7 on the following page. HEMSON
17 15 Distribution of Hemson Reference Population Forecast to Local Municipalities Within the County Table 7 Total Population Including the Undercount Township Growth North Dundas South Dundas North Stormont South Stormont North Glengarry South Glengarry 11,800 11,300 7,100 13,200 10,800 13,800 13,500 11,800 7,300 13,200 10,400 13,900 1, County Total 68,000 70,000 2,000 Source: Hemson Consulting Ltd Figures are rounded. As shown, the County is forecast to accommodate only moderate growth in population over the period to The growth is focussed in the municipalities closest to the City of Ottawa, notably North and South Dundas. Population in other municipalities is forecast to remain relatively stable or decline, largely as a result of declining household size and the aging of the population. New households, however, will continue to be added over the period in all municipalities notwithstanding stable or declining population. Similarly, although employment overall is forecast to decline this does not mean that no new building activity will take place. New investment will continue to occur locally in the form of retail and related services associated with new population and housing growth. Some new industrial-type development can also be anticipated to occur, particularly in locations with good road transportation access. The forecast growth by community within each of the local municipalities is then compared to the land supply capacity to reach preliminary conclusions on the appropriateness of current settlement area boundaries. The results of this analysis are discussed in the following chapter. HEMSON
18 16 III LAND SUPPLY AND CAPACITY ANALYSIS This chapter sets out the results of the land supply and capacity analysis, the conclusions of which form the basis for the settlement area boundary revisions described in the following section. The approach to the land supply and capacity analysis and the main conclusions are summarized below. The detailed results are provided in the appendix to this report. A. ANALYSIS OF LAND SUPPLY INDICATES A SIGNIFICANT CAPACITY TO ACCOMMODATE GROWTH Given the PPS as framework for this analysis, as well as the purpose of the study being to determine the appropriateness of settlement area boundaries, the focus of the land supply analysis is on vacant developable lands within the designated settlement areas of the County. 1. Land Supply Identified Through GIS Analysis The first step in the analysis is to measure the vacant residential and non nonresidential land supply. The land supply is based on GIS information provided by UCSDG and is shown in Table 8 below. The land areas shown are the gross or developable land supply excluding only non-developable natural features. Summary Vacant Land Supply United Counties of Stormont, Dundas and Glengarry Table 8 Summary of Vacant Land Supply in Gross Ha Township Residential Employment District Mixed Use and Other Non- Residential Total North Dundas South Dundas North Stormont South Stormont North Glengarry South Glengarry County Total 1, ,040 Source: Hemson Consulting Ltd based on information provided by County Planning Staff. Rural area land supply is excluded. HEMSON
19 17 2. Capacity Estimated Using Density Factors The capacity of the residential land supply is estimated by applying a range of gross densities to the vacant land area to reflect observed densities in urban and rural settings. A density range of between 5 and 9 units per gross ha is used to estimate the unit capacity for a range of rural and urban -type development Generally the densities used are lower than the maximum permitted in the local zoning by-laws, as they are based on typical densities for residential development within rural and urban settlement areas across the County. In our view the maximum densities permitted are unlikely to be achieved on a County-wide basis. As discussed below, the result is a significant potential to accommodate growth. 3. Results Indicate Significant Growth Potential As shown in Table 9 below, applying the density range noted above to the vacant residential land areas shown previously in Table 8 generates a potential to accommodate between 8,100 and nearly 15,000 units, significantly in excess of the forecast housing unit growth over the period to Municipal Unit Demand Vs. Capacity United Counties of Stormont, Dundas and Glengarry Table 9 Township Housing Unit Growth Unit Capacity at Density Range 9 upgh 7 upgh 5 upgh North Dundas South Dundas North Stormont South Stormont North Glengarry South Glengarry ,500 1,700 1,700 4,100 1,700 2,900 2,000 1,300 1,300 3,200 1,300 2,200 1, , ,600 County Total 2,500 14,600 11,300 8,100 Source: Hemson Consulting Ltd based on information provided by County Planning Staff. HEMSON
20 18 As shown, the residential unit capacity exceeds forecast demand in all of the local municipalities. Similarly, the supply of non-residential land also appears to be sufficient to accommodate future demand, given the declining employment forecast. Some employment growth will still occur in relation to population within the designated land supply. While the unit capacity at the County-wide and municipal level is more than sufficient to accommodate demand, there are some localized shortages of residential land supply. In North Dundas, a shortage of between 10 ha and 25 ha in Harmony and a slight potential shortage of 3 ha in Winchester; A shortage of between 3 ha and 9 ha in Williamsburg, South Dundas; A modest potential shortage of 5 ha in Lancaster, South Glengarry. In any event, at a County-wide level, a fairly substantial capacity to accommodate residential growth is indicated. Similarly, the supply of non-residential lands also appears to be sufficient to accommodate growth on a County-wide basis, but some local expansions may be warranted. Such expansions may be appropriate where an interest has been expressed by the local municipalities or where specific development proposals have been advanced. However, as discussed in the next section any changes to the settlement area boundaries need to be considered within the context of a land supply that exceeds the current growth forecast. B. EXCESS SUPPLY MEANS NO OVERALL ADDITION TO THE LAND SUPPLY IS JUSTIFIED Given that a surplus of residential and non-residential land supply is indicated by the analysis, no overall addition to the land supply is justified. However, this does not mean that no changes should be made to the designated land supply. As described in the 2011 Settlement Area Boundary Report (the 2011 Report) there are a number of sound planning reasons for changes to the boundaries. These include: Corrections to mapping errors; Adjustments to better align the settlement area boundaries with property boundary lines; Expansions to accommodate proposed residential developments; Changes to better align development potential with existing or planned servicing capacity; and Expansions to support employment growth and economic development goals. HEMSON
21 19 In total, approximately 600 ha of developable urban lands are proposed to be added. This figure is slightly different from the 800 ha shown in the 2011 Report because it is an estimate of the amount of developable urban lands that are proposed to be added, excluding floodplain or occupied urban area lands. Given the surplus land supply capacity that has been identified, however, it is clear that some of the recommendations made in the 2011 Report will need to be reconsidered in order to ensure consistency with Provincial policy. In particular, the proposed boundary changes need to be adjusted to approach a no net change results. Or in other words, the sum of all boundary changes at the County level needs to be minimal. This approach to rationalizing settlement area boundaries is appropriate because it provides the potential to accommodate new development in suitable locations, while avoiding the over-designation of new urban lands in accordance with the PPS. It also ensures that local municipalities can remain responsive to their own growth and development priorities. HEMSON
22 20 IV SETTLEMENT AREA BOUNDARY REVISIONS Based on the updated growth outlook and land supply analysis, and working with County and Township staff, a number of modifications to the recommendations of the 2011 boundary report have been made and an updated vision for accommodating future growth in the County prepared. The process and resulting settlement area boundary revisions are discussed below. A. AN ITERATIVE AND CONSULTATIVE APPROACH HAS BEEN TAKEN TO RATIONALIZE THE BOUNDARIES In July 2012, the results of the updated forecasts and land supply capacity analysis were presented to County Council along with a preliminary set of options for rationalizing the settlement area boundaries. The options demonstrated a range of approaches to revising the boundaries, ranging from a small number of large adjustments to many small changes. Following the presentation of the preliminary options, County staff undertook a program of consultation with the local municipal staff in order to build consensus on the priority expansions while still achieving a no-net-addition to the urban land supply result. Options that were considered included: Reductions in the urban or rural settlement areas where a surplus in land supply was shown relative to future growth; A declassification of rural settlement areas where very limited growth or stability in population was anticipated over time; and The phasing of development in urban or community policy areas where a surplus of land supply is shown and limited growth is anticipated over the period. Generally the phasing of development was not considered appropriate in the context of the amount of growth anticipated County wide or at the local municipal level. Most of the boundary rationalization was undertaken on the basis of increasing or decreasing settlement area size or through area declassification. HEMSON
23 B. MAPPING AND ADMINISTRATIVE CHANGES ARE TREATED SEPERATELY 21 The review of the 2011 boundary report identified several proposed boundary changes intended to correct mapping or administrative errors made at the time of amalgamation. The County official plan replaces twenty prior municipal plans and associated boundary mapping, not all of which were prepared on a consistent base or standard methods. For the purpose of this analysis, mapping corrections are treated independently of the net land area change impacted by proposed boundary revisions as mapping corrections do not represent expansions of settlement areas within the meaning of the PPS. None of the proposed changes within this category are to accommodate additional development. They are mapping adjustments that result in a more consistent set of settlement area boundaries. C. PREFERRED OPTION BALANCES PLANNING POLICY OBJECTIVES WITH LOCAL PRIORITIES The no net change approach provides the framework for rationalizing the settlement area boundaries in accordance with Provincial policy to prevent the over designation of lands to accommodate growth as well as County policies to encourage growth and focus development within the designated settlement areas. In accordance with the PPS, the focus is on developable urban lands, excluding occupied settlement areas and natural features such as floodplain. The resulting boundaries balance local priorities for future development with Provincial and County policy objectives and establish a clear and consistent vision for the future of the community. The proposed revisions aim to: enable sound development proposals in appropriate locations; promote economic development; limit growth where servicing capacity is limited; maintain the existing rural character where this is a local priority; and generally align future development potential with municipal servicing capacity. The overall result is a net County-wide addition of 42 gross hectares, relating primarily to the proposed boundary changes associated with the Morrisburg settlement area. The boundary changes for each of the local municipalities are described below. A series of maps showing the proposed boundary changes is provided in the appendix to this report. HEMSON
24 22 1. North Dundas The rationalization of settlement area boundaries within North Dundas results in a net addition of 38 ha of designated lands township wide. North Dundas Summary of Proposed Settlement Area Boundary Change Table 10 Settlement Area Harmony Winchester South Mountain Inkerman Mountain Winchester Springs Marionville Chesterville Morewood Hallville Ormond Net Change to Designated Land Supply 28 ha 18 ha 14 ha 1 ha - 12 ha - 11 ha No change No change No change No change No change Township Total 38 ha Source: Hemson Consulting Ltd. based on information provided by the County. Notes: Only settlement areas for which a settlement area boundary change is now proposed are shown. Recommended settlement area boundary changes refer to gross vacant urban developable lands. North Dundas has been under growing development pressure, mainly as a result of its proximity to the City of Ottawa. This trend is anticipated to continue over the planning period to 2031 and beyond. Changes to the settlement area boundaries within North Dundas are proposed primarily in response to Ottawa-based development pressure in the serviced and higher-growth areas, notably the Winchester and Harmony settlement areas. The proposed addition in South Mountain is to accommodate Township uses on municipally owned land. No change is proposed to the remaining settlement areas within the municipality. HEMSON
25 23 2. South Dundas The rationalization of settlement area boundaries within South Dundas results in a net addition of 35 ha of designated lands township wide. South Dundas Summary of Proposed Settlement Area Boundary Change Table 11 Settlement Area Morrisburg 2 Williamsburg Iroquois Dunbar Elma Dundela Hulbert Winchester Springs Glen Stewart Ault Island Irena Glen Becker Hanesville Riverside Heights Stampville Mariatown Brinston Net Change to Designated Land Supply 90 ha 1 ha - 14 ha - 4 ha - 8 ha - 5 ha - 3 ha - 13 ha - 1 ha - 2 ha - 7 ha No change No change No change No change No change No change Township Total 35 ha The major change in South Dundas is the proposed addition of 90 net ha for the settlement area of Morrisburg. The addition is for residential purposes and includes the built area of Mariatown. The proposed expansion takes advantage of existing services and also balances the employment growth anticipated for the employment area being designated in exchange for the removal of Provincially Significant Wetlands (PSW). A number of other settlement area reductions are proposed to offset the addition, including the re-designation of the rural settlement areas of Ault Island and Elma to rural district. 2 Note: The figure for Morrisburg does not include the proposed exchange of additional designated employment lands for lands currently designated employment that have been recently identified as potential Provincially Significant Wetlands (PSW). HEMSON
26 24 3. North Stormont The rationalization of settlement area boundaries within North Stormont results in a net removal of 34 ha of designated lands township wide. North Stormont Summary of Proposed Settlement Area Boundary Change Table 12 Settlement Area Crysler Finch Moose Creek Avonmore Berwick Monkland Net Change to Designated Land Supply 14 ha - 5 ha - 4 ha - 20 ha - 9 ha - 10 ha Township Total - 34 ha A number of revisions to the Crysler settlement area boundaries, resulting in a net addition of 14 ha, are proposed to permit planned residential development and to generally better align the designated land supply with locally preferred locations for growth within the community. Boundary reductions are proposed for a number of other settlement areas to offset the proposed addition. HEMSON
27 25 4. South Stormont The rationalization of settlement area boundaries within South Stormont results in a net addition of 201 ha township wide. South Stormont Summary of Proposed Settlement Area Boundary Change Table 13 Settlement Area Long Sault Eamer s / Rosedale Terrace Ingleside St. Andrews West Ault Island Harrisons Corners Newington Northfield Bonville Osnabruck Centre Lunenburg Beaver Glen Net Change to Designated Land Supply 335 ha 31 ha - 37 ha - 40 ha - 22 ha - 1ha - 14 ha - 2 ha - 17 ha - 9 ha - 22 ha No change Township Total 201 ha The major change in South Stormont is the expansion for residential and employment purposes in Long Sault, already a significant concentration of population and employment within the County. The proposed expansion would achieve the sound planning objectives of concentrating development in areas with full municipal servicing and providing well-located employment land supply to compete for future economic development. A number of settlement area boundary reductions are proposed to offset the addition, but on balance the result is a substantial expansion for the municipality as a whole. This expansion is balanced more broadly in the County by reductions in North and South Glengarry, as discussed below. HEMSON
28 26 5. North Glengarry The rationalization of settlement area boundaries within North Glengarry results in a net removal of 21 ha of designated lands township wide. North Glengarry Summary of Proposed Settlement Area Boundary Change Table 14 Settlement Area Alexandria Dominionville Dunvegan Apple Hill Maxville Glen Robertson Lochiel Dalkeith Glen Sandfield Greenfield Net Change to Designated Land Supply 5 ha 2 ha 2 ha 1 ha - 17 ha - 13 ha No change No change No change No change Township Total - 21 ha A series of relatively minor additions are proposed to the above-noted settlement areas, either to more properly reflect existing property lines or accommodate known development interest. Two somewhat more significant reductions are proposed in the settlement areas of Maxville and Glen Robertson to offset the expansions. HEMSON
29 27 6. South Glengarry The rationalization of settlement area boundaries within South Glengarry results in a net removal of 177 ha of designated lands township wide. South Glengarry Summary of Proposed Settlement Area Boundary Change Table 15 Settlement Area Lancaster Martintown Glen Walter Dalhousie Mills Green Valley Brownhouse Corners Summerstown North Lancaster Glen Nevis Glen Norman Bainesville Summerstown Station Williamstown St. Raphaels Net Change to Designated Land Supply 43 ha 5 ha ha - 7 ha - 16 ha - 15 ha - 35 ha - 4 ha No change No change No change No change No change No change Township Total ha Settlement area boundary expansions are proposed for Lancaster and Martintown, in the case of the former to accommodate known development interests. A small shortage in land supply is indicated for Lancaster at the lower end of the density range, as shown in the Appendix to this report. Substantial reductions in other settlement area boundaries are proposed to offset the proposed expansions, not only within the municipality but more broadly in the County. In particular, significant portions of the Glen Walter settlement area are proposed to be re-designated to rural district. HEMSON
30 28 Summary of Change to Designated Settlement Area Land Supply Preferred Option Settlement Area Boundary Rationalization United Counties of Stormont, Dundas and Glengarry Table 16 Gross Vacant Urban Developable Ha Township Addition of Lands Removal of Lands Net Change North Dundas South Dundas North Stormont South Stormont North Glengarry South Glengarry 80 ha 48 ha 23 ha 432 ha 9 ha 41ha 42 ha 13 ha 57 ha 230 ha 30 ha 218 ha 38 ha 35 ha (34) ha 201 ha (21) ha (177) ha County Total 633 ha 591 ha 42 ha The overall results can be seen in Table 16. On a County-wide basis, the result is an addition of 42 ha which in our view is appropriate within the scope and scale of the revisions that are being proposed. The change is also appropriate in the context of the geographic scale of the County and relatively limited growth projections. As shown in Table 17 on the following page, the rationalization of the settlement area boundaries undertaken as part of this assignment will result in significant revisions to the recommendations in the 2011 boundary report: nearly 600 ha have been removed from expansion consideration. HEMSON
31 29 Summary of Revisions to 2011 Settlement Area Boundary Report Recommendations Table 17 Settlement Area North Dundas Hallville Inkerman Winchester Springs Mountain Winchester South Dundas Iroquois Elma Brinston Williamsburg Ault Island Morrisburg North Stormont Avonmore Berwick Moose Creek South Stormont Ingleside Long Sault Ault Island Northfield St. Andrews West Eamer s / Rosedale Beaver Glen North Glengarry Maxville Glen Robertson South Glengarry Glenwalter Brownhouse Corners Dalhousie Mills Lancaster Green Valley Summerstown 2011 Settlement Area Boundary Report Proposed Change Addition of 25 ha Net addition of 13 ha No boundary change proposed No boundary change proposed No net change proposed Addition of 20 ha Addition of 49 ha Addition of 1 ha Net addition of 11 ha No boundary change proposed No net change No boundary change proposed Net removal of 1 ha Addition of 25 ha Net addition of 13 ha Net addition of 375 ha No boundary change proposed No boundary change proposed Net zero addition Net addition of 90 ha Addition of 15 ha No boundary change proposed No boundary change proposed Net addition of 19 ha Net removal of 15 ha Net removal of 3 ha Net addition of 43 ha Removal of 4 ha No boundary change proposed Revised Recommendation No boundary change proposed Net addition of 1 ha Removal of 11 ha Removal of 12 ha Addition of 18 ha Removal of 14 ha Re-designate to Rural District - removal of 8 ha No boundary change proposed Net addition reduced to 1 ha Re-designate to Rural District - removal of 2 ha Net addition of 90 ha Removal of 6 ha Removal of 8 ha Removal of 4 ha Net removal of 37 ha Net addition of 335 ha Re-designate to Rural District - removal of 22 ha Re-designate to Rural District - removal of 2 ha Net removal of 40 ha Net addition of 31 ha No boundary change proposed Removal of 17 ha Removal of 13 ha Net removal of 144 ha Net removal of 15 ha Net removal of 7.5 ha Net addition of 43 ha Removal of 16 ha Removal of 35 ha County-Wide Net addition of 633 ha Net addition of 42 ha Source: Hemson Consulting Ltd. based on information provided by the County. Notes: Only settlement areas for which a change to recommendation of the 2011 Boundary Report has been made are shown. Recommended settlement area boundary changes refer to gross urban developable lands. HEMSON
32 30 V KEY POLICY RECOMMENDATIONS The forecast, land capacity analysis and assessment of settlement area boundaries give rise to a number of policy recommendations. These relate to the forecasts, the revised settlement areas and intensification and redevelopment. 1. Incorporate Updated Population, Housing and Employment Forecasts The reference forecasts for population, housing and employment that are described in this report should be incorporated into an updated County official plan. The specific tables recommended for inclusion in the updated official plan should include: Table 1 Reference Total Population Forecast; Table 2 Reference Population Distributed by Municipality; Table 3 Projected Housing Unit Requirements; and Table 4 Forecast of Total Employment The allocation of growth to the settlement areas should be undertaken by the local municipalities, giving consideration to local planning objectives and the results of the settlement area revisions undertaken by the County, in consultation with the local municipalities, as part of this assignment. The County plan should note that housing growth is anticipated to occur at a faster rate than population growth as a result of declining household size within the community. The plan should also note that, although employment overall is anticipated to decline, localized growth will continue to occur in the form of new investment in retail and related services associated with new housing growth and industrial-type development in locations with good transportation access. Again, planning to encourage such investment and economic development in specific locations should be undertaken by the local municipalities. HEMSON
33 31 2. Implement the Preferred Option for Revised Settlement Area Boundaries The revised settlement area boundaries described in this report should be incorporated into the County official plan alongside language that the boundaries will be reviewed as part of the next five-year review. The proposed boundaries were determined through a lengthy process of consultation with the local municipalities and, at a County-wide level, achieve a nearly net-zero addition to the designated land supply. The rationalization of the settlement area boundaries achieves a number of sound planning objectives and is consistent with the PPS, in particular the objective to avoid the over-designation of new urban development lands. 3. Provide Direction for Intensification and Redevelopment As described in this report, the forecast housing preference in the County is anticipated to remain strongly focussed on demand for ground-related units, particularly single and semi-detached units. Demand for medium- and higher-density forms is anticipated to be more limited, although some municipalities may achieve higher shares than might be expected based on past trends as a result of specific developments, particularly those geared to older age groups. For the most part, however, demand for new housing units will be driven mainly by ground-related units. As a result, the intensification and redevelopment of existing settlement areas will not play a major role in accommodating growth. Nevertheless, the County should consider putting policies in place to encourage intensification, in accordance with Provincial policy objectives, particularly in the larger urban communities and where expansions are being contemplated. Overall, the County is forecast to accommodate relatively modest growth over the next 20 years, driven mainly by its commuting relationship with the broader regional economy of the City of Ottawa-Gatineau. The analysis of land supply indicates a substantial capacity to accommodate growth, although some localized shortages in the land supply are indicated. An iterative and consultative approach has been taken to rationalize the current settlement area boundaries to nearly a no-net-addition result in order to implement local development priorities while ensuring consistency with Provincial policy objectives. The forecasts and revised boundaries shown in this report should be incorporated into the updated official plan. HEMSON
34 32 APPENDICES Detailed Forecast Results Detailed Results for the Land Supply Capacity Analysis Revised Settlement Area Boundary Mapping HEMSON
35 Detailed Forecast Results

36 Population Age Structure: SDG Total Male Female Total Male Female Total Male Female Total Male Female Total Male Female TOTAL 116,590 57,450 59, ,100 57,430 59, ,400 57,860 60, ,390 58,640 61, ,550 58,980 62, ,900 2,980 2,920 6,270 3,240 3,030 7,070 3,650 3,420 7,460 3,840 3,620 6,880 3,540 3, ,780 2,970 2,810 5,990 2,830 3,160 6,380 3,080 3,300 7,210 3,490 3,720 7,630 3,680 3, ,350 3,250 3,100 5,830 3,140 2,690 6,110 3,050 3,060 6,540 3,310 3,230 7,350 3,710 3, ,140 4,190 3,950 5,290 2,890 2,400 4,620 2,700 1,920 4,850 2,600 2,250 5,240 2,860 2, ,900 3,530 3,370 7,620 3,900 3,720 4,600 2,480 2,120 3,970 2,310 1,660 4,170 2,190 1, ,990 2,990 3,000 7,300 3, ,990 8,090 3,680 4, ,130 2, ,880 4,530 2,080 2, ,880 2,890 2,990 6,570 3,310 3,260 7,950 3,690 4,260 8,840 4,120 4,720 5,980 2,740 3, ,380 3,160 3,220 5,280 2,550 2,730 5,950 2,980 2,970 7,300 3,370 3,930 8,130 3,760 4, ,200 3,590 3,610 6,390 3,220 3,170 5,360 2,690 2,670 6,030 3,110 2,920 7,380 3,500 3, ,600 4,810 4,790 7,740 3,830 3,910 7,030 3,520 3,510 6,120 3,040 3,080 6,820 3,480 3, ,970 5,080 4,890 9,720 4,940 4,780 7,980 4,040 3,940 7,350 3,780 3,570 6,480 3,340 3, ,750 4,330 4,420 9,740 4,890 4,850 9,510 4,750 4,760 7,870 3,930 3,940 7,280 3,690 3, ,460 4,170 4,290 8,740 4,240 4,500 9,750 4,790 4,960 9,590 4,700 4,890 8,030 3,920 4, ,310 3,120 3,190 8,110 3,880 4,230 8,450 3,980 4,470 9,500 4,560 4,940 9,420 4,520 4, ,050 2,410 2,640 5,330 2,700 2,630 7,020 3,430 3,590 7,380 3,570 3,810 8,370 4,120 4, ,850 1,800 2,050 4, ,090 2,370 4,790 2,390 2,400 6,380 3,080 3, ,780 3,250 3, ,960 1,220 1,740 3,100 1,330 1,770 3,680 1,610 2,070 4,040 1,890 2,150 5,430 2,500 2, , ,180 1, ,240 2, ,300 2,570 1,010 1,560 2,880 1,240 1, , , ,240 1, ,410 2, ,580 2, ,910 Population Age Structure: Cornwall Total Male Female Total Male Female Total Male Female Total Male Female Total Male Female TOTAL 48,620 23,330 25,290 49,190 23,500 25,690 49,950 23,850 26,100 50,970 24,320 26,650 51,530 24,520 27, ,570 1,290 1,280 3,100 1,600 1,500 3,320 1,710 1,610 3,270 1,680 1,590 2,860 1,470 1, ,330 1,160 1,170 2,680 1,210 1,470 3,160 1,530 1,630 3,400 1,640 1,760 3,360 1,600 1, ,570 1,300 1,270 2,380 1,290 1,090 2,730 1,310 1,420 3,230 1,640 1,590 3,470 1,760 1, ,200 1,580 1,620 1, ,820 1, ,120 1,090 1,030 2,530 1,390 1, ,150 1,550 1,600 2,720 1,290 1,430 1, , , ,890 1,410 1,480 3,420 1,380 2,040 2,930 1,180 1,750 1, , , ,650 1,320 1,330 3,340 1,660 1,680 3,720 1,560 2,160 3,310 1,400 1,910 2, , ,600 1,270 1,330 2,270 1,110 1,160 3,040 1,500 1,540 3,410 1,410 2,000 2,970 1,230 1, ,710 1,340 1,370 2,640 1,350 1,290 2,310 1,170 1,140 3,090 1,570 1,520 3,460 1,490 1, ,600 1,760 1,840 3,140 1,540 1,600 2,940 1,490 1,450 2,690 1,350 1,340 3,510 1,770 1, ,880 1,950 1,930 3,780 1,920 1,860 3,270 1,650 1,620 3,120 1,630 1,490 2,900 1,520 1, ,510 1,720 1,790 3,820 1,890 1,930 3,710 1,850 1,860 3,240 1,610 1,630 3,090 1,590 1, ,420 1,640 1,780 3,560 1,690 1,870 3,840 1,860 1,980 3,770 1,840 1,930 3,330 1,610 1, ,590 1,240 1,350 3,340 1,550 1,790 3,460 1,600 1,860 3,770 1,780 1,990 3,740 1,780 1, , ,210 2,050 1,050 1,000 2,870 1,360 1,510 2,990 1,430 1,560 3,260 1,600 1, , , ,100 1, ,620 1,230 1,390 2,770 1,310 1, , , , , ,250 1,000 1, , , , , ,
37 Population Age Structure: South Glengarry Total Male Female Total Male Female Total Male Female Total Male Female Total Male Female TOTAL 13,820 7,030 6,790 13,650 6,900 6,750 13,690 6,870 6,820 13,810 6,890 6,920 13,870 6,860 7, , , , , , , , , , , , , , , , , , , , , Population Age Structure: North Glengarry Total Male Female Total Male Female Total Male Female Total Male Female Total Male Female TOTAL 10,760 5,310 5,450 10,580 5,220 5,360 10,490 5,170 5,320 10,480 5,160 5,320 10,400 5,100 5,

38 Population Age Structure: South Stormont Total Male Female Total Male Female Total Male Female Total Male Female Total Male Female TOTAL 13,200 6,710 6,490 13,010 6,620 6,390 13,060 6,590 6,470 13,180 6,620 6,560 13,210 6,630 6, , , , , , , , , , , , , , , , , , , , , Population Age Structure: North Stormont Total Male Female Total Male Female Total Male Female Total Male Female Total Male Female TOTAL 7,110 3,680 3,430 7,200 3,710 3,490 7,230 3,740 3,490 7,280 3,750 3,530 7,250 3,740 3,

39 Population Age Structure: South Dundas Total Male Female Total Male Female Total Male Female Total Male Female Total Male Female TOTAL 11,300 5,600 5,700 11,360 5,570 5,790 11,480 5,580 5,900 11,660 5,630 6,030 11,750 5,650 6, Population Age Structure: North Dundas Total Male Female Total Male Female Total Male Female Total Male Female Total Male Female TOTAL 11,780 5,790 5,990 12,110 5,910 6,200 12,500 6,060 6,440 13,010 6,270 6,740 13,540 6,480 7, , , , , , , , , , , , ,
40 Detailed Results for the Land Supply Capacity Analysis
41 Distribution of Housing Unit Growth and Land Capacity Analysis United Counties of Stormont, Dundas and Glengarry North Dundas 2011 to 2031 Total Housing Unit Growth 975 Share Allocated to Settlement Areas 85% Settlement Area Housing Unit Growth 829 Gross Ha Req't Based on Density Range UPGH Gross Ha Supply Gross Ha Surplus or (Short) at Density Range UPGH Settlement Areas Permits Share Permits Share Forecast Units Chesterville % 20% Winchester 67 24% 50% (3) Hallville 6 2% 5% Harmony 52 19% 20% (25) (16) (10) Inkerman 2 1% 1% Marionville 3 1% 0% Morewood 6 2% 1% Mountain 1 0% 0% Ormond 8 3% 1% South Mountain 15 5% 1% Winchester Springs 2 1% 1% (0) 0 0 Total % 100% Hemson Consulting Ltd. November 2012
42 Distribution of Housing Unit Growth and Land Capacity Analysis United Counties of Stormont, Dundas and Glengarry South Dundas 2011 to 2031 Total Housing Unit Growth 457 Share Allocated to Settlement Areas 85% Settlement Area Housing Unit Growth 389 Gross Ha Req't Based on Gross Ha Gross Ha Surplus or (Short) at Density Range UPGH Supply Density Range UPGH Settlement Areas Permits Share Permits Share Forecast Units Iroquois 43 27% 31% Morrisburg 67 42% 42% Williamsburg 24 15% 15% (8.6) (5.3) (3.4) Dixons Corner 1 1% 1% Dunbar 1 1% 1% Elma 1 1% 1% Glen Becker 1 1% 1% Hanesville 1 1% 1% Dundela 2 1% 1% Mariatown 11 7% 5% Riverside Heights 5 3% 3% Stampville 2 1% 0% Hulbert % 0% Winchester Springs 0 0% 0% Glen Stewart 0 0% 0% Ault Island 0 0% 0% Irena 0 0% 0% Brinston 0 0% 0% Total % 100% Hemson Consulting Ltd. November 2012
43 Distribution of Housing Unit Growth and Land Capacity Analysis United Counties of Stormont, Dundas and Glengarry North Stormont 2011 to 2031 Total Housing Unit Growth 193 Share Allocated to Settlement Areas 85% Settlement Area Housing Unit Growth 164 Gross Ha Req't Based on Gross Ha Gross Ha Surplus or (Short) at Density Range UPGH Supply Density Range UPGH Settlement Areas Permits Share Permits Share Forecast Units Crysler 14 23% 25% Finch 11 18% 20% Moose Creek 25 42% 42% Avonmore 8 13% 10% Berwick 2 3% 3% Monkland 0 0% 0% Total % 100% Hemson Consulting Ltd. November 2012
44 Distribution of Housing Unit Growth and Land Capacity Analysis United Counties of Stormont, Dundas and Glengarry South Stormont 2011 to 2031 Total Housing Unit Growth 364 Share Allocated to Settlement Areas 85% Settlement Area Housing Unit Growth 309 Gross Ha Req't Based on Gross Ha Gross Ha Surplus or (Short) at Density Range UPGH Supply Density Range UPGH Settlement Areas Permits Share Permits Share Forecast Units Ingleside 86 23% 23% Long Sault % 52% St. Andrews 11 3% 3% Ault Island 11 3% 3% Beaver Glen 38 10% 10% (0) 1 2 Eamersrosedale 30 8% 8% Harrisons Corner 2 1% 0% Newington 2 1% 1% Northfield 2 1% 1% Bonville 1 0% 0% Osnabruck Centre 0 0% 0% Lunenburg 0 0% 0% Total % 100% Hemson Consulting Ltd. November 2012
45 Distribution of Housing Unit Growth and Land Capacity Analysis United Counties of Stormont, Dundas and Glengarry North Glengarry 2011 to 2031 Total Housing Unit Growth 127 Share Allocated to Settlement Areas 85% Settlement Area Housing Unit Growth 108 Gross Ha Req't Based on Gross Ha Gross Ha Surplus or (Short) at Density Range UPGH Supply Density Range UPGH Settlement Areas Permits Share Permits Share Forecast Units Alexandria 18 60% 63% Maxville 10 33% 33% Dominionville 1 3% 3% Lochiel 1 3% 0% Dalkeith 0 0% 0% Dunvegan 0 0% 0% Glen Robertson 0 0% 0% Glen Sandfield 0 0% 0% Apple Hill 0 0% 0% Greenfield 0 0% 0% SA Total % 100% Hemson Consulting Ltd. November 2012
46 Distribution of Housing Unit Growth and Land Capacity Analysis United Counties of Stormont, Dundas and Glengarry South Glengarry 2011 to 2031 Total Housing Unit Growth 385 Share Allocated to Settlement Areas 85% Settlement Area Housing Unit Growth 327 Gross Ha Req't Based on Gross Ha Gross Ha Surplus or (Short) at Density Range UPGH Supply Density Range UPGH Settlement Areas Permits Share Permits Share Forecast Units Glen Walter % 51% Lancaster 22 11% 30% (4) 2 5 Dalhousie 1 0% 0% Glen Nevis 2 1% 1% Glen Norman 1 0% 0% (0) (0) 0 Bainesville 7 3% 3% Green Valley 2 1% 1% Brown House 1 0% 0% Martintown 2 1% 1% Summerstown 20 10% 10% Summerstown Station 1 0% 0% Williamstown 4 2% 2% St. Raphaels 0 0% 0% North Lancaster 0 0% 0% Total % 100% Hemson Consulting Ltd. November 2012
47 Revised Settlement Area Boundary Mapping
48 North Dundas


49 NET CHANGE TO DESIGNATED LAND SUPPLY Addition of 28 Ha (Gross Developable)


50 NET CHANGE TO DESIGNATED LAND SUPPLY Addition of 1 Ha (Gross Developable)


51 NET CHANGE TO DESIGNATED LAND SUPPLY Addition of 18 Ha (Gross Developable)
52 NET CHANGE TO DESIGNATED LAND SUPPLY Addition of 14 Ha (Gross Developable)
53 NET CHANGE TO DESIGNATED LAND SUPPLY Removal of 12 Ha (Gross Developable)
54 NET CHANGE TO DESIGNATED LAND SUPPLY Removal of 11 Ha (Gross Developable)
55 South Dundas

56 NET CHANGE TO DESIGNATED LAND SUPPLY Removal of 4 Ha (Gross Developable)


57 NET CHANGE TO DESIGNATED LAND SUPPLY Removal of 3 Ha (Gross Developable)


58 NET CHANGE TO DESIGNATED LAND SUPPLY Removal of 1 Ha (Gross Developable)


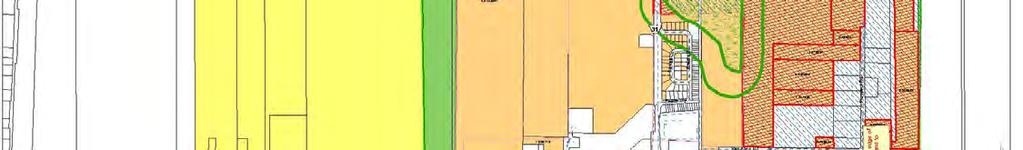


59 NET CHANGE TO DESIGNATED LAND SUPPLY Addition of 90 Ha (Gross Developable)


60 NET CHANGE TO DESIGNATED LAND SUPPLY Addition of 1 Ha (Gross Developable)


61 NET CHANGE TO DESIGNATED LAND SUPPLY Removal of 14 Ha (Gross Developable)
62 NET CHANGE TO DESIGNATED LAND SUPPLY Removal of 5 Ha (Gross Developable)
63 NET CHANGE TO DESIGNATED LAND SUPPLY Removal of 13 Ha (Gross Developable)
64 NET CHANGE TO DESIGNATED LAND SUPPLY Removal of 7 Ha (Gross Developable)
65 North Stormont


66 NET CHANGE TO DESIGNATED LAND SUPPLY Addition of 14 Ha (Gross Developable)

67 NET CHANGE TO DESIGNATED LAND SUPPLY Removal of 5 Ha (Gross Developable)


68 NET CHANGE TO DESIGNATED LAND SUPPLY Removal of 4 Ha (Gross Developable)
69 NET CHANGE TO DESIGNATED LAND SUPPLY Removal of 10 Ha (Gross Developable)


70 NET CHANGE TO DESIGNATED LAND SUPPLY Removal of 20 Ha (Gross Developable)


71 NET CHANGE TO DESIGNATED LAND SUPPLY Removal of 9 Ha (Gross Developable)
72 South Stormont


73 NET CHANGE TO DESIGNATED LAND SUPPLY Removal of 1 Ha (Gross Developable)
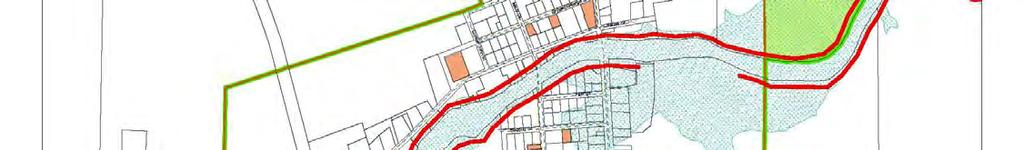
74 NET CHANGE TO DESIGNATED LAND SUPPLY Addition of 335 Ha Addition of 335 Ha (Gross Developable)


75 NET CHANGE TO DESIGNATED LAND SUPPLY Addition of 31 Ha (Gross Developable)
76 NET CHANGE TO DESIGNATED LAND SUPPLY Removal of 37 Ha (Gross Developable)


77 NET CHANGE TO DESIGNATED LAND SUPPLY Removal of 40 Ha (Gross Developable)


78 NET CHANGE TO DESIGNATED LAND SUPPLY R l f 14 H Removal of 14 Ha (Gross Developable)


79 NET CHANGE TO DESIGNATED LAND SUPPLY Removal of 22 Ha (Gross Developable)


80 NET CHANGE TO DESIGNATED LAND SUPPLY Removal of 9 Ha (Gross Developable)
81 NET CHANGE TO DESIGNATED LAND SUPPLY Removal of 17 Ha (Gross Developable)
82 North Glengarry


83 NET CHANGE TO DESIGNATED LAND SUPPLY Addition of 5 Ha (Gross Developable)


84 NET CHANGE TO DESIGNATED LAND SUPPLY Addition of 2 Ha (Gross Developable)


85 NET CHANGE TO DESIGNATED LAND SUPPLY Addition of 1 Ha (Gross Developable)
86 NET CHANGE TO DESIGNATED LAND SUPPLY Addition of 2 Ha (Gross Developable)


87 NET CHANGE TO DESIGNATED LAND SUPPLY R l f 17 H Removal of 17 Ha (Gross Developable)
88 NET CHANGE TO DESIGNATED LAND SUPPLY Removal of 13 Ha (Gross Developable)
89 South Glengarry


90 NET CHANGE TO DESIGNATED LAND SUPPLY Addition of 43 Ha (Gross Developable)
91 NET CHANGE TO DESIGNATED LAND SUPPLY Addition of 5 Ha (Gross Developable)
92 NET CHANGE TO DESIGNATED LAND SUPPLY Removal of 15 Ha (Gross Developable)
93 NET CHANGE TO DESIGNATED LAND SUPPLY Removal of 4 Ha (Gross Developable)


94 NET CHANGE TO DESIGNATED LAND SUPPLY Removal of 147 Ha (Gross Developable)


95 NET CHANGE TO DESIGNATED LAND SUPPLY R l f 7 H Removal of 7 Ha (Gross Developable)


96 NET CHANGE TO DESIGNATED LAND SUPPLY Removal of 16 Ha (Gross Developable)


97 NET CHANGE TO DESIGNATED LAND SUPPLY Removal of 35 Ha (Gross Developable)