W t a er Q l ua it lit y
|
|
|
- Anabel Hensley
- 5 years ago
- Views:
Transcription

1 Wt Water Quality
2 SKG report content Regulatory related issues Phosphorus criterion Active lawsuits and resulting WQ actions Numerous approaches for studying Surface water chemistry Soil nutrient conditions Periphyton responses Vegetation ti change And many others
3 Methods for securing water quality conditions compatible with restoration goals for a natural system that was inherently extremely nutrient poor, particularly with respect to phosphorus. (NRC Component 4). Knowledge Gained Regarding Everglades Water Quality Ecological Impacts of Water Quality Nutrients in Lake Ecosystems: Lake Okeechobee Sediments Nutrients in Marsh Ecosystems: Phosphorus Nutrients in Estuarine Ecosystems: Algal Blooms Periphyton Water Quality Relationships Mercury in the Everglades: ld The South Florida Mercury Bioaccumulation Module and the Mercury Monitoring and Assessment Program Sulfur in the Everglades Copper in the Everglades Copper Contamination in Florida Apple Snails (Pomacea paludosa) Other Contaminants in the Everglades 3.2 Technologies to Achieve Water Quality Structural Technologies: Stormwater Treatment Areas Phosphorus related Biogeochemical Processes in Ridge and Slough Landscapes
4 200 Nutrient Thresholds Surface Water Chemistry 1 Water colu umn phosph horus (µg L - TP) cattail becomes dominant cattail invasion of sloughs 100 changes in: - periphyton species composition 80 - invertebrate species composition - microbial enzyme activity 60 - plant and periphyton P content - sediment phosphorus content Distance from canal (km)
5
6
7
8 Indicators of Ecosystem Restoration ti
9 SKG report content t Level playing field with Conceptual Ecological Models Structured process to develop selection criteria Communication tools Translation for management purposes
10 Retention, improvement, and expansion of the full range of habitats by preventing further losses of critical wetland and estuarine habitats and by protecting lands that could usefully be part of the restored ecosystem. (NRC Component 5). Ecological Indicators CERP System wide Indicators Alligators (Alligator mississippiensis) Wading Birds Oysters Prey Fish Tree Islands and Everglades Restoration Oligohaline and Mesohaline Habitat, Southern Estuaries CERP Module specific Ecological Indicators Lake Okeechobee Northern Estuaries Greater Everglades Southern Coastal Systems The Significance of Oligohaline and Mesohaline Habitat in the Southern Coastal Systems Ecological Implications of Restoring Freshwater Flows to Florida Bay
11 What and the Why drivers stressors critical linkages ecological attributes
12 1. Is the indicator relevant to the ecosystem and does it respond to variability at a scale that makes it applicable to the entire system or an important portion of it? 2. Is the indicator feasible to implement (i.e. is someone already doing it?) 3. Is the indicator sensitive to system drivers? 4. Is the indicator interpretable in a common language? 5. Are there situations where an optimistic trend in the indicator might suggest a pessimistic restoration trend? 6. Are there situations where a pessimistic trend in the indicator may be unrelated to restoration? 7. Is the indicator scientifically defensible? 8. Can clear measurable targets be established for the indicator to allow for evaluation of success? 9. Does the indicator have enough specificity to be able to be used to correct or redirect restoration actions? 10. Does the suite of indicators cover the critical range of ecosystem features including processes and structures? 11. Is the indicator integrative?
13 System wide (a spatial and temporal context) Periphyton responds to environmental drivers very rapidly at both small and large spatial scales Crocodilians respond more slowly to environmental drivers and at larger spatial scales


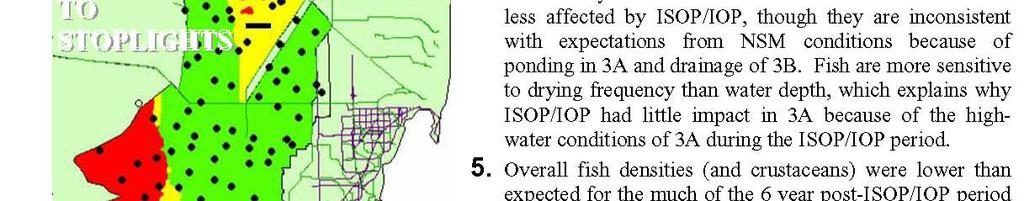


14 Report Card for the Everglades -translating translating data into information into technically-sound y stoplights p g


15 Stressor metric Target Management Action OPTION 1 Management Action OPTION 2 Management Action OPTION 3 Salinity Salinity range of ppt Change operations to meet flows Recruitment Presence Absence adults and larvae Stock larvae Stock adults Operations to avoid too much or too little flow in key months Substrate Acres of Suitable habitat Add oyster shell cultch Try different substrate e.g., concrete Dredge muck