Gaining Momentum, Towards Breakthroughs
|
|
|
- Alexina Cunningham
- 5 years ago
- Views:
Transcription
 Natural Resources Defense Council")
1 PITI Annual Assessment Institute of Public & Environmental Affairs (IPE) Natural Resources Defense Council (NRDC) 1
2 Institute of Public & Environmental Affairs (IPE) The Institute of Public & Environmental Affairs (IPE) is a registered non-profit environmental research organization based in Beijing. Since its establishment in May 2006, IPE has developed the China Pollution Map Database ( as well as the Blue Sky Map, the first Chinese environmental mobile app to track real-time pollution data, which went online on June IPE works to promote environmental information disclosure, public participation, and advance sound environmental governance strategies. Natural Resources Defense Council (NRDC) NRDC is a non-profit international environmental organization with more than 1.4 million members and supporters. Since 1970, NRDC lawyers, scientists, and other environmental specialists have worked to protect the world s natural resources, public health, and environment. NRDC conducts work in the U.S., China, India, Canada, Mexico, Chile, Costa Rica, the EU, and other countries. For more information please see NRDC s website at www. nrdc.cn. Authors: Institute of Public & Environmental Affairs (IPE): Ma Jun, Ruan Qingyuan, Guo Ye, Ying Shan, Liu Qi, Huang Yali, Kate Logan Natural Resources Defense Council (NRDC): Wang Yan, Wu Qi, Zhang Xiya, Gao Yuhe, Aily Zhang, Annie Wang Colleagues from Green Anhui, Shandong Green Qilu, Green Home of Fujian, Nanjing Green Stone, and Green Jiangxi contributed to the to the assessment of their provinces. Nanjing University conducted analyses on 25 cities. English Translation: Annie Wang, Aily Zhang, and Yuhe Gao. IPE and NRDC would like to thank the following colleagues for the translation review and proofreading: Ying Shan, Kate Logan. IPE and NRDC would also like to thank the following individuals for their review, advice, assessment, and guidance in the production of this paper: Jia Feng, Wang Hua, Ling Yue, Wang Xixin, Wang Canfa, Yang Sujuan, Zhu Xiao, Hu Jing, Shi Jinghua, Liu Jiannong, Xie Xiaocheng, Zhao Zheng, Qian Jingjing, Guo Hongyan IPE and NRDC would also like to thank the following partners and volunteers for their support and assistance in the production of this report: Li Jingyan, Li Fei, Zhang Jingning, Guo Yongqi, Yu Yinghan, Li Jintao 2
3 Annual PITI Assessment Table of Contents Foreword...1 Executive Summary...3 Chapter 1. Assessment Objectives, Scope, and Procedure...9 Assessment Objectives...9 Assessment Scope...9 Assessment Procedure...10 Chapter 2. Assessment Results...11 Section 1: Overall Scores And Rankings...11 Section 2: PITI Score Comparison for Similar Regions And Cities Score Comparison of Average Scores Regions Provinces Score Comparison for the Four Municipalities Score Comparisons for Provincial Capitals Score Comparisons for Major Geographic Regions Score Comparison for Cities within Provinces...19 Chapter 3. Assessment Findings...20 Section 1: Subcategory Assessments Routine Violation Records for Excessive Emissions Self- of Pollution Sources Interactive Responses Emissions Data Environmental Impact Assessment (EIA) Information...43 Section 2: Top-Ranking Cities...46 Chapter 4 Policy Recommendations...48 Appendix 1: Assessment Standards...51 Appendix 2: Visual Comparison Of The Annual Scores For All Evaluated Cities (Organized By Province)
4 4
5 Annual PITI Assessment Annual PITI Assessment Foreword Since 2009, the Pollution Information Transparency Index (PITI) has been used to evaluate over 100 key Chinese cities on their respective performance of pollution information disclosure. Over the years, we have seen historic developments in environmental information disclosure in China, comprised of gradual progress through most years and giant leaps in particular years. This track record of improvements presents itself at a crucial point for boosting new progress and breakthroughs in environmental information disclosure practices across the country. Gaining momentum means we are accumulating power from a vast variety of sources and making equal efforts to prepare for new advancements and breakthroughs. In the assessment period, several important pieces of environmental protection legislation and policies went into effect in close succession. These include the newly revised Environmental Protection Law, amendments to the Air Pollution Prevention and Control Law (the New Air Law ), the Water Pollution Prevention and Control Action Plan ( Water Ten ), and the Soil Pollution Prevention and Control Action Plan ( Soil Ten ). Along with current efforts to vigorously implement the Air Ten action plan, the fundamental principle behind these recent pieces of legislation is the need for strict regulation of pollution sources. The ability for the government and the public to effectively supervise polluters is closely dependent on sufficient disclosure of pollution source monitoring information. Based on an understanding of this key concept, and drawing from best practices in air quality information disclosure, the revised Environmental Protection Law sets clear requirements for prefecture level cities to disclose a Directory of Key Pollution-Discharging Entities. The New Air Law goes a step further, clearly stipulates that the key pollution-discharging entities that fall under the law s requirements must install automatic monitoring devices and disclose this data to the public. Once these laws are implemented, current key state-monitored enterprises will no longer be the only source of emissions data. Instead, the provincial- and city-level key pollution sources are also required to disclose emissions data. With preparation already made for implementing completed legislation, more regions are gradually beginning to enact the law s requirements. Out of 338 prefecture-level cities, 146 cities have already published their own Directory of Key Pollution-Discharging Entities, including 22,022 different types of pollution sources. This figure is nearly three times more than the number of state-monitored pollution sources located in these cities. Adhering to stipulations of the relevant laws and expanding information disclosure practices creates massive potential for new breakthroughs. 1
6 Towards breakthroughs refers to the fact that although the preparation is not yet fully complete, there exists increasing potential for accomplishing huge breakthroughs in environmental information disclosure in China. Throughout the assessment process, we discovered that 192 cities have not disclosed their respective Directory of Key Pollution-Discharging Entities. The disclosed directories also vary in quality. Together with several partners across the country, such as Green Qilv, Green Taihang, and Wuhu Ecological Center, we have collectively helped 19 cities disclose their respective directories, and prompted the city of Yichang to revise its 2016 Annual Directory of Key Pollution-Discharging Entities. However, an even larger gap exists in the level of information disclosure from entities listed in the directories. A limited number of entities have disclosed their real-time automatic monitoring data. If the first round of breakthroughs can be achieved, environmental big data platforms will benefit a great deal. This will not only help the public to closely monitor polluters, but can also aid in the effectiveness of market mechanisms, including green supply chain, green finance, and green consumption. Such progress will provide tremendous momentum toward implementing pollution governance and promoting environmentally-friendly development in China. During periods of preparation and waiting, we cannot let the tremendous momentum die out. Otherwise, this historic opportunity for environmental protection will be lost. The State Council requires promoting environmental information disclosure. Prime Minister Li Keqiang remarked, In China, over 80% of our country s data are in the hands of government departments at all levels. To keep all this data deeply hidden is a true waste. The Ministry of Environmental Protection (MEP) also has continuously emphasized the importance of information disclosure, and has set out to directly manage local provincial monitoring and supervision departments to increase the disclosure of online data monitoring data, project inspections, law enforcement inspections, and other law enforcement information. All of these improvements imbue us with confidence for the future. The path to environmental information transparency is still long and full of obstacles, but the break of dawn is already within sight. 2

7 Annual PITI Assessment Executive Summary Since 2009, the Institute of Public & Environmental Affairs (IPE) and the Natural Resources Defense Council (NRDC) have partnered to evaluate 120 key cities for environmental protection on their disclosure of pollution information. In this year s assessment, we added a new criterion to assess cities called of Key Pollution-Discharging Entities. This addition has resulted in a total of 10 criteria being used in our ranking system. Noticeable Improvements Noticeable Improvement 1: The top seven cities all scored over 70 points, showing that advanced regions have improved their mechanisms for information disclosure The success in rankings achieved by these seven cities is the result of implementing advanced systems of information disclosure. During this assessment period, Beijing, Hangzhou, Qingdao, Ningbo, Wenzhou, Guangzhou, and Jiaxing on average scored relatively high for each of the 10 criteria. This year is the first year since the assessment criteria were tightened in 2013 that the total scores of any city reached or exceeded 70 points. This is also the first year that Beijing, with a score of 77.1 points, placed at the top of the overall rankings. These seven cities include four cities in Zhejiang province, and one city in Shandong province and Guangdong province respectively. Figure 1: Cities with 70 Points or More 3
.")
8 Noticeable Improvement 2: of routine supervision records shows outstanding improvement Since the establishment of the Pollution Map Database in 2006, IPE has collected routine supervision records of pollution sources published by local Environmental Protection Bureaus (EPBs). By 2015, the database consisted of 250,000 routine supervision records with 48,000 of them collected in 2015, accounting for 19.2% of the total records in the past 10 years. This notable improvement in our database is due mostly to the high information transparency in such outstanding regions as Zhejiang, Shandong, and others that already established their pollution information disclosure systems. The figure below shows the 2015 statistics for the disclosure of supervision records for each city. Figure 2: Data on Routine Environmental Supervision Records Collected by the Pollution Map Database in Noticeable Improvement 3: Significant improvement of automatic monitoring data disclosure elicits the polluting enterprises blacklist from MEP A total of 31 provinces (including provincial-level municipalities and autonomous regions, excluding Tibet) have established unified information disclosure platforms. Our previous three assessments have shown that following three years of steady progress, these cities have greatly improved their disclosure of automatic monitoring data. 1. The figure includes data points up through the end of July

9 Annual PITI Assessment In May 2016, MEP released the Directory of Key State-Monitored Enterprises in Violation of Polluting Limits in the First Quarter of 2016 List of Key State-Monitored Enterprises in Severe Violation of Pollutant Discharge Limits in the First Quarter of Included in the list of severe polluters are 95 key state-monitored enterprises whose daily average emissions values exceeded standards 80% or more of the time. This is the first time the MEP used automatic monitoring data to create a blacklist of polluting enterprises and shared it with the public. Figure 3 Map of Key State-Monitored Enterprises in Violation of Emission Limits in the First Quarter of 2016 Key Shortcomings Shortcoming 1: Information disclosure in different regions shows signs of the Matthew Effect and the overall average scores have not yet reached over half of the total points possible. The top three cities on the index have an average score of 75.9 points out of 100, and the last three cities on the index have an average score of The difference between the two average scores is Last year s difference between the highest scoring cities and the lowest scoring cities was The score difference is increasing, despite the fact that the scores earned by the top ranking cities continue to increase year-by-year. 5


10 Figure 4: Scores of the Top Three and Bottom Three Cities Considering the distribution of scores of the cities evaluated, there were only 21 cities out of 120 cities that obtained over 60 points, only accounting for 17.5%. Over half of the evaluated cities have a score lower than 50 points out of 100 points and six cities obtained a score lower than 30 points. The lower scores counteract the advanced information disclosure practices of the top-scoring cities, causing the average scores of all 120 cities to fall down to 49.6 points. This average score shows a significant difficulty in the ability of these regions to effectively satisfy the public s right to environmental information. Figure 5: Score Distribution of the 120 Evaluated Cities 6

11 Annual PITI Assessment Shortcoming 2: Self disclosure platforms and data quality have yet to be perfected and improved. This year s assessment shows that 29 of the assessed provinces have already established a platform for information disclosure of key pollution sources. These platforms are aimed at displaying the emissions monitoring data from key pollution sources, especially automatic monitoring data of key state-monitored pollution sources. However, there are large gaps between the scores of different regions. Discrepancies are in large part due to Chongqing and Shanxi, two regions that have not completely implemented the country s requirement for automatic monitoring data disclosure. Additionally, the data uploading of nine provinces, which includes Inner Mongolia, Tianjin, Hunan, and Sichuan, generally lags behind by 24 hours or more. The delayed disclosure of automatic monitoring data hinders the public from accessing data in a timely manner. Delayed disclosure also prevents the public from carrying out their role as watchdogs for pollution data, and provides the opportunity for polluters to adjust their data before disclosure. Figure 6: A Map of the Regions Where There is a Delay in Real-Time of Key Pollution Sources Shortcoming 3: There is insufficient leveraging of new media in interactive information disclosure. Of the ten evaluation criteria used in this year s assessment, three criteria involve public engagement. These criteria are Environmental Complaints and Reports Information, Upon Request, and Environmental Impact Assessment (EIA) Information. Through evaluating the scores of several regions, we noticed that many cities need to improve how they engage with the public. In fact, there were a handful of cities that have even failed to include public engagement in their information disclosure practices. For example, for Environmental Complaints and Reports Information, 7


12 ten cities received a score of zero for this criterion, and for Upon Request, two cities also received a score of zero. Figure 7: Score Distribution of the 120 Cities Evaluated for Environmental Complaints and Reports Information and Upon Request 8
13 Annual PITI Assessment CHAPTER 1 Assessment Objectives, Scope, and Procedure Assessment Objectives The scope of this year s assessment is similar to that of those in years past. We evaluated 120 key cities in China on their environmental information disclosure performance. Our partner organizations, including Green Anhui, Shandong Green Qilu, Green Home of Fujian, Green Jiangxi, Lvse Jiangnan Public Environment Concerned Center and Nanjing University evaluated 63 other cities in addition to the 120 cities. This year s PITI assessment evaluated 183 cities total across China. Figure 8 Distribution of PITI Assessment Sites Assessment Scope In this year s assessment, we added a new evaluation criterion, of Key Pollution- Discharging Entities, weighted 6% of the total score. The points allocated to Automatic Monitoring Data and Cleaner Production Audit were adjusted accordingly. This year s evaluation includes ten criteria, organized into five overarching categories: Environmental Supervision Information, Self- of Pollution Sources, Interactive Responses, Enterprise Emissions Data, and EIA Information. 9

14 For specific information on why we chose our evaluation categories, and our data collection timeline, please see Appendix 1. Figure 9: Assessment Scope and Score Distribution Assessment Procedure This year s evaluation procedure was the same as in previous reports. The process included the following steps (also seen depicted in Figure 10 below): 1. Pollution-source data is collected and sorted 2. A preliminary assessment is conducted using the data 3. The data is cross-checked amongst evaluation groups 4. Feedback is sought from the local EPBs assessed 5. Adjustments are made based on verification of the feedback given 6. The final evaluation results and scores are compiled and published Figure 10 Assessment Process 10
15 Annual PITI Assessment CHAPTER 2 Assessment Results Section 1: Overall Scores and Rankings Figure 11: PITI Assessment Results and Rankings for 120 Cities Rank City Total Trend Rank City Total Trend Rank City Total Trend 1 Beijing Xuzhou Zhuzhou Hangzhou Wuxi Changchun Qingdao Shijiangzhuang Chongqing 44 4 Ningbo Tangshan Kunming Wenzhou Wuhu Deyang Guangzhou Zunyi Liuzhou Jiaxing Hefei Jinzhou Jinan Baotou Tongchuan Shaoxing Zigong Xiangtan Suzhou Erdos Xi'an Taizhou Zhenjiang Pingdingshan Xiamen Huzhou Sanmenxia Zhongshan Yinchuan Qiqihar Rizhao Wuhan Yichang Shanghai Jilin Xianyang Yantai Fuzhou Shaoguan Beihai Changzhi Mianyang Shenzhen Changde Jiaozuo Zaozhuang Harbin Lanzhou Shenyang Taian Yuxi Zibo Tianjin Changsha Changzhou Lianyungang Fushun Foshan Taiyuan Jinchang Weihai Urumchi Weinan Nantong Shantou Qujing Yangzhou Yancheng Xining Ma'anshan Yibin Yan'an Jining Quanzhou Luzhou Weifang Jiujiang Mudanjiang Guilin Zhanjiang Zhangjiajie Chengdu Hohhot Anyang Chifeng Baoji Kaifeng Zhuhai Luoyang Panzhihua Nanchang Anshan Yangquan Zhengzhou Yueyang Nanchong Guiyang Qinhuangdao Karamy Nanjing Shizuishan Daqing Dongguan Jinzhou Linfen Dalian Nanning Benxi Handan Baoding Datong
16 Rank City Total Score (100) Figure 12: PITI Assessment Results and Subcategory Scores of Daily Excessive Emissions and Other Violation Records (23) Routine Supervision Records (30) of Enterprise Environmental Performance /Credit Ratings (5) Discharge Fee Break -down (2) Self from Pollution Sources (26) Automatic Monito -ring Data Disclo -sure (20) Informa -tion of Key Polluting Entities (6) Interactive Response (15) Complaints & Reports Infor -mation (7) Disclo -sure Upon Request (8) Emissions Data (14) Emission Data of Key Polluting Enterprises (12) Cleaner Produc -tion Audit Data (2) EIA Information (15) EIA Information Disclosurs 1 Beijing Tianjin Shijiazhuang Tangshan Qinhuangdao Handan Baoding Taiyuan Datong Yangquan Changzhi Linfen Hohhot Baotou Chifeng Erdos Shenyang Dalian Anshan Fushun Benxi Jinzhou Changchun Jilin Harbin Qiqihar Daqing Mudanjiang Shanghai Nanjing (15) 12
17 Annual PITI Assessment Rank City Total Score (100) of Daily Excessive Emissions and Other Violation Records (23) Routine Supervision Records (30) of Enterprise Environmental Performance /Credit Ratings (5) Discharge Fee Break -down (2) Self from Pollution Sources (26) Automatic Monito -ring Data Disclo -sure (20) Informa -tion of Key Polluting Entities (6) Interactive Response (15) Complaints & Reports Infor -mation (7) Disclo -sure Upon Request (8) Emissions Data (14) Emission Data of Key Polluting Enterprises (12) Cleaner Produc -tion Audit Data (2) EIA Information (15) EIA Information Disclosurs 31 Wuxi Xuzhou Changzhou Suzhou Nantong Lianyungang Yangzhou Zhenjiang Yancheng Hangzhou Ningbo Wenzhou Jiaxing Huzhou Shaoxing Taizhou Hefei Wuhu Ma'anshan Fuzhou Xiamen Quanzhou Nanchang Jiujiang Jinan Qingdao Zibo Zaozhuang Yantai Weifang Jining Taian (15) 13
18 Rank City Total Score (100) of Daily Excessive Emissions and Other Violation Records (23) Routine Supervision Records (30) of Enterprise Environmental Performance /Credit Ratings (5) Discharge Fee Break -down (2) Self from Pollution Sources (26) Automatic Monito -ring Data Disclo -sure (20) Informa -tion of Key Polluting Entities (6) Interactive Response (15) Complaints & Reports Infor -mation (7) Disclo -sure Upon Request (8) Emissions Data (14) Emission Data of Key Polluting Enterprises (12) Cleaner Produc -tion Audit Data (2) EIA Information (15) EIA Information Disclosurs 63 Rizhao Weihai Zhengzhou Kaifeng Luoyang Pingdingshan Anyang Jiaozuo Sanmenxia Wuhan Yichang Jingzhou Changsha Zhuzhou Xiangtan Yueyang Changde Zhangjiajie Guangzhou Shaoguan Shenzhen Zhuhai Shantou Foshan Zhanjiang Zhongshan Dongguan Nanning Liuzhou Guilin Beihai Chongqing (15) 14
19 Annual PITI Assessment Rank City Total Score (100) of Daily Excessive Emissions and Other Violation Records (23) Routine Supervision Records (30) of Enterprise Environmental Performance /Credit Ratings (5) Discharge Fee Break -down (2) Self from Pollution Sources (26) Automatic Monito -ring Data Disclo -sure (20) Informa -tion of Key Polluting Entities (6) Interactive Response (15) Complaints & Reports Infor -mation (7) Disclo -sure Upon Request (8) Emissions Data (14) Emission Data of Key Polluting Enterprises (12) Cleaner Produc -tion Audit Data (2) EIA Information (15) EIA Information Disclosurs 95 Chengdu Zigong Panzhihua Luzhou Deyang Mianyang Nanyang Yibin Guiyang Zunyi Kunming Qujing Yuxi Xi'an Tongchuan Baoji Xianyang Weinan Yan'an Lanzhou Jinchang Xining Yinchuan Shizuishan Urumqi Karamy (15) 15

20 Section 2: PITI Score Comparison for Similar Regions and Cities Compared to last year s results, the scores of several cities this year have improved, while the scores of some other cities declined. 34 cities saw their scores decrease, with five cities seeing a score decrease of more than ten points. 2 Eight cities saw a score increase of more than 20 points. In total, 21 cities in this year s assessment period scored above 60 points Score Comparison of Average Scores across Provinces This assessment calculates the average scores of 29 different provinces (including province-level municipalities) by averaging the scores of each city within the separate provinces. Beijing ranks at the top of the list, with a score of 77.1 points. This is the first time that Beijing surpassed Zhejiang Province, which scored 68.6 points this year. Shanghai ranks third, while Shandong ranks fourth. 4 Figure 13: Comparison of PITI Average Annual Scores across Provinces Out of the 29 provinces evaluated, 23 provinces showed score increases. Guangdong, Qinghai, Yunnan, Xinjiang, and Beijing exhibited the greatest score increases. On the other hand, Fujian, Jiangsu, Gansu, Shaanxi, Hunan, and Anhui all exhibited a slight decrease in their respective average scores. 2. Nanjing, Lianyungang, Yancheng, Quanzhou, and Kaifeng 3. Zhongshan, Rizhao, Zhuhai, Guangzhou, Shantou, Zhengzhou, Dayuan, Chifeng 4. Tibet, Hainan, Hong Kong, Macao, and Taiwan were not included in the evaluation 16
21 Annual PITI Assessment Figure 14: Top Five Provinces with Highest Score Increases & Five Provinces with Largest Score Decreases 12 sites saw their ranking rise compared with last year, while five sites did not experience a change in rank. Another 12 sites dropped in the rankings. Out of the five provinces that saw the greatest increase in their respective rankings, Guangdong province went from 20th place last year to 5th place this year, which is an increase of 15 spots. Out of the provinces that saw the most significant drop in rankings, Gansu went from 18th place to 27th place, which is a 9-spot drop. Figure 15: The Top Five Provinces with the Greatest Increase in Rankings, and Provinces with the Most Significant Decrease in Rankings 17


22 2. Score Comparison for the Four Municipalities This is the third year that the four province-level municipalities have not experienced substantial changes in their rankings. Indeed, Beijing has been at the top of the rankings among the four municipalities for three consecutive years. Chongqing, which is located in southwestern China, lost significant points for the following criteria: Enterprise Environmental Credit Ratings, Automatic Monitoring Data, of Key Pollution-Discharging Entities, and Upon Request. This year, Chongqing only scored 44 out of 100 points, resulting in its last place rank amongst the four municipalities. Figure 16: PITI Score Comparison for the Four Province-Level Municipalities 3. Score Comparisons for Provincial Capitals Out of the 25 provincial capital cities evaluated, Hangzhou ranks first with a score of 75.9 points. Guangzhou, Jinan, and Shenyang also received over 60 points each and rank second, third, and fourth, respectively. In this assessment period, the scores of 16 provincial capital cities increased. The score of Guangzhou increased by 25.9 points. Other provincial capital cities with relatively substantial score increases include Taiyuan, Urumqi, and Kunming. Figure 17: Score Comparison for PITI Annual Scores across Provincial Capitals 18
 have improved their respective average scores compared to last year s scores.")
23 Annual PITI Assessment 4. Score Comparisons for Major Geographic Regions Out of the seven major geographic regions, eastern China continues to rank first with an average score of points. According to our calculations, this year the seven districts (taken as a whole) have improved their respective average scores compared to last year s scores. The geographic region with the largest score change was southern China, which saw a score increase of 14.7 points this assessment period. Figure 18: Score Comparison of Average Scores for Major Geographic Regions 5. Score Comparison for Cities within Provinces To see the score comparison of cities within each province, please refer to Appendix 2. 19

24 CHAPTER 3 Assessment Findings Section 1: Subcategory Assessments 1. Routine Supervision Records I. Routine Violation Records for Excessive Emissions and other violations 1.1 Improvement: There has been a large increase in the number of cities disclosing administrative penalty decisions During this PITI assessment period, we saw great improvements in the disclosure of environmental violation cases. An increasing number of regions have created a platform for exposing and then publishing cases of illegal actions in a unified manner. This has been especially true for the publication of administrative penalty records. Out of the 120 evaluated cities, 70 publish administrative penalty records, a 48.9% increase compared with last year. Figure 19: Summary of the of Administrative Penalty Decisions in All 120 Evaluated Cities During the Past Two Years 1.2 Key Shortcoming: A large number of the supervision records remain deeply hidden. In May of this year, while attending the National Conference on Advancing Government Reform and Improving Public Services, China s Premier Li Keqiang pointed out that, In China, over 80% of our country s data is in the hands of government departments at all levels. To keep all this data deeply hidden is true waste. Though environmental protection departments stand as the strongest in terms of information disclosure among all the government departments, the problem Premier Li highlighted remains just as relevant as before and is even more pronounced in certain regions. According to the 2015 China 20
25 Annual PITI Assessment Environmental Bulletin, released on May 20, 2016, by the Ministry of Environmental Protection (MEP), 191,000 enterprises were investigated for violations in For reference, the number of environmental violation records collected by the Blue Map Database during that year was 48,000 as of August 8, Good Practices: Zhejiang implements online disclosure systems for environmental administrative penalties. In this report, the seven cities evaluated in Zhejiang Province scored an average of 68.6 points. When excluding provincial municipalities, Zhejiang ranks number one out of 25 regions. This is the fifth consecutive year that Zhejiang has placed at the top of our rankings. As the leader of environmental information disclosure, Zhejiang continues to innovate, generating new methods for information disclosure. On January 1, 2015, the Provisional Regulation of Zhejiang's Online of Environmental Administrative Penalty Decisions 7 was implemented. The guidelines clearly stipulate the requirements for information disclosure and include such information (in the table below) as the timeline for the publication of administrative penalties for environmental protection violations, the amount of time for which the information shall be disclosed, and the channel for information disclosure. Article 7 (Contents of ): When disclosing information on the results of environmental administrative penalties online, it is permissible to publish the entire text of the administrative penalty records or a summary of such information. Article 9 (Deadline for ): When environmental agencies are issuing or otherwise modifying administrative penalty decisions, they must publish these records on the internet within 20 working days of making these changes. When an environmental administrative decision is revoked, determined to be illegal, or required to be remade, the enforcement agency shall withdraw the environmental administrative decision from the online platform in 5 days and provide explanations. Article 11 (Time for Retaining Information): Administrative penalty results shall be disclosed and available online for five years. Article 12 ( Platform): The environmental agencies shall disclose the information on its web portal or the web portal of the government at the same level. The information shall be disclosed on a specified disclosure platform for corporate environmental credit if such a specified disclosure platform exists. 5. The source of this information is the MEP s 2015 China Environmental Bulletin. t _ shtml (Last visited on August 8, 2016). 6. Portions of noise- and radiation-related violation information is not included in the scope of our Blue Map database. 7. Zhejiang Provincial Environmental Protection Department, Provisional Regulation on Zhejiang's Online of Environmental Administrative Penalty Decisions. ( 21

26 During the evaluation we discovered that, of the seven cities evaluated in Zhejiang Province, Hangzhou, Ningbo, Wenzhou, Huzhou, and Shaoxing met the 20-day deadline for disclosure of administrative penalty decisions. In terms of the Excessive Emissions and Other Violation Records criteria, the scoring rate of the seven cities evaluated in Zhejiang Province was around 79.7%. Wenzhou scored 21.4 out of 30 points. Figure 20: The Scores of the Seven Evaluated Cities in Zhejiang Province for of Daily Excessive Emissions and Other Violation Records II. of Enterprise Environmental Performance/Credit Ratings 2.1 Key Improvement: More cities conducted Enterprise Environmental Credit Ratings and disclosed their results. This year s evaluation scope took into consideration the 2015 publication of the Enterprise Environmental Credit Ratings evaluation results from The evaluation shows that out of 120 evaluated cities, 45 cities published valid Enterprise Environmental Credit Ratings. The publication of these ratings from the 45 cities is definitely an increase from last year, when 38 cities published valid Enterprise Environmental Credit Ratings data New Cities in this year s evaluation: Xiamen, Baoji, Lanzhou, Yinchuan, Chengdu, Zigong, Panzhihua, and Mianyang 22


27 Annual PITI Assessment Figure 21: Comparison between Previous Year s of Enterprise Environmental Credit Ratings inside: last years outside: this years 2.2 Existing Shortcoming: Less than half of cities published their evaluation results while none of the cities published the evaluation criteria. Of the 120 evaluated cities, only 49 published the results of their Enterprise Environmental Credit Ratings evaluation. Of these 49 cities, four cities gained no points due to invalid disclosure for the following reasons: they did not explicitly include the ratings for individual enterprises or they simply published the credit ratings information for environmentally-credible or environmentally-friendly enterprises. Of those cities that disclosed the Enterprise Environmental Credit Ratings evaluation results, few provided concrete criteria of their evaluation. Hunan province, the region that performed the best on this criterion in last year, did not maintain its good practices. This year Hunan simply published the names and ratings of the enterprises without providing the criteria for their evaluation. Figure 22: Summary of Enterprise Environmental Credit Ratings 23

28 III. Discharge Fee Breakdown 3.1 Improvement: An increasing number of cities disclosed complete information about pollution discharge fees. Three more cities compared to last year published their pollutant discharge fee data in this year s assessment, bringing the total to 107 cities. Wenzhou received full marks. The 12 cities that published their pollution discharge fees information and the pollution factors are Ningbo, Wenzhou, Shaoxing, Tangshan, Shenzhen, Anshan, Wuhan, Yangquan, Linfen, Jiaxing, Datong, and Jinzhou. Ningbo, Wenzhou, Shaoxing, Shenzhen, Wuhan, Jiaxing, and Jinzhou disclosed emissions volumes or concentrations. Wenzhou and Wuhan explicitly disclosed information on their excessive emissions discharge fees. Figure 23: Discharge Fee Breakdown 3.2 Shortcoming: Just as with previous assessments, most cities only published the name of the polluting enterprise and the pollution discharge fee amount. Only a minority of cities published the pollution factors and their volume or concentration. An even smaller number of cities published discharge fee data for excessive emissions. 2. Self- from Pollution Sources I. Automatic Monitoring Data of Key Pollution Sources Automatic monitoring systems have transformed traditional environmental monitoring methods. Online automatic systems use of online network communication technology to achieve long-term, continuous and effective monitoring of polluters is an important reflection of the internet + era. According to news reports, the Environmental Supervision Center of the Ministry of Environmental Protection (ESCMEP) receives approximately 3,910,000 pieces of automatic monitoring data per day, including hourly and daily data; 121,750,000 datum points per month; and 1.46 billion datum points per 24
29 Annual PITI Assessment year. 9 The data collectively provides strong support for pollution source supervision and enforcement and allows for robust avenues for public participation. After the release of the Measures on Self-Monitoring and Information for Key State- Monitored Enterprises (for Trial Implementation) in July 2013, each province began building a platform for automatic monitoring information disclosure. Since then, IPE has evaluated the automatic monitoring data disclosure of state-monitored pollution sources (key state-monitored enterprises for wastewater and air emissions, and key-state-monitored sewage treatment plants) for three continuous years Improvement: The rate of disclosure for automatic monitoring data has steadily increased. Automatic monitoring data served as the basis for MEP to issue its first blacklist of polluting enterprises. This period s evaluation assessed disclosed automatic monitoring pollution source data from December The average score of the 120 evaluated cities for automatic monitoring data disclosure was points and the percentage of cities receiving points was 77.8%, an increase of 25.5% compared to the previous year. The main improvements in the disclosure of automatic monitoring data are explained below: Over the past three years, the number of provinces publishing automatic monitoring data has steadily increased. Since the incorporation of automatic monitoring data disclosure into our evaluation three years ago, the number of regions that publish their self-monitoring data has increased. Out of 31 provinces (excluding Tibet), all have created a platform for the publication of automatic monitoring data Figure 24: The Average Scores for Automatic Monitoring Data from the Past Three Years 9. To unveil the secret of counterfeit environmental monitoring data, Yicai Global, (Last visited on July 20, 2016). 10. The same hereinafter. 25

30 Improvements in the ability to obtain automatic monitoring data (measured as B/A ) 11 have been a main factor for the increase in cities average scores in this criteria. In our 2014 evaluation, there were six provinces that had a B/A below 10%. This year, the lowest B/A for this criteria was 22.44% with the average for all 120 cities standing at 94.75%. This year s average score for all 120 cities increased 38.84% when compared to last year s average scores. 12 Figure 25: Average Rate of for Automatic Monitoring Data by Province in December 2014 and December In this current assessment, we use self-monitoring data from each province s platform from December The ratio of B/A represents the self-monitoring information disclosure acquisition rate of each assessed city. A represents the amount of environmental pollutant information that is required to be disclosed, and is calculated as the number of state-monitored enterprises that emit Government-Identified Air Pollutants in any given city assessed in 2015* 24 hours * 31 days + (the number of state-monitored enterprises in any given city for wastewater discharge + the number of sewage treatment plants) * 12 hours * 31 days. B represents the amount of valid automatic monitoring data obtained by the evaluation group. 12. Since a portion of the regions have disclose their wastewater hourly (as opposed to bi-hourly), based on the formula used in our evaluation, the disclosure rate has exceeded 100%. 26
31 Annual PITI Assessment The second reason for the average score increase can be explained by the expansion of automatic monitoring data disclosure of key state-monitored pollution sources in Guangdong, Shanxi, and Yunnan. The expansion of information disclosure was especially true for Shandong and Shanxi. In July 2015, the disclosure platform of Guangdong was found to have changed from merely uploading Excel documents with relevant pollution information to using a web page to disclose real-time automatic monitoring data. For more information, please refer to the Guangdong case in this chapter. This is the first time that the MEP has used online monitoring data as the basis for issuing a blacklist of polluters. In May 2016, MEP released the List of Key State-Monitored Enterprises in Severe Violation of Pollutant Discharge Limits in the First Quarter of The document listed 95 key state-monitored enterprises whose daily average emissions exceeded pollutant discharge limits 80% or more of the time. According to the Notice on the Regular of the List of State-Monitored Enterprises in Violation of Pollutant Discharge Limits, this is the first time that the MEP utilized automatic monitoring data for key state-monitored enterprises to create a blacklist of key state-monitored enterprises that have seriously violated pollutant discharge limits. Provincial platforms respond positively to public supervision, including prompt handling and reply to problems raised by the public. According to statistics from March 2016, there were a total of 14 disclosure platforms that either intermittently crashed or whose data would not update. When our evaluation team found such problems, the team communicated with the platform managers. Based on the communications our staff had with platform managers, most of the issues were operational difficulties such as hardware malfunctions or transmission disruptions. After our team reached out, most of the platforms regained usability and recovered to their usual working capacity. 1.2 Shortcoming: Automatic monitoring data on nine provincial platforms was not disclosed in real-time. The platforms of Chongqing and Shanxi do not include all state-monitored pollution sources. The quality of automatic monitoring data still needs to improve. After three years of promoting positive changes and improvements, 31 provinces (excluding Tibet) have all created their own platforms for publishing and disclosing automatic monitoring data. However, problems still exist within the disclosure systems of key pollution source automatic monitoring data. During inspections and routine supervision investigations, MEP found problems such as data quality, incomplete emissions outlet coverage, improper locating of monitoring stations, incomplete monitoring of all pollutants, haphazardly set polluting limits, and data falsification. The following problems were found throughout this year s evaluation process Explanation of the Guidelines for Self-Monitoring of Pollution-Discharging Entities (draft for comment); working group of the Guidelines for Self-Monitoring of Pollution-Discharging Entities, November
32 A portion of state-monitored pollution sources still have not installed automatic monitoring systems. Of those that have installed automatic monitoring systems, some still have yet to disclose any automatic monitoring data. This year, over the course of evaluating the automatic monitoring data disclosure of 5,345 statecontrolled pollution sources located in the 120 evaluated cities, we found 971 enterprises that have yet to disclose their automatic monitoring data. 14 These 971 enterprises make up 18.85% of the total number of enterprises evaluated (excluding 194 that have ceased production, shut down, or do not fulfill requirements for installing automatic monitoring equipment). 15 Figure 26: Automatic Monitoring Data from Key State-Monitored Pollution Sources Taking Chongqing as an example, when evaluating the city in December 2015, the rate of automatic monitoring data obtained from 224 state-monitored pollution sources was 22.44%. Though this score has increased since last year s evaluation, it still sits far below the average rate of automatic monitoring data disclosure of all 120 evaluated cities, which is 94.75%. For more information, please refer to case % of disclosure platforms consistently exhibit issues with delayed publication of information. According to the statistics from this year s evaluation, of the 29 evaluated provincial disclosure platforms for key state-monitored enterprises automatic monitoring data, the platforms of Inner Mongolia, Tianjin, Jilin, Hubei, Hunan, Sichuan, Heilongjiang, Gansu and Fujian exhibit issues with a time-lag of over 24 hours when disclosing data. These nine provinces encompass 31% of all the evaluated platforms. 14. This primarily refers to state-monitored enterprises that emit air pollutants, state-monitored enterprises that discharge water pollutants, and the state-monitored sewage treatment plants. 15. When compiling these statistics, some data may have been overlooked and our evaluation team strongly invites comments, suggestions and discussion regarding the automatic monitoring data disclose of state-monitored pollution sources. 28

33 Annual PITI Assessment Figure 27: The Timeliness of Automatic Monitoring Data There are increasing amounts of falsified automatic monitoring data. There exists an urgent need for improving the quality of data. At the 2015 National Conference on On-Site Environmental Monitoring, the former Vice Minister of MEP, Wu Xiaoqing, highlighted existing issues with falsified environmental monitoring data. Wu also revealed the importance that the leaders of the country s central government attach to the falsification problem, noting that the agency would take harsh measures to ensure the accuracy of environmental automatic monitoring data. Since 2015, MEP has published three sets of Cases of Pollution Source Automatic Monitoring Equipment and Data Fraud, resulting in a total of 23 cases. These reports include cases of enterprises actively falsifying their own data as well as working with automatic monitoring service providers in order to produce false data. Enterprises falsify automatic monitoring data during data production or data transmission in order to avoid supervision. The completeness and promptness of automatic monitoring data disclosure contributes to the ease with which the public can monitor pollution and assist regulators in identifying false data. However, when automatic monitoring data is not disclosed, the public cannot recognize or supervise the veracity of pollution emissions issues. At the same time, the delayed disclosure of automatic monitoring data allows polluting enterprises to adjust their automatic monitoring data. 1.3 Cases Self-disclosure from key pollution sources in Guangdong province has greatly improved. Since 2014, following the release of the Measures on Self-Monitoring and Information for Key State-Monitored Enterprises (for Trial Implementation), Guangdong Province established an information disclosure portal. However, the data was initially uploaded to the portal by each individual pollution source as an Excel spreadsheet, without providing real-time monitoring data. As a result, during 29


34 the PITI assessments in , Guangdong s evaluated cities only gained 1-4 points for the Automatic Monitoring Data criteria and the average scores of the nine cities evaluated in Guangdong were low, with rankings descending from 2-7 in previous years to However, in July 2015, we found that Guangdong improved its automatic monitoring data disclosure platform for key state-monitored enterprises and began to disclose real-time automatic monitoring data. The acquisition rate of data in Guangdong s nine evaluated cities has increased from 5.89% to 147.8%. The average scores increased from four points last year to 17 points this year. 17 This year, the average score of Guangdong s nine evaluated cities is 56.5 points, puttingguangdong overall in third place out of all the provinces, moving up in the rankings a total of 15 spots compared with last year. Figure 28: The Rankings and Average Scores of Guangdong s Nine Evaluated Cities (Including Scores for Automatic Monitoring Data ) Although Shanxi finally launched its platform for the self-disclosure of automatic monitoring data of key polluting enterprises, there still exist obvious flaws in the region s disclosure system. In July 2015, we observed the establishment of Shanxi s Platform for the Real-Time of Key State-Monitored Enterprises Automatic Monitoring Data. Data was not updated until November 2015, when 24 state-monitored pollution sources in Taiyuan, Xinzhou, and Yuncheng were observed as disclosing real-time monitoring data. With the encouragement and promotion of Shanxi s provincial EPB and environmental protection groups, an increasing number of pollution source entities utilized the online information disclosure platform to publish automatic monitoring data in a timely manner. Out of the five cities evaluated in Shanxi this year, Changzhi and Taiyuan both performed relatively well in publishing 16. This average ranking does not include Beijing, Shanghai, Tianjin, and Chongqing. 17. This does not include Beijing, Shanghai, Tianjin, and Chongqing. 30

35 Annual PITI Assessment automatic monitoring data. Changzhi scored 16 points while Taiyuan scored 14 points, and the cities had an increase of 12 and 10 points, respectively. 18 The other three evaluated cities in Shanxi - Yangquan, Datong, and Linfen - exhibited no noticeable improvements, scoring relatively the same in this category as they did last year. There are serious delays in the disclosure of automatic monitoring data from Chongqing s key pollution sources. Of the four province-level municipalities of China (Beijing, Tianjin, Shanghai and Chongqing), only Chongqing has yet to implement a real-time disclosure system for the automatic monitoring data from key pollution sources. According to this year s evaluation, Chongqing only scored at a rate of 40% on our automatic monitoring data disclosure criteria, placing Chongqing at the bottom of the rankings in terms of the four province-level municipalities. Figure 29: Scores of the Four Province-Level Municipalities for Automatic Monitoring Data During our research, we found that Chongqing was not late in starting to develop its automatic monitoring of key pollution sources. There are documents and other materials clearly showing that Chongqing began a system of gathering, transmitting, and managing data as early as 2011: Online monitoring centers at the national, city, and district level had completed construction of an online data transmission system that did not have barriers to transmission. In this system, 293 enterprises hosted a total of 380 automatic monitoring devices placed directly at the sources of pollution. These 380 monitoring devices then reported directly to the monitoring center. Chongqing had established a 24-hour monitoring and comprehensive management network, which contained 18. The five evaluated cities of Shanxi were Changzhi, Taiyuan, Yangquan, Linfen, and Datong. 31
36 an automatic monitoring system of pollution source emissions data, pollution treatment facilities, and video monitoring. 19 However, Chongqing continues to experience delays in its disclosure of automatic monitoring data. In December 2015, our evaluation team sent a letter to Chongqing s EPB pointing out the following: Chongqing has a total of 224 state-monitored enterprises (excluding 44 hazardous waste sites and enterprises monitored for heavy metals). Apart from eight enterprises that have been marked as out of production, there are only 67 enterprises that have implemented real-time disclosure of emissions data, 109 enterprises that at least publish manual monitoring data, and 40 enterprises that completely lack data without explanation. On January 20, 2016, Chongqing s EPB sent a response that stated, According to the requirements of Measures on Self-Monitoring and Information for Key State-Monitored Enterprises (for Trial Implementation), self-monitoring can select either automatic monitoring or manual monitoring. Chongqing s disclosure platform includes real-time disclosure data and periodic manual monitoring data. According to Article 8 of the Measures for the of Environmental Information by Enterprises and Public Institutions, pollution sources deemed as key enterprises for monitoring by environmental agencies at the city level and above should subsequently be listed in directories for key pollution-discharging entities. Therefore, these lists should include all state-monitored pollution sources. Furthermore, according to Article 24 of the Air Pollution Control Law, Key pollutant-discharging entities shall install and use automatic monitoring equipment for atmospheric pollutant emissions, and shall connect [this equipment] to the monitoring equipment networks of departments in charge of environmental protection, ensure regular operation of the equipment and disclose emissions data according to law. Those key pollution-discharging entities that do not disclose their automatic monitoring data at all or display falsified data will be subject to a compliance order from environmental agencies at the county level or above. These key pollution-discharging entities could also face fines between RMB 20,000 and RMB 200,000. Entities that do not comply with these changes will be ordered to shut down production and implement corrections. Our evaluation team will continue to follow the situation closely and push for the disclosure of automatic monitoring data from Chongqing. 19. To keep a close watch on pollution sources: Chongqing s 293 enterprises hosting a total of 380 automatic monitoring devices connected with Chongqing monitoring center China Environment News, April 19, 2011, (last visited on July 27, 2016). 32
37 Annual PITI Assessment II. of key pollution-discharging entities of key pollution-discharging entities is a new evaluation criterion, appearing for the first time in this year s evaluation. This criterion evaluates whether or not cities complied with the requirements in the new Environmental Protection Law regarding the formulation and disclosure of a key pollutiondischarging entities directory, 20 and then whether or not key pollution-discharging entities followed the new requirements for environmental information disclosure under the Measures for the of Environmental Information by Enterprises and Public Institutions, as well as whether key air polluting entities took steps to follow the new requirements for disclosure of online monitoring data under the new Air Pollution Control Law. 2.1 Improvement: The new law has been successfully implemented in seven cities during its first year in effect. During our team s evaluation of 338 cities at the prefecture level or above for each city s implementation of the new Environmental Protection Law in its first year, we found that 146 of these cities disclosed their directories of key pollution-discharging entities, accounting for 43.2% of the total evaluated cities. Among the 146 cities, 69 cities were evaluated cities, accounting for 57.5% of the total number of evaluated cities. Upon implementing the new Environmental Protection Law in its first year, 100% of 17 cities in Henan and 11 cities in Zhejiang published directories of key pollution-discharging entities. Beijing, Shandong, and Zhejiang, began to implement automatic monitoring data disclosure for monitored pollution sources other than key state-monitored pollution sources. In the first year of using this criteria in our evaluation, the seven cities of Hangzhou, Taizhou, Beijing, Qingdao, Zaozhuang, Zibo, and Yibin all scored over 80% on this criteria. Among these cities, Hangzhou and Taizhou scored 5.6 points, thus achieving a scoring rate of 93.3% The criteria meets the legal requirements namely in that the evaluated cities seem to have disclosed their directories of key pollutiondischarging entities. However, outside of state-monitored pollution sources, laboratories, and second-tier hospitals in the disclosed directories, the cities did not include any other key pollution-discharging entities, such as provincially-monitored pollution sources, and thus were not awarded the points for the other requirements. 21. The evaluation criteria should be weighted 6 points total. 33

38 Figure 30: of Directories of Key Pollution-Discharging Entities Across China in Shortcoming: Enterprises that discharge air pollutants have yet to implement the requirements from the new Air Pollution Control Law regarding disclosure of automatic monitoring data. This new criteria was worth 6 points. However, out of 120 evaluated cities, only 69 cities earned points for this criteria. Of these 69 cities, 15 disclosed their directories without disclosing information about the listed enterprises. According to the completeness requirements of this criteria, these cities will only achieve 0.4 or 0.8 points for this criteria. The average score for all evaluated cities in this criteria was 1.41 points, resulting in a scoring rate of 23.6% which is second-to-last among the ten evaluation criteria. The main reasons for the low scores are as follows: Out of 120 evaluated cities, 51 cities did not disclose their directories of key pollutiondischarging entities in Out of the 69 cities that disclosed their directories of key pollution-discharging entities, the enterprises in 15 of those cities have yet to implement the requirements for environmental information disclosure under the Measures for the of Environmental Information by Enterprises and Public Institutions. Many enterprises discharging air pollutants that were included in directories of key pollutiondischarging entities have yet to implement the disclosure requirements for automatic monitoring data under the new Air Pollution Control law. 34

39 Annual PITI Assessment 2.3 Innovative Cases Beijing has built a new platform for information disclosure from enterprises and public institutions and encourages key pollution-discharging entities to disclose information on this unified platform. At the end of 2015, Beijing s EPB required that key pollution-discharging entities synchronize their information onto the EPB online disclosure platforms from January 31, Additionally, the Beijing EPB also encouraged the public to use the method of information disclosure upon request to keep enterprises accountable in fulfilling their information disclosure obligations. By April 13, 2016, all state-monitored pollution sources had disclosed automatic monitoring data on Beijing s Environmental Information Platform for Enterprises and Public Institutions. Apart from state-monitored key pollution-discharging entities, which had already disclosed their information on the platform, a portion of other enterprises also used this platform to publish their online monitoring data. This was especially true of the 20 non-state-monitored thermal power enterprises, 14 of which had already started using the platform to publish their online monitoring data. Figure 31: Beijing s Environmental Information Platform for Enterprises and Public Institutions (Source: last visited on 2016/9/7) Cities such as Shenyang adopted detailed selection principles regarding their directories of key pollution-discharging entities. Following the implementation of the new Environmental Protection Law in 2015, Shenyang s EPB released its directories in April and September of 2015, including 513 enterprises in total. Upon publication the first directory, Shenyang EPB published its principles for the designation of key monitored pollution sources on its website and other social media channels: 22. Notice from the Beijing EPB regarding environmental information disclosure for enterprises and public institutions, Beijing EPB, November 2, 2015, (Last updated September 9, 2016). 35

40 The enterprises in the directory are selected based on annual environmental statistics from last year, and according to four government control targets. Industries and enterprises were arranged in order and selected based on total pollutants from production or total pollutant discharge accounting for 50% or more of the total pollution load (not including state-monitored key pollution sources). Key enterprises emitting heavy metals, toxic wastes, medical institutions, centralized waste treatment facilities, centrally managed laboratories and other enterprises dealing with environmentally sensitive materials posing environmental risks shall also be included in the directory. Shenyang s EPB also published a detailed methodology for its key pollution source designation. Taking air pollution enterprises as an example, the selection principles are as follows: Taking data from 2013 in the environmental statistics database as a baseline, state-monitored enterprises shall be excluded. The rest of the enterprises should then be sorted by total emissions of sulfur dioxide and nitrous oxides. Enterprises with the biggest contributions to 50% of the total pollution load were then selected. The directory was considered complete once all pottery and ceramics industries and industries that used stoves of 80 tons or more and enterprises that used heated boilers had been added. Figure 32: Methodology for Determining Shenyang s Directory of Key Pollution-Discharging Entities Local EPBs seek public comment when creating their directories of key pollution-discharging entities. On May 20, 2016, the official government Weibo of Harbin s Environmental Protection, released a news story titled Notice: Soliciting Public Comment Concerning Harbin s 2016 Directory of Key Pollution-Discharging Entities for Air Pollutants. Even though the period for public comment only lasted four days, this call for comment still reflects the importance the EPB attaches to public opinion. 36
41 Annual PITI Assessment Figure 33: Notice for Public Comment from Harbin EPB Regarding the 2016 Director of Key Pollution-Discharging Entities for Air Pollutants (Source: screenshot on 2016/8/1) 3. Interactive Responses I. Environmental Complaints and Reports 1.1 Improvement: The convenience of environmental complaints and reports has been improved. There is an environmental and societal need for increased data sharing, communication, and openness of environmental information. As the internet develops and the use of the internet as a channel for communication expands (such as via smartphones and PAD 23 ), modes of information disclosure are also changing. These new trends have prompted the government to use more innovative methods of communicating environmental data. This means that the government needs to expand its services to such platforms as WeChat, government Weibo accounts, government apps, and other similar means. Recently, following the rise of new interactive social media platforms like Weibo and WeChat, as well as some publically-generated data platforms, it is more convenient for the public to make environmental complaints and reports. When complaints are combined with photos, complaints are no longer just a verbal statement. The picture below shows the information that Green Taihang sent through a local EPB s public WeChat account and the responses that were received. This information was based on the automatic monitoring pollution data in the Blue Map app. 23. Tablet devices. 37


42 Figure 34: Environmental NGO Green Taihang Uses Data from IPE s Blue Map App to Conduct Complaints Through WeChat 1.2 Shortcoming: Information about environmental complaints and reports is not completely disclosed on mobile platforms. Below are the major difficulties that cities have encountered with disclosure of reports about environmental complaints and petitions that were identified during this year s evaluation: During this year s evaluation, nine cities Yangquan, Benxi, Harbin, Mudanjiang, Kaifeng, Zhangjiajie, Nanchong, Yuxi, and Jinchang still had not disclosed their environmental complaints and reports information and thus scored zero points for this assessment criteria. There are significant regional differences in score distributions. Compared to cities in the southeast, cities in the northeast and northwest scored much lower. Figure 35: A Map of the Scoring Rates for Each Region for of Environmental Complaints and Reports 38

43 Annual PITI Assessment A portion of EPBs have not launched official government Weibo accounts and thus are not able to receive public reports through these platforms. Of those EPBs that have official Weibo accounts, some are inactive zombie accounts while others do not accept complaints and reports at all. The Environmental Report WeChat account accepts environmental complaints and reports information without fully disclosing this information to the public. II. Upon Request In February 2016, our group requested the following information from the 120 evaluated cities by means of their online information requesting systems, , fax, or post mail: The number of environmental violation cases in 2015 at the city, district, and county level; The number and name of Environmental Impact Assessment (EIA) public hearings conducted in We successfully submitted information requests to 113 out of the 120 evaluated cities. 87 cities responded to our request; among these 87 cities, 61 provided all of the requested contents, and 26 partially provided the requested contents. The statistics for the responses are outlined below: Figure 36: Summary of Upon Request 39

44 2.1 Key Improvements: More cities have launched and improved their online systems for disclosure upon request. This year, out of the 113 successful requests, 60 were submitted through online systems. Of last year s comparative 46 cities, this was a small improvement. This means that more cities have started to use online methods of managing disclosure upon request, thus simplifying disclosure upon request procedures and making the process more efficient. Figure 37: Summary of Information Request Approaches for Upon Request. 2.2 Key Shortcomings: Systems for disclosure upon request are still not complete, and the quality of responses to requests for information still requires improvement The methods for applying for disclosure upon request for this year s evaluation were the same as during last year s evaluation. First, we give preference to online application systems. Telephone, fax, , or post were also used if the system did not exist or was out of commission. Seven of our request submissions failed among the 120 evaluated cities. Even though the channels for online application systems for disclosure upon request have helped to improve disclosure upon request from previous years, the quality of the online request systems still requires improvement. According to statistics from this year s evaluation, out of the 120 evaluated cities, 95 cities have online systems for requesting information but only 60 of these online request systems are usable. Furthermore, of the successful online submissions, only 45 requests received responses. The online application systems still need to be further maintained and improved to make disclosure upon request more accessible. 40
45 Annual PITI Assessment 4. Emissions Data I. Emissions Data of Key Enterprises 1.1 Improvement: Unified channels for disclosure After the Measures on Self-Monitoring and Information for Key State-Monitored Enterprises (for Trial Implementation) went into effect on January 1, 2014, key pollution sources gradually began to use local Key Pollution Source Automatic Monitoring Data Platforms to publish their annual monitoring reports. Moreover, on January 1, 2015, China s new Environmental Protection Law came into effect. This law includes explicit requirements for environmental information disclosure of key pollution-discharging enterprises. Some regions have already begun to abide by these requirements when disclosing their annual volumes of pollutant emissions. systems for environmental data from key enterprises are becoming more unified and are making it more convenient for the public to obtain relevant information. 1.2 Shortcoming: Data disclosure of characteristic pollutants and hazardous chemical pollutants remains severely deficient. Recently, the frequency of chemical leakage and accidental explosions has increased, while little information on hazardous chemical pollutants has been made public. In the case of the Ruihai Company hazardous chemical products explosion at the Tianjin port last year, the types, storage location, and other information about the chemicals were not clear. When information regarding hazardous chemical accidents is unclear, this can inhibit recovery efforts. This year s evaluation shows that there is a lack of information disclosed about dangerous chemicals. The publication of information on such characteristic and hazardous chemical pollutants still needs to be improved. Figure 38: Summary on the Completeness of Emissions Data from the Past Three Evaluations 41

46 According to the above statistics, the systems for total emissions data disclosure for conventional pollutants such as chemical oxygen demand (COD), ammonia nitrogen, sulfur dioxide, nitrogen oxide, and other typical pollutants, have become increasingly comprehensive and effective. However, this year s evaluation found that the total emissions data disclosed by some enterprises is even larger than the total emissions data for the regions in which they are located, indicating issues with data quality. II. Cleaner Production Audits This year, the points possible for the Cleaner Production Audits criterion was adjusted from four points in previous years to two points. During this year s evaluation, out of the 120 evaluated cities, 97 cities published their directory of enterprises subject to mandatory cleaner production audits. The 97 cities make up 80.8% of all evaluated cities, showing a slight decrease from 84.2% in last year s evaluation. Figure 39: Evaluation Results for Cleaner Production Audits 2.1 Improvements There has been no noticeable improvement for cleaner production audit disclosure in this evaluation term. 2.2 Shortcomings Similar to previous years, the scores for cleaner production audits were generally low. The average scoring rate was 29%; compared to last year s 29.5% average, the scores this year have dropped slightly. The reason for this drop is that most of the enterprises subject to mandatory cleaner production audits have yet to disclose emissions information as required. At the same time, EPBs also have yet to publish related information according to law. 42
47 Annual PITI Assessment 5. Environmental Impact Assessment (EIA) Information I. Improvement: of full EIA reports has improved In this year s evaluation, 101 of the 120 evaluated cities disclosed varying degrees of the full texts of their EIA reports during the EIA review and handling period. 24 These 101 cities comprised 84.2% of the total evaluated cities, increasing by 11% since our last assessment period. Comparing the three most recent assessments, the number of cities that disclose the full text of EIA reports has increased. Figure 40: Summary of Full EIA Reports During the Past Three Assessment Periods 25 II. Shortcoming: Public participation in EIAs needs to be further implemented and improved. This year, the average score for all 120 cities on EIA information disclosure was 5.9 points, with a scoring rate of 39.3%. The reasons for such low scores are as follows: Of the 120 evaluated cities, there were 19 cities that failed to disclose the full text of their EIA reports during the EIA report review period. Public participation during the EIA process was insufficient because of limited time allotted for public participation and ineffective means of seeking public comment. 24. If cities did not disclose their EIA reports immediately upon receiving them, the city could still be granted the points under this criteria if they sent out an EIA Approval Notice requesting public comments. 25. A hoop map, inwards to outwards, for the and data points. 43
48 Regarding public participation in EIAs, based on the international experience, the evaluation sets three levels for requirements divided into days, days, and 30 days or more. According to the evaluation statistics, out of 101 cities that published the entire text of accepted EIA reports, 80 of these cities made their reports public for 10 business days, eight cities released them for seven business days, and 13 cities released their reports for five or six business days. Of the cities evaluated, 88 scored worst in the area of EIA disclosure, with 13 cities scoring zero. Figure 41: Summary of the Allotted Time Period for Public Participation in EIA Another reason for the low scores in this criteria is that public participation is formulaic without actual interaction and communication. Much of the public participation that occurred during EIA processes was conducted through public notices and questionnaires, while few EIA processes included public hearings or meetings for in-depth communication and understanding. Out of the 120 evaluated cities, six cities deleted historical EIA information regarding EIAs. There were even cities that immediately deleted all their EIA information after the EIA public commentary period had finished. III. Cases On June 27, 2016 in Qianjiang, a city in Hubei province, over ten thousand citizens participated in the protest aimed at rejecting poisonous enterprises, and fighting against the establishment of a foreignfunded insecticide factory. According to the brief EIA report from the Qianjiang EPB website disclosed on June 2, 2016, after the disclosure of the project in June 2015, Nobody in the public directed any comments towards our company or the construction company. Therefore, the Qianjing EPB released a the brief EIA report on theirwebsite ( Questionnaires for projects will also be used in the surrounding regions for local residents and communities. These NIMBY issues further reveal that merely disclosing information on websites or using questionnaires is not effective or sufficient for public participation. The information disclosure during EIA processes requires further improvement. 44

49 Annual PITI Assessment Figure 42: Announcement Regarding the Halting of the Avgust Project 45
50 Section 2: Top-Ranking Cities Based on the subcategory scores, the evaluation team selected the highest score and the average score for each respective evaluation criterion, and crafted an all-star score of 90.5 (adding together all the highest subcategory scores) and an average score of 49.6 (adding together all of the average subcategory scores). Under the all-star scenario, some cities have achieved the maximum number of points possible by accumulating all the points 5 out of the 10 subcategories, including disclosure of the breakdown of pollution fees, automatic monitoring information disclosure, environmental complaints and reports, and disclosure upon request. Figure 43: Top-Ranking Cities for Each Assessment Criterion Assessment Criteria Top Scoring Cities Points Achieved Total Points Possible of Daily Excessive Emissions and Other Violation Records of Enterprise Environmental Performance/ Credit Ratings Discharge Fee Breakdown Automatic Monitoring Data Information of Key Polluting Entities 26 Xiamen Changzhou Wenzhou Shandong Hangzhou, Taizhou Complaints & Reports Information Hangzhou Upon Request Beijing, Xiamen, Suzhou and seven other cities 27 Emission Data of Key Polluting Enterprises Taian, Shantou, Jining Cleaner Production Audit Data Liuzhou EIA Information Shanghai, Beijing, Xiamen Scoring Rate % 92.00% % % 93.33% % % 66.67% 70.00% 72.00% 26: Qingdao, Yantai, Zaozhuang, Weihai, Weifang, Jining, Taian, Rizhao, Zibo, and Jinan 27: Beijing, Xiamen, Suzhou, Dalian, Baoding, Xuzhou, Mudanjiang 46


51 Annual PITI Assessment Figure 44: Average Score and Highest Score Comparison Graph for Figure 45: Complete Lineup of Top-Ranking Cities (Highest Score Scenario) 47
52 CHAPTER 4 Policy Recommendations In accordance with the results of this year s evaluation, we put forward the following recommendations: 1. Implement the legal requirements for information disclosure set forth by the revised Environmental Protection Law and Air Pollution Prevention and Control Law We recommend that the MEP supervise and push for cities and provinces that have not acted in accordance with the Measures for the of Environmental Information by Enterprises and Public Institutions to quickly act in line with these legal requirements. We advise that the EPB streamline the selection criteria and selection guidelines for the entities that will be on the Directory of Key Pollution-Discharging Entities lists. Furthermore, the EPB should supervise and push for the cities and regions that have not yet created their respective Directories of Key Pollution-Discharging Entities to draft them, and to share them publicly. We also recommend that EPBs in each city, in accordance with the law, supervise and urge each pollution source to act in accordance with the Air Pollution Prevention and Control Law. These cities should provide complete and timely automatic monitoring data. 2. Establish a standard model for the transmission of data from online monitoring sources while controlling data quality and authenticity. We recommend that the MEP require those nine provinces and regions with a time lag in disclosing their automatic monitoring data to come up with a unified system and platform for automatic monitoring data disclosure. The EPB should also create a system that promotes automatic and timely publication of monitoring data. These efforts will help curb the backdoor practice of entities adjusting pollution data during the time between data collection and data publication. We recommend that local EPBs release the blacklist of entities and third-party environmental agencies involved with data fabrication. Thus, through a system of government regulation and public scrutiny, local EPBs can increase the cost of committing environmental crimes. 48
53 Annual PITI Assessment 3. Promote the good practices from example cities so as to facilitate the complete and timely disclosure of Routine Supervision Records. Through analyzing the data from this assessment period, we identified a series of good practices in Routine Supervision Record disclosure. These good practices include the high publication frequency of data in Zhejiang, the "double exposure" mode of environmental violations in Shandong, the full disclosure of penalty records in Beijing, and the promptness of the information publication in Hangzhou, Ningbo and Wenzhou (within 20 working days). We also recommend that EPBs across the country promote these good practices and firmly push for comprehensive, timely, and complete disclosure of supervision records. 4. Standardize the system of disclosure for enterprise emissions data, aiming for the systematic, comprehensive and complete disclosure of enterprises annual emissions data. The Pollutant Release and Transfer Register (PRTR) is internationally used and has been recognized as one of the most useful programs for environmental information disclosure. While China has established laws and regulations regarding pollution information disclosure, these have not yet resulted in a PRTR-type disclosure system. Establishing and implementing a PRTR system in China is especially important to human health, and is critical to preventing further soil pollution and groundwater pollution. We recommend that EPBs at all levels take feasible steps to guarantee the authenticity and completeness of information disclosed by key enterprises, and that such information includes information on emissions, as well as data on hazardous chemicals. 49
54 5. We recommend fully utilizing new media platforms to further promote information disclosure. Specifically, we recommend using a four-tiered Weibo reporting system for environmental information disclosure. Implementation of the EPB Weibo accounts used in Shandong, Zhejiang and other provinces could make EPBs more effective in responding to environmental reports and complaints sent through social media platforms. This has greatly promoted the pollution information disclosure in this new media age. We recommend that other EPBs around the country learn from, and build upon, the excellent framework for disclosing pollution information that Shandong and Zhejiang have created. We recommend a four-tiered Weibo reporting system between the MEP and EPBs in provinces, cities, and towns all around the country. This system will help ensure that information disclosure is complete and effective, and that the information can be easily obtained by the public. 50
55 Annual PITI Assessment 1. Summary of Assessment Criteria APPENDIX 1 Assessment Standards The PITI assessment s standards are predicated upon three key dimensions: first, the existing requirements of the latest environmental laws; second, example models and best-practices from international experience; and third, the public s right to a safe and healthy environment. The changes made to the PITI assessment criteria over the years are the result of frequent discussions with field experts who have sought to keep the PITI assessment consistent with the state of China s rapidly changing and improving environmental laws and regulations, as well as the current state of China s environmental crisis. The assessment criteria found below are the fruit of these discussions; these evaluation criteria seek to incorporate China s existing environmental laws and regulations, as well as standards supporting a longterm vision of strict environmental regulation and sustainability. Appendix Graph 1-1 Assessment Criteria and Principal Laws and Regulations Assessment Item Assessment Subject Principal Laws and Regulations Environmental Supervision Information of Routine Excessive Emissions and Other Violation Records (23 points) The disclosure status of data on enterprise excessive violations and other violation records, including administrative penalties, reports on actions for environmental enforcement, supervisory notices urging violators to come into compliance within a given timeframe, etc. The EPB s monitoring of pollution sources as well as the publication of these monitoring results, particularly the disclosure of data regarding excessive emissions from polluters. (Access Date: February 29, 2016) Measures for Environmental Information (Trial) 2007 Measures on Self-Monitoring and Information for Key State- Monitored Enterprises (Trial); and Measures on Supervisory Monitoring and Information for Key State-monitored Enterprises (Trial) (MEP Publication [2013] #81) Notification Concerning the Reinforcement of Pollution Source Environmental Supervisory Information (MEP Publication [2013] #74) (30 points) of Enterprise Environmental Performance/ Credit Ratings (5 points) MEP s published results from their evaluation of corporate environmental performance: Corporate environmental performance ratings, which are evaluated on the basis of industry environmental activity as well as the publicized results of disclosure for enterprises rated yellow or lower. (Translator note: Enterprises not performing well. (Access Date: February 29, 2016) Opinion on Accelerating the Implementation of the Enterprise Environmental Performance Assessment System (MEP Publication [2005] #125) Enterprise Environmental Credit Evaluation Measures (Trial) (MEP Publication [2013] #150) Notification Concerning the Reinforcement of Pollution Source Environmental Supervisory Information (MEP Publication [2013] #74) 51
56 Discharge Fee Breakdown (2 points) The publication of emissions fees levied against polluters, including pollution fee incidents, specific pollutants emitted, emission concentration, emission volume, etc. (Access Date: April 30, 2016) Measures for Environmental Information (Trial), 2007 Notification Concerning the Reinforcement of Pollution Source Environmental Supervision Information (MEP Publication [2013] #74) Pollution Source Self- (26 points) Automatic Monitoring Data (20 points) of Key Pollution- Discharging Entities (6 Points) This assessment area focuses on the information obtained through provincial-level environmental agencies self-monitoring platforms and their subsequent platform development through the evaluation of the disclosure for total volume of effluent emissions into air and water, pollution concentration, applicable emission limit, as well as the status of compliance, etc. The disclosure of every city s Directory of Key Pollution- Discharging Entities; whether or not key air emissions pollution sources follow the Air Pollution Law s requirements for online disclosure of monitoring information and if other enterprises adhere to the requirements for environmental information disclosure under the Measures for the of Environmental Information by Enterprises and Public Institutions. (Access Date: February 29, 2016) Measures on Self-Monitoring and Information for Key State- Monitored Enterprises (Trial); and Measures on Supervisory Monitoring and Information for Key State-monitored Enterprises (Trial) (MEP Publication [2013] #81) Notification Concerning the Reinforcement of Pollution Source Environmental Supervisory Information (MEP Publication [2013] #74) Law on the Prevention and Control of Air Pollution of the People s Republic of China Measures for the of Environmental Information by Enterprises and Public Institutions (Ministerial Order No. 31) Measures on Self-Monitoring and Information for Key State- Monitored Enterprises (Trial) (MEP Publication [2013] #81) Environmental Protection Law of the People s Republic of China Interactive Response (15 Points) Complaints & Reports Information (7 points) This area examines the disclosure of information on the handling of environmental reports and complaints received by EPBs and their resolution results, including the subject of the reports and complaints, the object of the complaint (the enterprise), whether or not the case has been accepted by the EPB, the status of the investigation, disclosure of the resolution results, etc. (Access Date: February 29, 2016) Notification Concerning the Reinforcement of Pollution Source Environmental Supervisory Information (MEP Publication [2013] #74) Measures for Environmental Information (Trial), 2007 upon Request (8 points) Whether or not the EPB has set up a regular and complete system for response. The assessment group will score the EPB on the basis of their process and responses to requests for information. Measures for Environmental Information (Trial),
57 Annual PITI Assessment of Key Enterprise Pollution Discharge Data (12 points) The assessment of annual pollutant emissions disclosure. (Access Date: February 29, 2016) Measures on Self-Monitoring and Information for Key State- Monitored Enterprises (Trial); and Measures on Supervisory Monitoring and Information for Key State-monitored Enterprises (Trial) (MEP Publication [2013] #81) Measures on Environmental Management and the Registration of Hazardous Chemicals (Trial) (MEP Order #22) Measures for Environmental Information (Trial), 2007 Enterprise Emissions Data (14 points) Cleaner Production Audit Data (2 points) EPB disclosure of the mandated cleaner production audit enterprise list, as well as disclosure on the status of whether or not enterprises have released their key pollutant emissions. The EPB should have released the key pollutant emissions data for enterprises if the enterprise themselves failed to disclose this data. (Access Date: February 29, 2016) Provisionary Measures for Clean Production Audit (2004) Notification Concerning the Reinforcement of Pollution Source Environmental Supervisory Information (MEP Publication [2013] #74) EIA Information (15 points) The disclosure status of the full text of EIA reports, as well as the level of effort made at all levels of the environmental protection bureaus, to gather public opinions and notify interested parties of their rights to administrative reconsideration and administrative litigation through media channels, community assemblies, public hearings, or other methods. These measures should be taken before there is an acceptance or rejection of the construction project s EIA. (Access Date: February 29, 2016) Notification to Issue the Construction Projects Environmental Impact Assessment Government Information Guidelines (Trial), (MEP General Affairs Office Announcement [2013] #103) Measures for Environmental Information (Trial), 2007 Provisionary Measures for Public Participation throughout the Environmental Impact Assessment Process for Construction Projects (MEP Publication [2006] #28) 53
58 Four metrics are used to evaluate each assessment item: Systematicness: How systematic is the data we collected? To determine how systematic our data is, our team primarily considers two factors: how comprehensive pollution-source information is, and how regularly this data is disclosed. We analyze how comprehensive data disclosure is by evaluating the amount of pollution-source data that was actually published in comparison to the amount that should have been published. We also analyze how regularly data is published by evaluating the extent to which pollution-source data disclosure followed a consistent schedule for disclosure. Timeliness: How timely was the collected data published? To assess how timely our data is, our team assesses how promptly local pollution-source information is disclosed. Completeness: How complete is the data we collected? To assess how complete pollution-source data is, we evaluate the content of information published regarding local pollution sources, as well as whether or not all essential figures have been included in this disclosure of information. User-Friendliness: How user-friendly is the data we collected? To assess how user-friendly our data is, we investigate whether or not it is convenient for an internet user to obtain information on pollution-source pollution. To determine the scores, we primarily analyze online data sources, and investigate information collected from disclosure upon public request applications and other evaluation results. 2. Assessment Methodology Summary The grading system for each assessment criteria is based on a 100-point scale. The four metrics used to analyze our data Systematic, Timely, Complete, and User-friendly are given one of six grades: Excellent, Good, Moderate, Fair, Poor, and Very Poor. If the raw score of an assessment aspect is between two scoring grades, it can be either rounded up or down in accordance to the rules for raising and lowering of grades. The Systematicness -Restricted Scoring Rule: The systematicness -restricted scoring system is used throughout the entire data evaluation process. Under this rule, a given assessment item s systematicness aspect score is used to limit the other aspect scores (i.e. how timely, how complete, and how user-friendly data is). As a result, an assessment item s final 54

59 Annual PITI Assessment scores for the other three metrics ( timely, complete, and user-friendly ) are not allowed to exceed that data indicator s systematic ranking. The specific systematic metric-restricted scoring system s control guidelines are shown below: Appendix Graph 2-2 Grading Rules for Systematic Control Systematic Metric Timely, Complete, User-Friendly Excellent Good Moderate Fair Poor Excellent Excellent Good Moderate Fair Poor Good Good Good Moderate Fair Poor Moderate Moderate Fair Fair Fair Poor Fair Fair Poor Poor Poor Poor Poor Poor Poor Poor Poor Poor The systematicness -restricted scoring system has been implemented because the systematicness metric evaluates how regularly and continuously data is published. This metric also investigates how complete the data is; this metric primarily looks at the quantity of data published. On the other hand, the metrics timely and complete primarily assess the quality of data disclosed, while userfriendly measures the quality of the publication of data itself. Since these three aspects are assessed based on published data, when scoring the last part we must emphasize the importance of the amount of information published compared to the amount which should have been published. The score for the systematic metric includes a section on how complete data is, so it reflects to a greater extent the quantity of information published. There are exceptions to rules for the systematic metric -restricted scoring system. The following data evaluation criteria are not considered under the systematic metric: information disclosure upon request, and whether data is timely, complete, and user-friendly. For detailed evaluation rules, please see the Pollution Information Transparency Index Evaluation Methods ( ) (Digital Edition). Link: de.aspx?id=18342&isano=2 55
60 APPENDIX 2 Visual Comparison Of The Annual Scores For All Evaluated Cities (Organized By Province) 56
61 Annual PITI Assessment 57
62 58
63 Annual PITI Assessment 59
64 60
65 Annual PITI Assessment 61


66 APPENDIX 3 PITI Partner Score Graphs 62

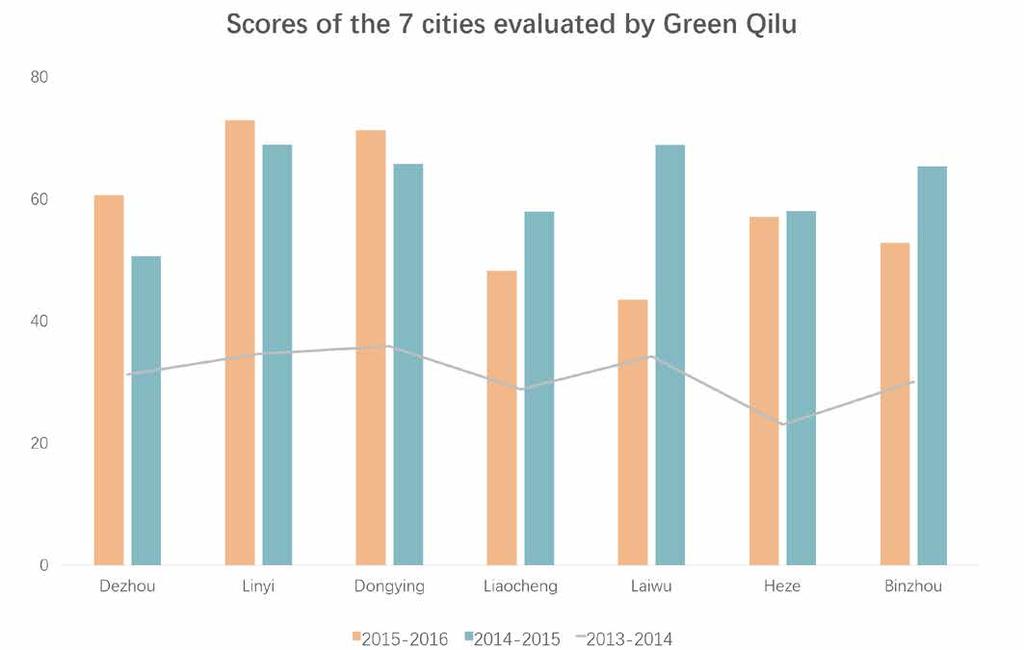
67 Annual PITI Assessment 63


68 Thank you to the SEE Foundation for funding this report. The original text and suggestions are those of the author of this report and are not representative of the SEE Foundation. 蔚蓝地图 APP 蔚蓝地图微信公众号 本报告由再生纸印刷 64