Sustainable Desalination. The World s 1 st Solar Powered Zero Carbon Footprint Water Plant
|
|
|
- Joanna Simmons
- 5 years ago
- Views:
Transcription


1 Sustainable Desalination The World s 1 st Solar Powered Zero Carbon Footprint Water Plant Sep 2017
2 Index 1 Changing the Game 2 Sustainability Features 3 Al Khafji Project 1. Changing the Game 4 Process Overview 5 Video 2
3 Changing the Game Al Khafji Project.the game-changer of the water industry 1. Savings and Protection Saves on oil fuel resources and protects the environment by CO 2 emission reduction 2. Synergy 3. Initiative Surplus power during daylight hours is send to the grid. In the evening hours, an equal amount of energy is pulled from the grid The world s 1 st full-scale, zero carbon footprint, solar powered water treatment installation, designed to produce 60,000 m 3 / day of drinking water 4. Projects Under the King Abdullah initiative for Renewable Energy Desalination, Al Khafji is intended to be the first of a series of such projects in the Kingdom to transform the water sector 3
4 1 Changing the Game 2 Sustainability Features 3 Al Khafji Project 2. Sustainability Features 4 Process Overview 5 Video 4
5 Sustainability Features 1 RO/PV Pilot plants for Process Enhancement 2 Compact plant design that reduces environmental impact 3 Optimized power consumption that minimizes power demand 4 High-Pressure Pumps (HHP) equipped with Variable Frequency Drives (VFD) 5 Variable frequency drives installed for main pumps avoiding peak current and voltage drops 5
6 Company Profile AWT has a broad mandate to explore bankable opportunities along the water value chain Upstream EPC Contractor Desalination Renewable Energy O&M Parts & Components Supply Chain Chemicals Smart Technology Equity Ownership Distribution Membranes Water Management Treatment & Reuse Downstream 6
7 Company Profile Line of business Design and Construction of Water Projects (desalination, treatment & reuse) Developer of Projects O&M of Water Plants Other Lines of Business E.g. technology & equipment provider 7
8 Company Profile At the heart of AWT lies the key to success. The ingredients include: World-class management team Strong engineering & project management capabilities Global industry-leading partners Stakeholder support and the ability to work with other stakeholders Core drivers of innovation and sustainability Financial backing 8
9 Company Profile AWT s Unique Features: 1. Innovation along the entire water value chain 2. Sustainability in solutions and practices 3. Superior Performance in engineering and project execution 9
10 1 Changing the Game 2 Sustainability Features 3 Al Khafji Project 3. Project Milestones 4 Process Overview 5 Video 10
11 Khafji Project (Key Technical Items) Plant General Information Assured Electrical Efficiency of the plant: < 4.2 Kwh/m 3 Plant intake - 3 offshore towers and intake pipes which extend 2.1 km into the sea Seawater outfall - 2 pipes with diffusers at 3 km offshore Minimum Chemical Consumption High Quality Materials 40 % to 44 % Recovery Plant Technical Data Pre-Treatment RO Treatment Post Treatment Three inlet towers and pipelines with total intake capacity of 90,000 m 3 /day 3 intake pumps Dual Media Filters followed by 3 Self Cleaning Filters. 12-train Ultrafiltration System Consists of first and second pass systems 6 RO trains installed initially Additional 3 RO tranis for 90 MLD for expansion Each train with 144 pressure vessels in the 1 st pass and 48 vessels in 2 nd pass Product water collected in 2,600 m 3 concrete wet well 3 Pumps convey product water to SWCC storage tank Chemical feed systems installed for capacity of 60,000 m 3 /day Minimum Capex expected for capacity ramp-up of up to 90,000 m 3 /day Possibility of capacity ramp-up in phases depending on Off-take demand from SWCC 11


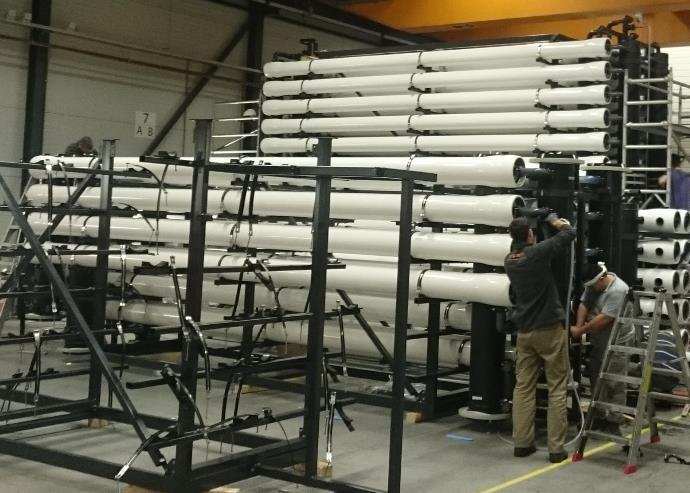
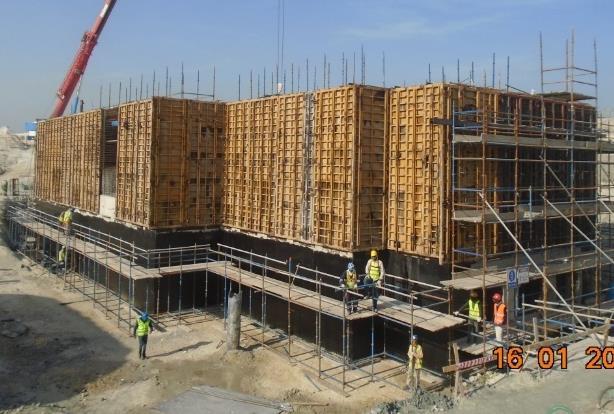
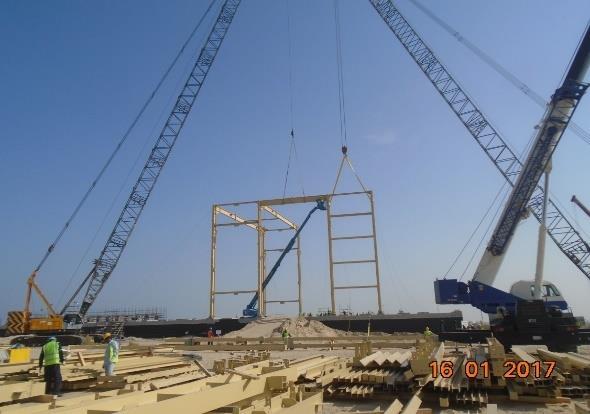
12 Khafji Project (Key Technical Items) Pumps Manufacturing Control System Cabinets UF Units assembly SWI RO Intake Pipes Installation 12
13 Project Milestones Milestone 2 Milestone 1 Milestone 3 Milestone May June July August September October November December January February March April November 2017 Milestone 1 Milestone 2 May 16 Jan 17 Jun 16 Dec 16 (Arrival of long lead items: Main pumps, Screening System) (Completion of main civil works) Milestone 3 Milestone 4 May 16 April 17 (Completion of marine works) November, 2017 (Start of Commissioning) 13
14 1 Changing the Game 2 Sustainability Features 3 Alkhafji Project 4. Process Overview 4 Process Overview 5 Video 14


15 Process Overview Water Balance Diagram at 40% with all 6 SWRO+ 6BWRO Racks online AWT - Khafji Plant Intake Tower Intake Pumps 8,390 m 3 Line Losses 0.37 barg #VALUE! barg Level Diferenc 0.36 barg 490 m 3 atm To Plant Common Drain 535 m 0.7 to 3 barg 7,900 m 3 /hr Recovery 93.19% 7,850 m barg 4.51 barg 535 m barg 3.69 barg Line Losses 0.20 barg Backflush Tank 7,850 m 3 /hr Line Losses 0.15 barg Recovery 99.37% dp 1.03 barg Recovery 94.16% - To common Drain (outfall) To Plant Ultra Filtration 50 m 3 atm Common Drain dp barg 535 m 3 atm Inline Strainers 7,315 m 3 /hr dp barg 2.72 barg 305 m 3 3 barg Line Losses Phase I 1st Pass Pumps 1,270 6 Units 7,620 m 3 /hr Phase I SWRO 6 Units 0.14 barg 2nd Pass Pumps 6 Units BWRO 6 Units PHASE I 3,096 m 3 /hr 3,048 m 3 /hr 3,048 m 3 /hr 2.58 barg 4,524 m 3 /hr 2,743 m 3 1 barg Booster Pumps 4,572 m 3 atm To common Drain (outfall) 4,524 m 3 /hr 2.58 barg Energy Recovery Units Post Treatment Plant To Storage Tank Permeate Tank 2,743 m 3 ## barg 2,743 m 3 atm 65, m 3 ## barg 15
16 Process Overview Plant Operating scheme when all trains are in operations Total number of SWRO 40% SWRO Recovery : 6 Total number of BWRO 40% SWRO Recovery : 6 RO total gross water 40% SWRO Recovery : 65,836 m 3 /day Plant Operating scheme during CIP or Maintenance of 1 train Total number of SWRO 44% SWRO Recovery : 5 Total number of BWRO 44% SWRO Recovery : 5 RO total gross water 44% SWRO Recovery : 60,350 m 3 /day 16
17 Process Overview Electrical System and Control System Scheme Two 30 MVA (34.5/4.16 KV) transformers are connected to 4.16KV switchgear 4.16KV switchgear (4.16KV, 2500A, 25KA / 3Sec) is feeding the MV drives of the Plant Siemens PCS 7 will be the control system for the project 17
18 1 Changing the Game 2 Sustainability Features 3 Project Millstones 5. Video 4 Process Overview 5 Video 18

19 Al Khafji SWRO 19

20 وشكرا لكم For more Information 20