Climate Change and the Transport Sector
|
|
|
- Egbert Taylor
- 5 years ago
- Views:
Transcription


1 Climate Change and the Transport Sector National Sustainable Transport and Business Conference LIT Campus Thurles 25 th May Laura Behan Climate Change Unit Department of Transport, Tourism and Sport

2 Overview Understanding the Irish Transport Sector Making policy choices
3 Transport - Climate Change Challenges Transport is a derived demand ( Economic growth Transport Demand) Dispersed settlement patterns and population growth Economic affordability/competitiveness/brexit Embedded dependency on oil High marginal abatement costs


4 Population, Settlement & Travel Patterns
5 Population Statistics 4.85 % Population Change by County Population (Millions) Source: CSO Population in the 2016 Census: 4.76m Over the last 10 years the population has grown by over 0.5m


6 Population Statistics - Settlement Patterns Area Population 1991 Population 2016 % Change Cities and suburbs 1,271,632 1,609, Towns 1,000-10, ,411 1,376, Rural and small towns 1,434,676 1,776, Population 34% 29% 37% Spread:

7 Why we travel journey purpose
8 How we travel mode shares Public Transport 6% CycleOther 2% 2% Densely Intermediate Thinly Overall Walk 14% Car Walk PT Cycle Other Total Car 76% Source: National Travel Survey
9 How we travel mode shares Passenger Transport Modal Share -- Average (EU Comparison) % EU (28 countries) Ireland United Kingdom Germany Bulgaria (similar pop. Density) Croatia (similar pop.) Finland (similar GDP) Netherlands (Highest Ranked for Infras.) Trains Buses Cars Source: Eurostat

10 Commuting: Travel to work: Origin & destinations for major workplace catchments Source: CSO 2011

11 Population Statistics: Projections Source: CSO
12 Economy and Transport
13
14 Increasing Transport Demand 2014: 1.7% Increase in Total Road Kms Driven 2014: 1.6% Increase in Maritime Freight Handled 2015: 3.6% Increase in Public Transport* Passengers 2015: 15% Increase in Passengers at Dublin Airport
15 Climate Change and Emissions
16 Global Trends Source: Grepolis Forum 2016 is set to be the warmest on record (since the late 19th century) (WMO) Average surface temperatures 1.2 C above pre-industrial times

17

18 113 tonnes of GHG every minute every day


19 Irish GHG Emissions 1990 Energy Agri Transport 37.4% 20.4% 29% 23% 33% 19.7% Agri Energy 9.2% 19% 19.8% Source: EPA Transport

20 Transport Emissions c. 16% from HGVs Transport CO 2 emissions % by mode 2014 (SEAI 2015)
21 Car Emissions CO 2 emissions from new cars Source: SEAI, 2014 Roads: Ireland s road network has become busier over the past two years with a 1.7% increase in of total kms driven. As well as a 31% increase in the number of new vehicles licensed in 2015


22 Road Freight Emissions Freight accounts for 24.7% of CO 2 emissions Road Freight: 2007 peak of 299 million tonnes Steady increase since 2012 The total number of tonnes kms fell from 18.7 billion in 2007 to 9.1 billion in In 2015, 86.3% of road freight activity as measured by tonne-km was carried out over distances greater than 50 kilometres million tonnes of goods (47.6%) was transported over these longer distances


23 Transport Emissions Transport Energy Use by Fuel Mode Comparisons
24 Emissions Targets for Ireland and Mitigation Response
25 National Mitigation Plan Policy context % below 2005 EU Effort Sharing Decision sets Ireland a target of a 20% reduction in non-emissions Trading Scheme sector by 2020 By 2020, the non-ets sector, as a whole will at best be 6% below 2005 levels. Transport emissions projected to remain the same or, at best, decrease by 4% by negotiations EU Paris commitment means non-ets sectors would need to cut emissions by 30% - Ireland s effort-sharing under negotiation (30% headline) 2050 goal Long-term goal of reducing greenhouse gas emissions by 80-95% (compared to 1990 levels) requiring an aggregate reduction in carbon dioxide (CO2) emissions of at least 80% across electricity generation, built environment and transport sectors In parallel, an approach to carbon neutrality in the agriculture and land-use sector, including forestry, which does not compromise capacity for sustainable food production

26 Story so far for Non-ETS Emissions % below 2005 EU s Effort Sharing Decision sets a target of a 20% reduction in non-emissions Trading Scheme sector by negotiations EU Paris commitmentof at least 40% reduction in GHG emission by 2030
27 Story so far for Transport Emissions Source: SEAI 27

28 Response?


29


30
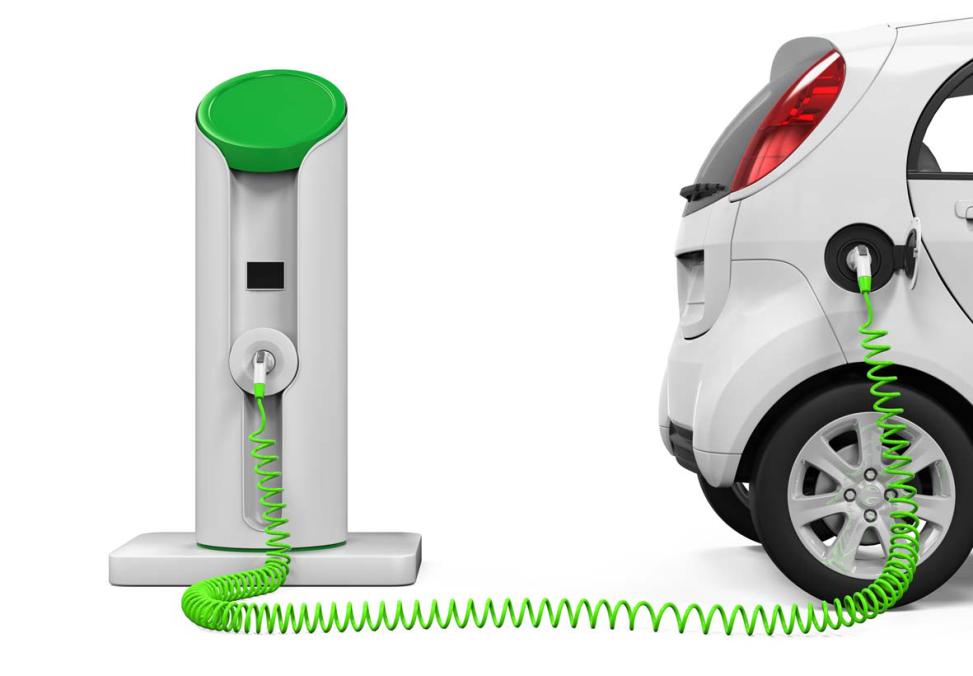
31 Irish Policy Measures Reducing congestion and supporting modal shift: Investment in public transport, walking and cycling Improved vehicle standards and fuel efficiency: Motor tax and VRT Demand management: Integrated planning (schools/workplaces/businesses) Alternative Fuels including Biofuels & Biofuel Obligation Scheme Existing Taxation/Fiscal Measures : NG Excise Duty/Accelerated Capital Allowances/EV Grant Infrastructure: Good network for recharging points for EVs, new CNG refuelling stations under construction Energy efficiency including Eco-driving
32 Transforming Your Business


 in operation worldwide -")


33 Alternative Fuels Alternative Fuel Options - electricity, hydrogen, and natural gas Electricity for private car fleet and LGVs zero emissions, renewable electricity Natural gas potential interim solution for larger vehicles i.e. large buses and HGVs.. CNG offers natural pathway to renewables such as biomethane Natural Gas: - 19 million Natural Gas Vehicles (NGVs) in operation worldwide million in operation in Europe - Technical performance equivalent to diesel - Vehicles currently available Less polluting : 22% less CO ² 70% less nitrogen oxide 80% less sulphur dioxide 99% less particulate matter Fuel cost: Savings range from 17% to 35%. Set excise duty will be applied to CNG for the next 8 years.


: Carbon")

34 CNG- GNI and Topaz- first publiclyaccessible CNG station in Ireland at Dublin Port Fast fill facility: 70 HGVs < 5 mins First in a network of 70 filling stations Causeway project (CEF Funding): 14 stations Biogas (renewable natural gas): Carbon Neutral fuel to the commercial transport market for the first time. Natural Gas
, has potential to sign")
35 Eco-Driving The energy efficient use of vehicles using driving techniques that can lead to average fuel savings of 5-10%. Improved awareness and information, aimed primarily at commercial fleets (HGVs and Buses), has potential to significantly impact reduce emissions and fuel..e.g. IÉ: advises drivers when to coast rather than power based on known topography, load, and timetabling (save up to 5% on fuel use) BÉ and DB: Eco-Driving training and 280+ (BÉ ) vehicles fitted with an on-board driving style improvement system. Potential grant scheme for HGV /bus operators to train drivers in eco-driving techniques and install in-vehicle technology to assess and improve driver behaviour?


36 Staff Commuting.. Smarter Travel Workplaces
37