Application of Hydrologic Scaling:
|
|
|
- Molly O’Connor’
- 5 years ago
- Views:
Transcription


1 Purdue University Agricultural & Biological Engineering Application of Hydrologic Scaling: Effect of Spatiotemporal Variability on Hydrologic Response Rabi H. Mohtar 1, Majdi R. Abou Najm 1, Keith Cherkauer 1, Brian French 2, Erik Braudeau 3, Dennis Flanagan 4, Jim Frankenberger 4 1 Purdue University, Agricultural & Biological Engineering 2 Purdue University, College of Education 3 Institut de recherché pour le développement (IRD), France 4 USDA-ARS NSERL, West Lafayette, IN ABE 325

2 Learning Objectives Successful completion of this Lecture will allow you to: Utilize computer simulation models in evaluating management practices; Evaluate the effect of local management practices on hydrologic responses; Evaluate the effect of spatial variability on the hydrologic response; Recognize the implications of hydrologic scaling on decision making and environmental policy. This Presentation can be accessed from:
3 Spatial and Temporal Scales in Natural Systems Space (meters) Large hydrologic Basin Small watersheds Plot Pedostructure REV Nano chemical/ physical processes Time years seconds

4 Soil Structure Hierarchy Scaling CHALLENGE: crossing scales Clay particles Primary soil mapping Primary soil unit Soil mapping type unit RE Pedon V Primary peds Inter-ped pore space Mineral grains Clay pore space Geomorphological unit Pedostructure, primary peds, primary particles, are functionally defined and quantitatively determined using the shrinkage and potential curve measurement Horizon = Vertical porosity (cracks, fissures) + Pedostructure Pedostructure = Interpedal porosity (macro-porosity) + Primary peds and free mineral grains Primary ped = Clay plasma porosity (micro-porosity) + Primary particles and pedological features Soil is no longer looked at as a bundle of 1D tubes
5 Soil-Water Interaction This figure shows the soil-water interactions during drying and wetting cycles. Microflow region Macroflow region Specific structural volume V dm 3 /kg K re A w bs +max(w re ) w re K bs B N (1) N w re M D C M w bs w st +max(w bs ) w ip +max(w st ) (2) (3) w st F L E L (4) K st 1:1 K bs Saturation line w ip Water content W kg kg -1 Braudeau, Frangi and Mohtar (SSSAJ, 2004)
6 Model Development Micro- in Macro-pore Systems During Drying Organizational levels : Pedostructure Macro-porosity (Inter-peds porosity) S ns S ns S sw S sw Primary peds Micro-porosity (clay plasma porosity) Drying Using the shrinkage curve Each pore system is characterized by its - saturation state : empty, unsaturated, saturated - swelling state : minimum, intermediate, maximum Braudeau, Frangi, Mohtar (SSSAJ, 2004)
7 Moving across scales: maintaining physics! The concept of transfer of information from small space/timescales to large space/timescale with all the variability involved must be well understood. Source: Bloschl & Sivapalan, 1995
8 Spatial scales Plot: 10 s of sq. meters Hillslope: 10 s to 100 s of sq. meters Catchment: 1000 s of sq. meters Basin: 10 s to 100 s of sq. kilometers Continental: 1000 s of sq. kilometers Typical scale of observations Typical scale of management decisions Source: Dr. Bowling, AGRY399W
9 Temporal scales Sub-hourly - seconds to minutes Hourly minutes to hours Diurnal hours to days Seasonal months to years Interannual years to decades Decadal decades to centuries Typical scale of observations Typical scale of management decisions Source: Dr. Bowling, AGRY399W
10 Watershed Equilibrium Context Geology Climate weathering Soils Water New distribution of water with respect to: atmosphere channels soil moisture Vegetation Biological interactions Changes to soils, biological communities, vegetation or water distribution (i.e. environmental change ) Environmental Change Courtesy: Dr. Laura Bowling, Managed Landscapes and Streamflow Hydrology, Presentation, 2007
11 Simulated streamflow w/ and w/o forest roads Hard Creek Ware Creek 17% increase Hard Creek Ware Creek 14% increase w/ forest roads w/o forest roads Bowling and Lettenmaier (2001), The effects of forest roads and harvest on catchment hydrology in a mountainous maritime environment Courtesy: Dr. Laura Bowling, Managed Landscapes and Streamflow Hydrology, Presentation, 2007

12 Stripping and Compacting Soil Top soil frequently removed and sold before construction begins Reduces infiltration capacity Reduces soil moisture storage capacity Increases runoff Courtesy: Dr. Laura Bowling, Managed Landscapes and Streamflow Hydrology, Presentation, 2007

13 Impervious Surfaces Infiltration capacity is zero Increased runoff Increased slopes and faster runoff Decreased water storage and lower baseflows Courtesy: Dr. Laura Bowling, Managed Landscapes and Streamflow Hydrology, Presentation, 2007

14 Sewers and drainage density Courtesy: Dr. Laura Bowling, Managed Landscapes and Streamflow Hydrology, Presentation, 2007

15 Courtesy: Dr. Laura Bowling, Managed Landscapes and Streamflow Hydrology, Presentation, 2007


16 Source:
17 Field Study Impervious Surface Configurations Peripheral Development Courtesy: Dr. Pappas, ARS, USDA, NSERL Channel Development
18 Best Management Practice Types Urban Landscapes Transportation Surface Pervious Pavers Roof Green roof Rain barrel Pervious Surface Bioretention cell, bioswale, rain garden Compost / amendment Surface tillage / aeration Spatial Considerations Low Impact development / planned communities

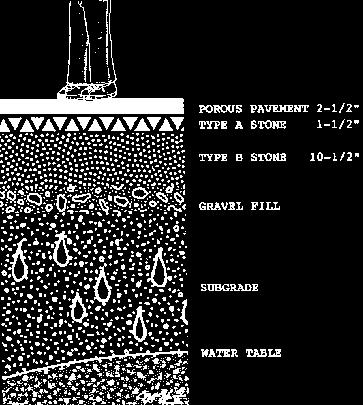
19 Porous Concrete
20 Best Management Practice Types Rural Landscapes Terraces; Grass waterways; Tillage; Cropping systems; Surface and subsurface drainage system; Wetlands; Buffer strips.

21 Courtesy: Mike Cox, NRCS, State Engineer, Indianapolis, IN.

22 Courtesy: Mike Cox, NRCS, State Engineer, Indianapolis, IN.

23 Courtesy: Mike Cox, NRCS, State Engineer, Indianapolis, IN.

24 Courtesy: Mike Cox, NRCS, State Engineer, Indianapolis, IN.

25 Courtesy: Mike Cox, NRCS, State Engineer, Indianapolis, IN.


26 Hillslope Soil Erosion Processes USDA-NRCS
27 USLE: A = R K L S C P Advantages Large Database Simple Equation Structure Could be easily implemented in field in table form Simplicity allowed its insertion and use in other models Disadvantages Empirical nature - difficult to extend to conditions outside original database Black box - pick numbers and get answer - no description of actual erosion processes Estimates of sheet and rill detachment only - USLE database did not cover plots on which deposition was occurring No estimates of sediment delivery from fields, except in special cases Difficult to simulate nonuniform slope shapes No ephemeral gully erosion
28 WEPP (Water Erosion Prediction Project Description 1. Process based 2. Distributed parameter 3. Continuous simulation 4. Erosion prediction model implemented on personal computers 5. User-friendly interface & file creation utilities Advantages 1. Models the important physical processes which govern erosion (climate, infiltration, plant transpiration, soil evaporation, detachment by raindrops, detachment by flowing water, deposition, etc.) 2. Simulation of nonuniform slope, soils, cropping and management 3. Large US databases for climate, soils, crops 4. Temporal and Spatial estimates of erosion 5. Estimates of deposition and sediment delivery from hillslopes (overland flow) 6. Estimates of detachment and deposition of sediment in ephemeral gullies and other channels 7. Estimates of sediment deposition in impoundments
29 WEPP Disadvantages Use limited to small watersheds and hillslopes limited to rainfall/snowmelt/irrigation - runoff no perennial stream processes no classical gully erosion processes Large number of model inputs required due to many components. Must populate databases to make WEPP an easily-used tool by field level conservationists.
30 WEPP Major Components 1. Climate Simulation 2. Surface & Subsurface Hydrology 3. Water Balance & Percolation 4. Soil Component (Tillage Impacts) 5. Plant Growth & Residue Decomposition and Management 6. Overland Flow Hydraulics 7. Erosion Component
31 WEPP Input 1. Slope File 2. Soil File 3. Climate File 4. Management File 5. Irrigation File (optional) 6. Watershed structure file (watershed) 7. Channel parameter file (watershed) 8. Impoundment parameter file (watershed)
32 WEPP Output 1. Daily, monthly, annual, and/or average annual precipitation, runoff, soil loss, etc. 2. Graphical depictions of erosion and deposition on hillslope profiles 3. Graphical viewing of daily parameter and model output values (list of 92 variables) 4. Special text output files with information on plant growth, soil, water balance, etc.
33 Study the Effect of Spatiotemporal Variability on Hydrologic Response and BMP selection using WEPP Study the effect of hillslope geometry and BMP location on hydrologic response
34 Study the Effect of Spatiotemporal Variability on Hydrologic Response using WEPP Case 1: buffer strip upstream Case 1: buffer strip upstream Case 1: buffer strip upstream Case 2: buffer strip in middle Case 2: buffer strip in middle Case 2: buffer strip in middle Case 3: buffer strip downstream Case 3: buffer strip downstream Case 3: buffer strip downstream
35 WEPP: Effect of different slope patterns on the hydrologic response and BMP selection
36 Effect of slope variation on the hydrologic response and BMP selections
37 Effect of slope length on the hydrologic response and BMP selection
38 Conclusions Spatial configuration of impervious surfaces impacts hydrology at low rainfall intensity and soil moisture Spatial configuration of impervious surfaces has major impacts on soil erosion at higher rainfall intensity and soil moisture, with channel type development causing less erosion than peripheral type development.
39 gt~x [ÉÅx `xáátzx hçwxüáàtçw à{x véçvxñà Éy ávtä ÇzN hçwxüáàtçw à{x Ä Å àtà ÉÇ Éy ávtäx ÉÇ tçç ÅÉwxÄN hçwxüáàtçw à{x xyyxvà Éy áñtà tä ätü tu Ä àçn hçwxüáàtçw à{x xyyxvà Éy àxåñéütä ätü tu Ä àça More importantly, you can t understand an elephant except if you interact with the whole elephant!
40 Web-based WEPP ABE 325 link