The Urgency of Climate Change
|
|
|
- Michael Norris
- 5 years ago
- Views:
Transcription
1 The Urgency of Climate Change and the Role of Renewable Energy PSERC 2009 Summer Workshop July 10, 2009 Chuck Kutscher National Renewable Energy Laboratory
2 Climate Change: The greatest hoax ever perpetrated on the American people?
3 50 Years Ago
4


5


6
7 "For every shrinking glacier there is a growing one--but the growing ones get much less attention." - Christopher Horner, The Politically Incorrect Guide to Global Warming, pg. 66

8 World Glacier Monitoring Service Advancing Retreating In glaciers studied: - 26 advancing - 18 stationary retreating


9
10
11
12

13

14


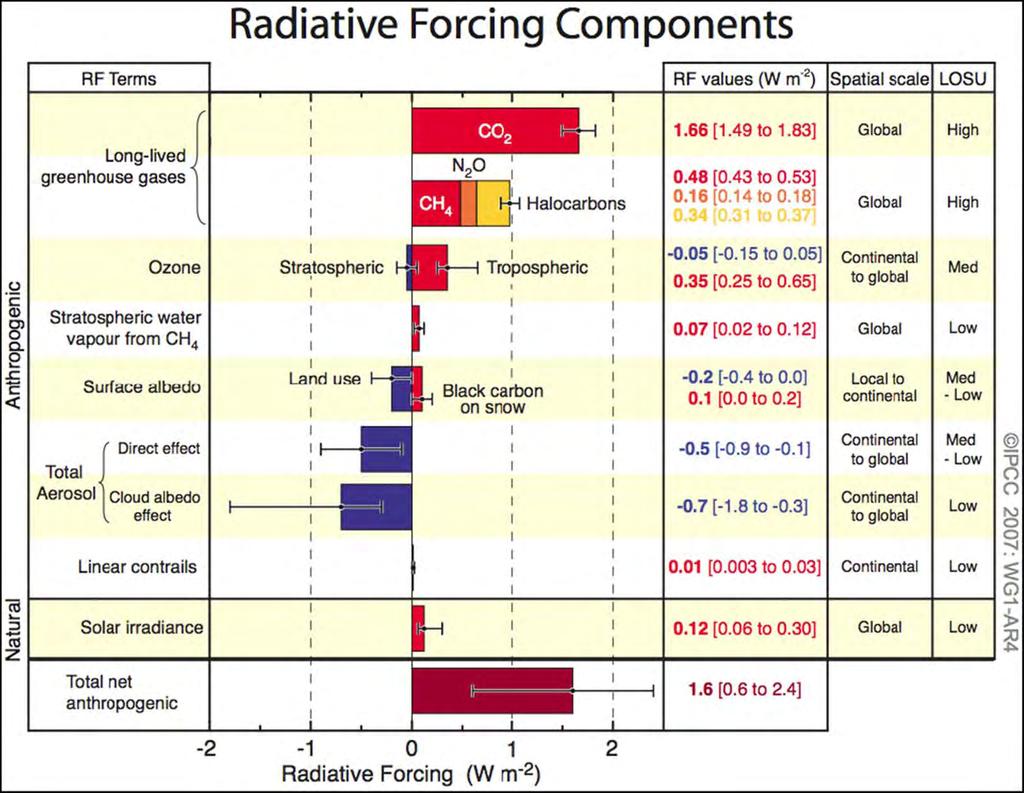
15 2007 IPCC Report Warming of the climate is unequivocal...very likely due to anthropogenic greenhouse gas concentrations.
16 IPCC Scenarios vs. Actual Emissions Source: Chris Field, Stanford University

17 What the latest IPCC study did not include: future rapid dynamical changes in ice flow


18

19 Sources: NCAR and National Snow and Ice Data Center

20 Arctic Sea Ice Is Getting Thinner September 2007 September 2008


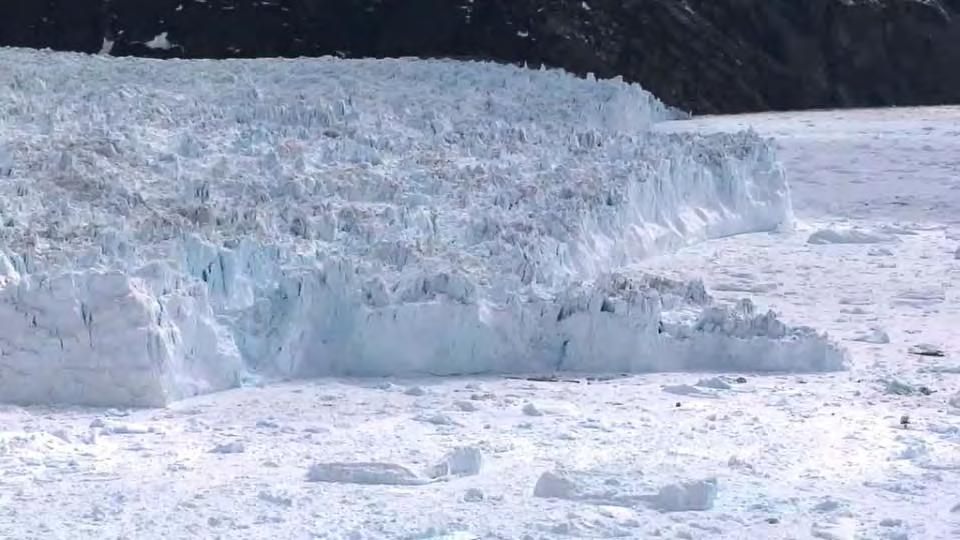
21 Iceberg-choked fjord created by rapid retreat Courtesy of Robert Bindschadler Rapid Retreat Average speed 5 ft per hour! Jacobshavns Isbrae
22 Qarassup Glacier Greenland June 9, :12 p.m.
23
24

25

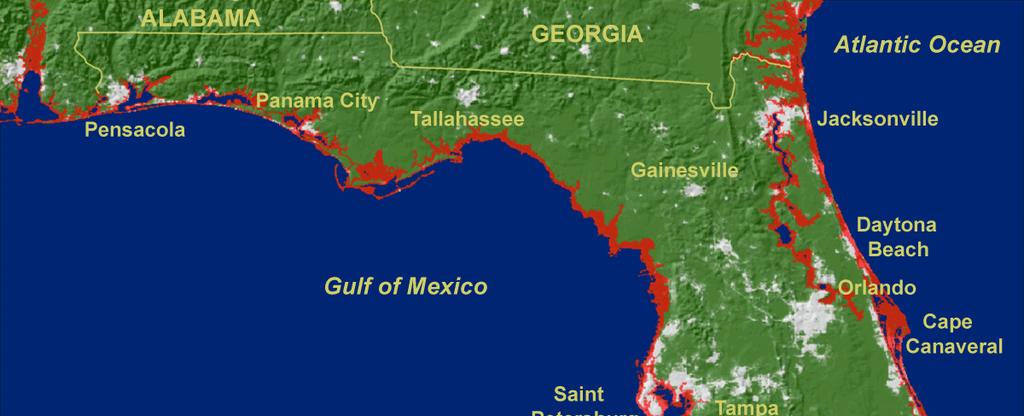
26 The last time a large ice sheet melted, sea level went up one meter every 20 years. Dr. James Hansen, Director Goddard Institute for Space Studies
27
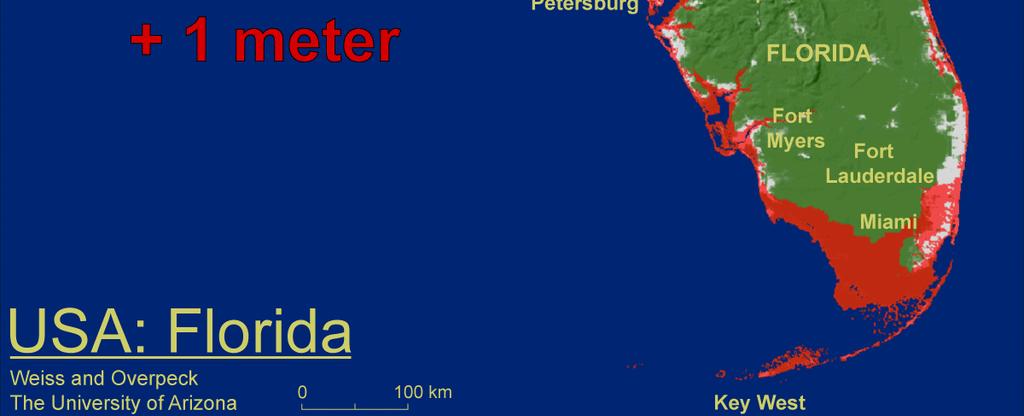
28
29

30


31 Two Dangerous Feedbacks Loss of forests Melting permafrost
32


33 How long can you operate in the red?...with your car s engine?...with your planet?


34 SOLAR 2006, Denver Renewable Energy: Key to Climate Recovery
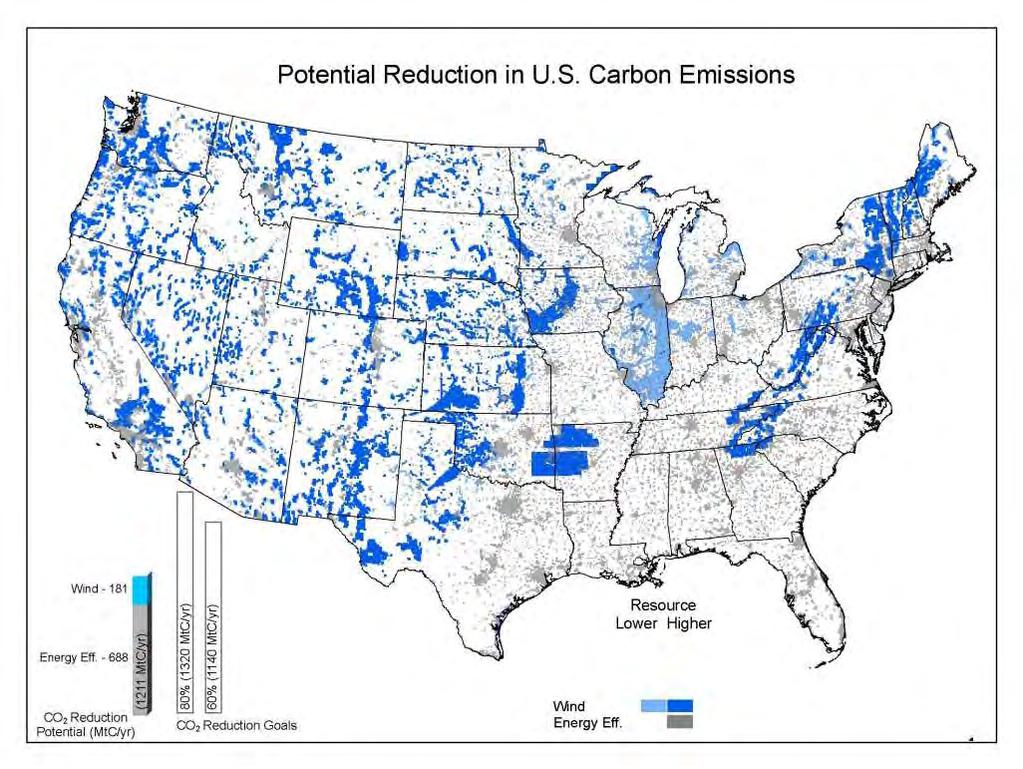
35 ASES Study Goals To limit sea level rise to 1 m and species loss to 20% this century Limit additional warming to 1 C beyond 2000 Reduce U.S. CO 2 emissions 60% 80% (?) by 2050 Total savings needed by 2030: ~1,200 MtC/yr
36 Key Energy Options Energy Efficiency Renewable Energy Coal with carbon capture and storage Nuclear power


37 Geothermal PV Biofuels Efficiency CSP Biomass Power Wind
 lighter weight vehicles, public transportation, better propulsion, PHEVs Industry (30%) heat recovery, better")
38 Energy Efficiency Buildings (40%) envelope design, daylighting, better lights, building and appliance efficiency standards Transportation (30%) lighter weight vehicles, public transportation, better propulsion, PHEVs Industry (30%) heat recovery, better motors, CHP
39
 Oil: 344 MtC/yr, $5 - $30/bbl Gas: 126 MtC/yr, $0 - $3/MBtu Savings: 688")
40 Energy Efficiency Savings Electricity: 218 MtC/yr, 0 4 /kwh (20% savings off 2030 projection) Oil: 344 MtC/yr, $5 - $30/bbl Gas: 126 MtC/yr, $0 - $3/MBtu Savings: 688 MtC/yr

41 Concentrating Solar Power (CSP)
42 354 MW Solar Electric Generating Systems (SEGS)

43
44 Exclude: - Used and sensitive land - Solar < 6.75 kwh/m 2 per day - Ground slope > 1%

45 What s Left Over 6X U.S. electric capacity!

46

47 State RPS Requirement Arizona 15% by 2025 California 20% by 2010 Colorado 20% by 2020, 4% Solar Nevada 20% by 2015, 5% Solar New Mexico Texas 20% by ,880MW (~4.2%) by 2015

48 New 64 MWe Acciona Solar Parabolic Trough Plant
49 Parabolic Trough Output Profile Summer Day
50 CSP Power Plant with Thermal Storage Hot Tank HX Cold Tank

51 CSP Power Plant with Thermal Storage Hot Tank HX Cold Tank


52 50 MW AndaSol-1 Parabolic Trough Plant w/ 7-hr Storage Andalucia, Spain


53 Planned 280 MW Solana Plant with 6 hrs Storage 1500 construction jobs over two years 85 permanent jobs Artist Rendition Renewable Energy


54 Contracts for over 4,000 MW of U.S. Projects 1,365 MW 1,750 MW 1,211 MW 177 MW


55 CSP Savings Dispatchable power with 6 hr of storage 80,000 MW, 6 to 14 /kwh Savings: 63 MtC/yr
56 the POWER of csp
57

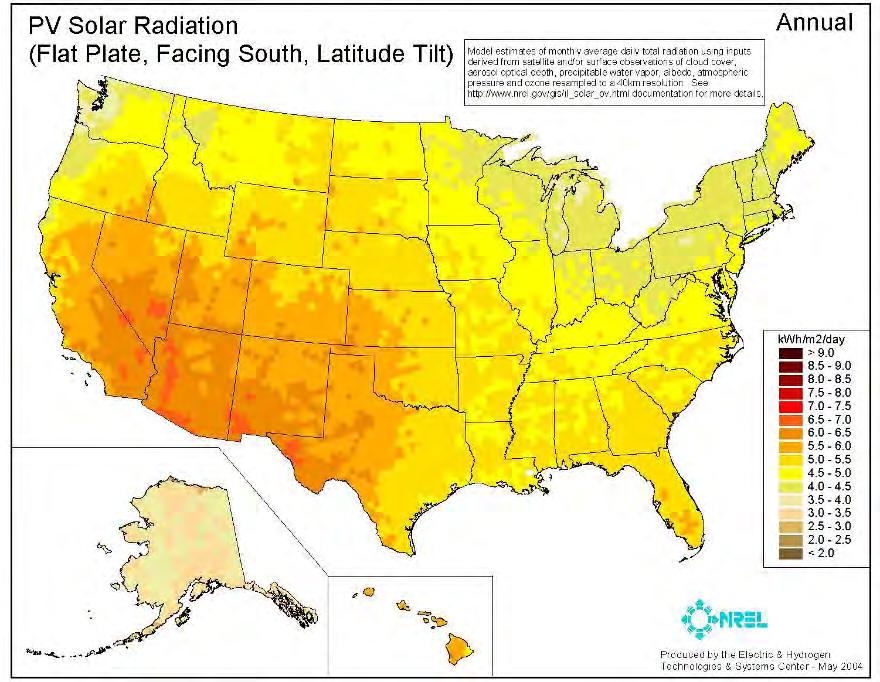
58 Photovoltaics (PV)
59
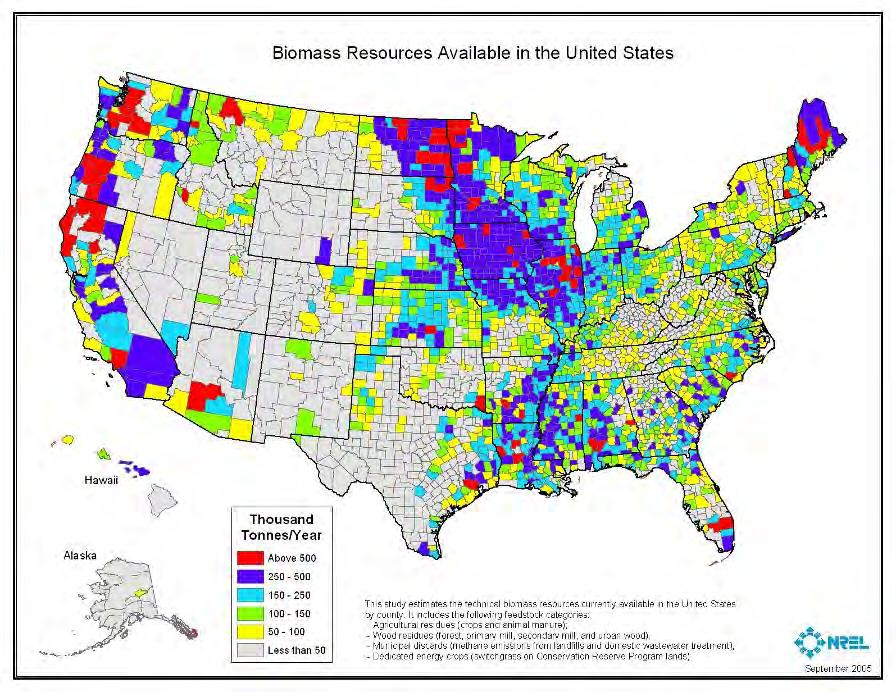
60 PV Module Prices

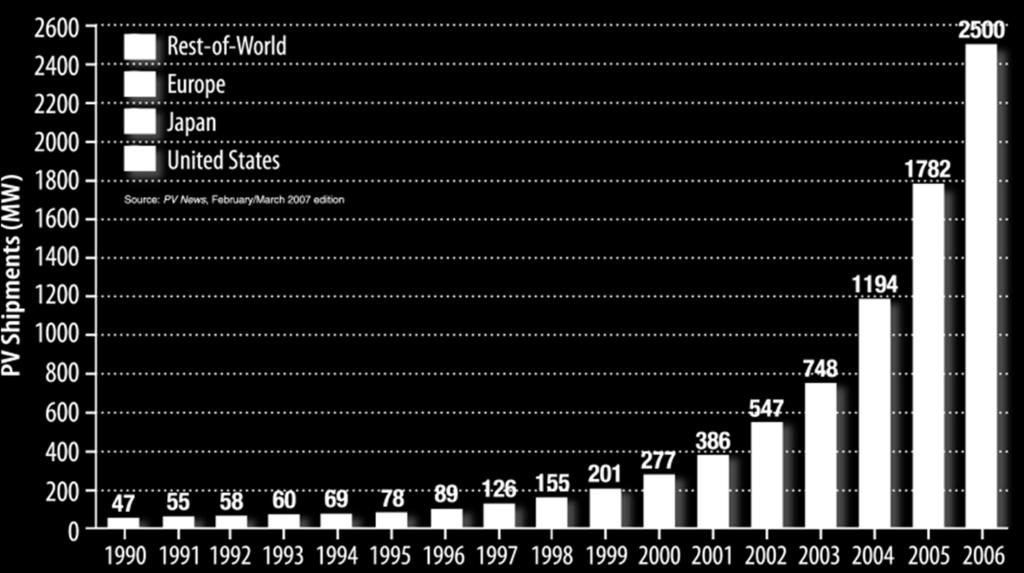
61 Worldwide PV Shipments
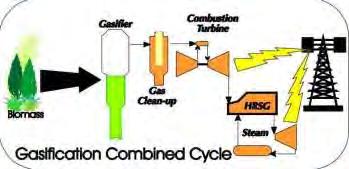
 Savings: 63")
62 PV Savings 200,000 MW p 6 to 28 /kwh (retail) Savings: 63 MtC/yr
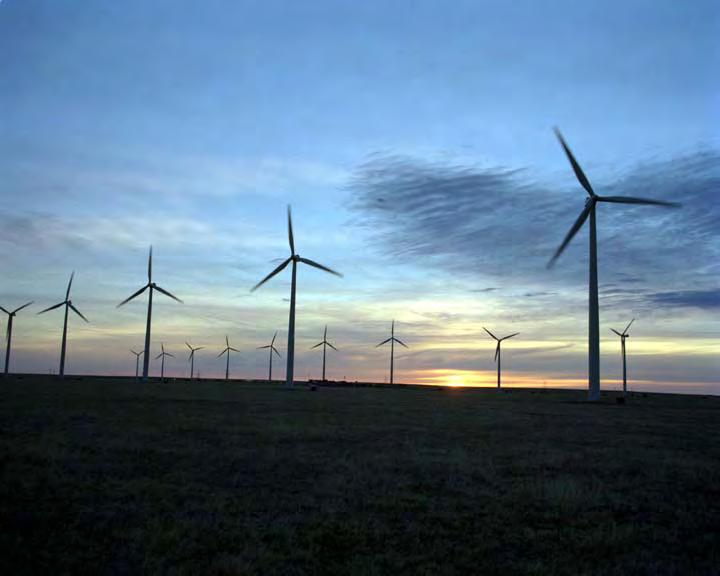
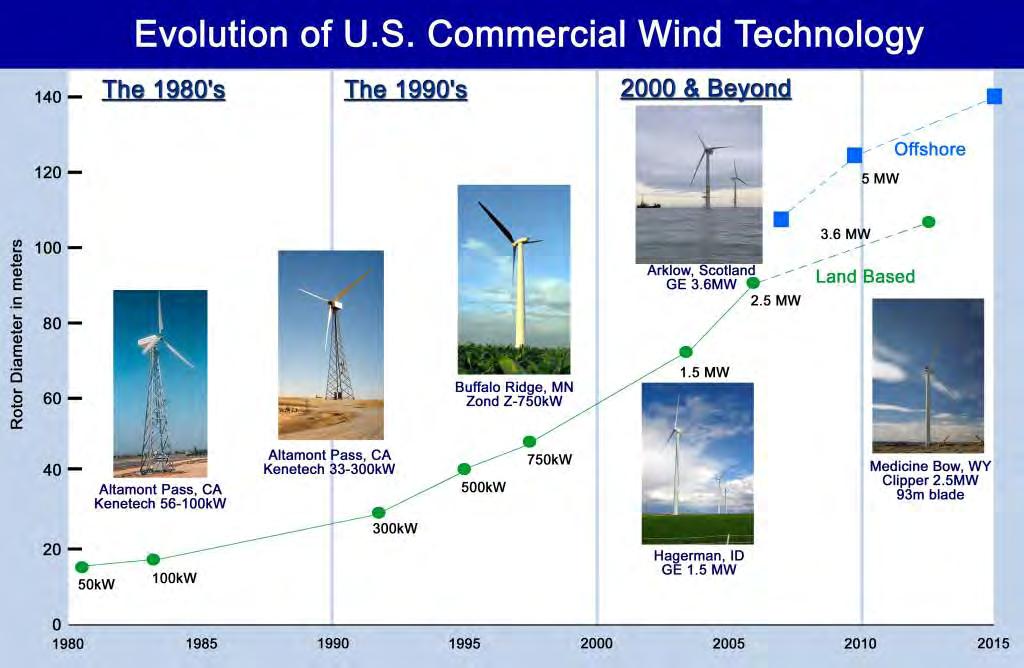
63 Wind

64 U.S. Wind Resource
65

66 Wind Power Capacity April 2009

67 Wind Savings 20% grid energy, 245,000 MW 3 to 7 /kwh Savings: 181 MtC/yr
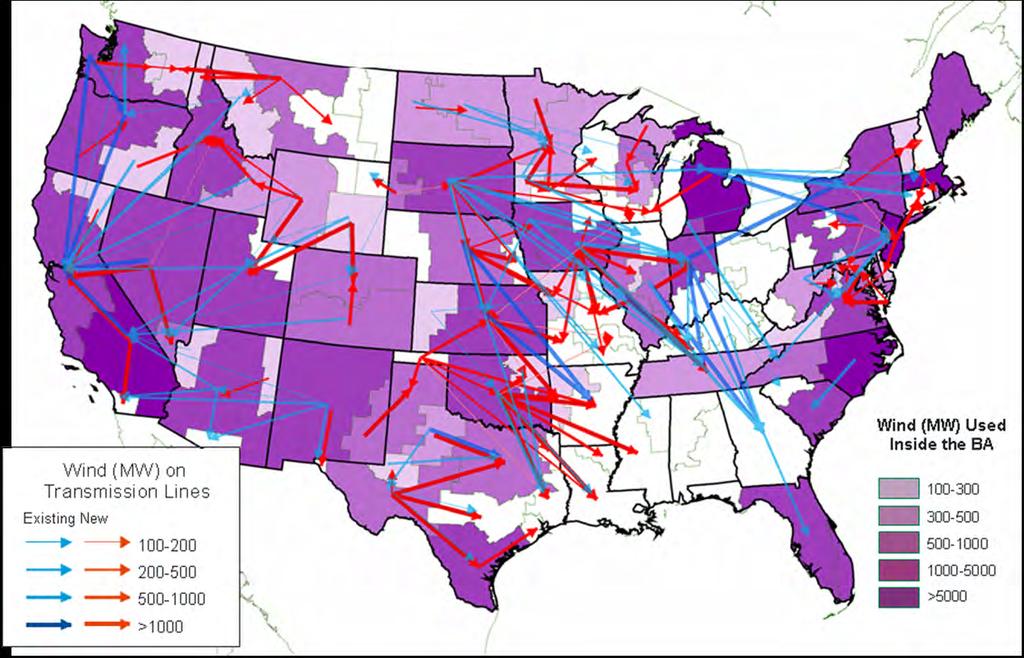
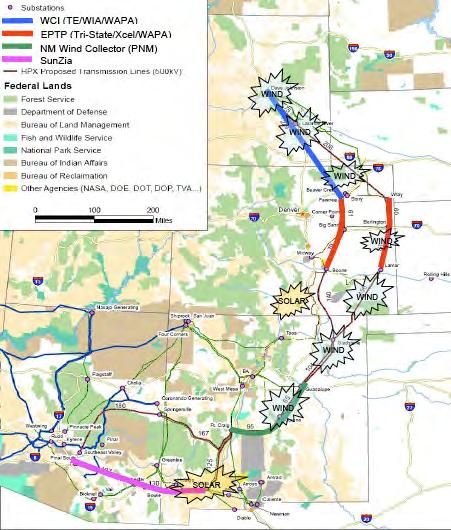
68 Wind Transmission 2030


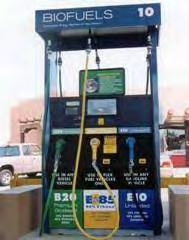
69 Biomass and Biofuels Wood chips Switch grass Poplars Fats and Oils Municipal solid waste Corn Stover
70


71 Biomass Power Direct combustion Co-firing Gasification

72 Biomass Power Savings Wood residues and municipal discards 45,000 MW 5 to 8 /kwh Savings: 75 MtC/yr


73 Routes to Biofuels Bio/chemical transformation Ethanol from sugars Biodiesel from renewable oils Thermochemical reduction to syngas (H 2, CO) Fischer-Tropsch diesel, gasoline Methanol, other alcohols
74 Biofuels Savings Ethanol from crop residues & energy crops Saves 28 billion gallons of gas in 2030 $0.90 to $3.75/gal gas equiv. Savings: 58 MtC/yr
75 Geothermal

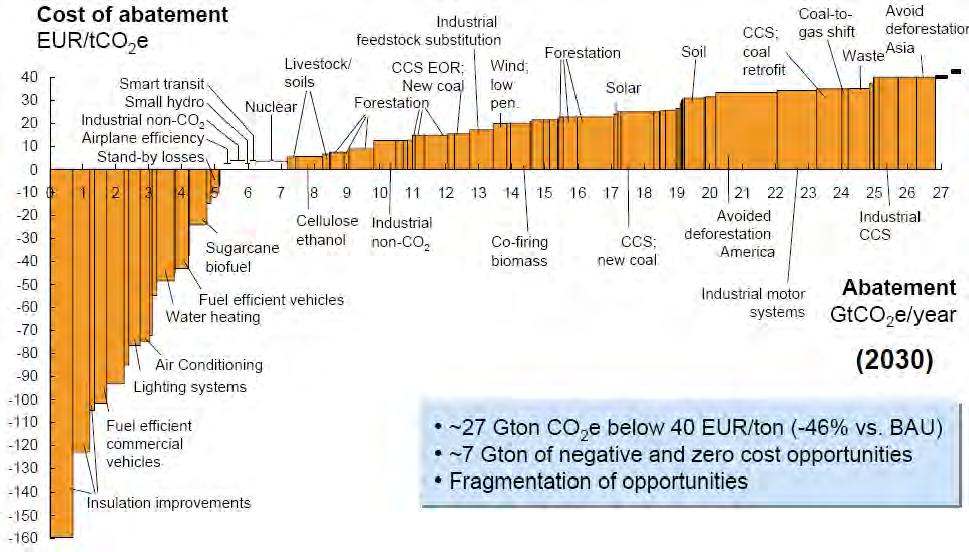
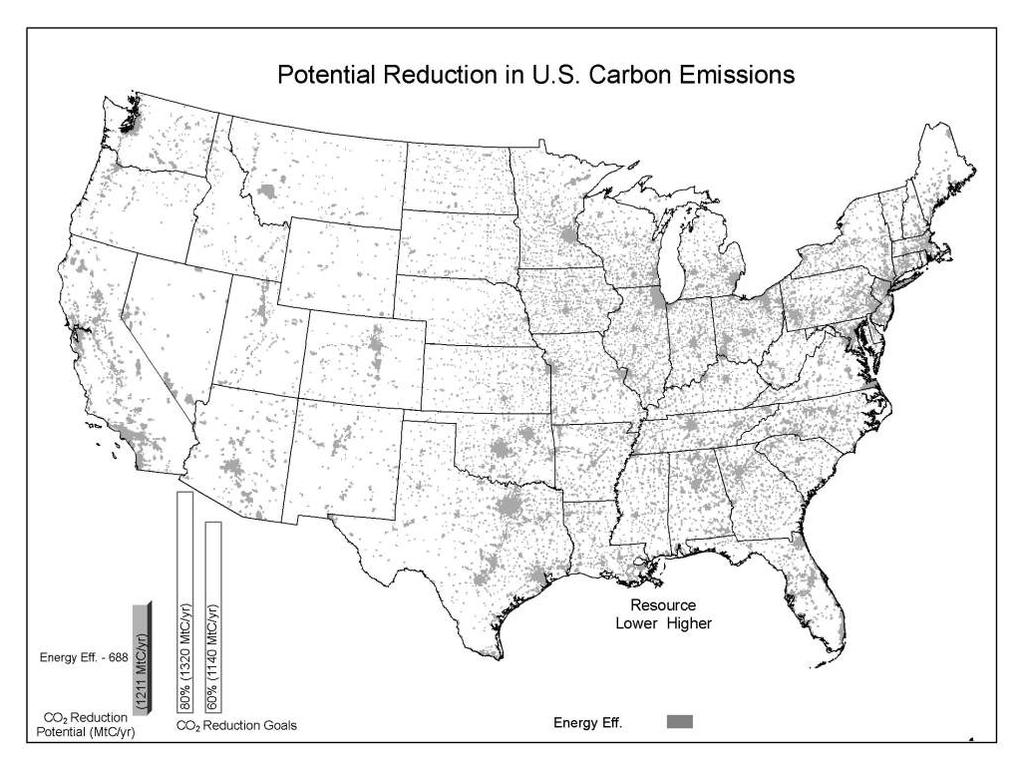
76 Temperatures at 6 km Depth

77 Geothermal Power Savings 50,000 MW 25% existing resources, 25% expanded, 50% from oil & gas wells 5 to 10 /kwh Savings: 83 MtC/yr

78 Putting It All Together
79
80
81
82
83
84
85

86 Potential U.S. Carbon Reductions What does it cost? -$108B/yr $0B/yr $9B/yr $3B/yr $5B/yr $7B/yr $2B/yr Total: Savings of $82B/yr 57% Energy Efficiency, 43% Renewables


87 Cost of Inaction Delayed action (or inaction) will most likely be the most expensive policy option Ackerman & Stanton, 2008 Stern Review: Cost of action 1% of world GDP Cost of inaction = 5% to 20% of world GDP


88 Houston, we have a solution!

89 ASES report released Jan. 31, 2007 Available at: climatechange
90 Grid Integration Issues
")
91 Spatial Diversity Can Mitigate Intermittency Utility balancing areas can combine or cooperate large electricity markets (example: Denmark/Europe)

92 Spatial Diversity Smoothes Wind Farm Output

93 Solar and Wind Complementary: Diurnal

94 Solar and Wind Complementary: Annual 400 Hours of sunshine or average wind power (Watts/m 2 ) Data from SE Iowa Average wind power/month Hours of sunshine/month Jan Feb Mar Apr May Jun Jul Aug Sep Oct Nov Dec
95 PV Coincidence With Load Summer, ERCOT 16 GW simulated PV system providing 11% of system s energy
96 PV Coincidence With Load - Spring Potentially curtailed PV 2000 Normal Min Load
97 Wind Curtailment in Denmark Denmark has access to large export markets Lennart Söder,KTH, Sweden, presented at UWIG, Oct 23-25, 2006

98 Does wind need backup or new storage? New storage has value but may not be cost effective There is typically already storage on the system Natural gas in the pipeline or storage facility Controllable hydro A recent study by Xcel Energy in Colorado found existing pumped storage provided $1.30/MWh offset to wind integration cost Enlarging existing gas storage facility was economic at large wind penetration
99 PHEVs* Can Increase Wind Penetration * Assumes 50% PHEV-V2G penetration by 2050

100 Grid Integration Costs (Arizona Public Service)
101


102 Load Duration Curve 36% of capacity provides 4% of total energy 51% of capacity provides 85% of total energy
103
104

105 Visit us online at National Renewable Operated Energy for Laboratory the U.S. Department of Energy Office of Energy Efficiency and Renewable Energy by Midwest Research Institute Battelle