Lake Monitoring Report. Acadia National Park
|
|
|
- Reginald Hudson
- 5 years ago
- Views:
Transcription

1 Acadia National Park Lake Monitoring Report -5 Prepared by Emily M. Seger, W.G. Gawley, R.M. Breen January ANP Natural Resource Report -
2 Acadia National Park Lake Monitoring Report: to 5 Emily M. Seger, W.G. Gawley, and R.M. Breen. Acadia National Park Natural Resource Report -. ABSTRACT This report outlines the goals, objectives, and methods of the Acadia National Park lake monitoring program, and summarizes the data collected in the through 5 seasons. Field measurements and water samples were taken monthly at ten park lakes from May through October each year, providing data for a variety of water quality parameters that can serve as indicators for the effects of atmospheric deposition, cultural eutrophication, and climate change. The monitoring data indicates that the lakes recovered from the effects of the 1 drought in. Secchi transparency and lake water levels followed the precipitation trends of the seasons. Dissolved oxygen, ph, acid neutralizing capacity, and nutrients all generally appeared to be relatively stable with concentrations generally within the historical range of variability for these lakes. Although no statistical analyses were performed in this report to determine long-term data trends, a primary recommendation is that such an analysis be conducted to enhance the understanding of the current condition of the park's aquatic resources. INTRODUCTION Freshwater resources at Acadia National Park (ANP) include named lakes (Figure 1), 3 named streams, and numerous wetlands within or adjacent to the park boundary. The current lake monitoring program has largely evolved from recommendations of a 1997 workshop designed to develop long-term monitoring strategies for ANP freshwater resources, and guidance outlined in the Acadia National Park Water Resources Management Plan (WRMP) (Kahl et al., ). Specific monitoring protocols have been selected to provide the information needed to detect changes in aquatic ecosystem structure and function caused by natural processes and human-induced factors. Lake monitoring forms the core of the longterm freshwater monitoring program at ANP, and is a cooperative effort involving park staff, the US Geological Survey (USGS), University of Maine, Maine Department of Environmental Protection (MDEP), volunteers and others. A representative subset of all park lakes, sampled monthly from May through October, makes up the foundation of the monitoring program. These lakes range in size from 1 acre to 897 acres, with maximum depths from less than 3 meters to more than 5 meters (Table 1). All water monitoring data are incorporated into a comprehensive ANP database that includes recent as well as historical water quality data for park waters. The major water related concerns that could affect ANP resources include atmospheric deposition, toxic contaminants within the watershed, input of nitrogen and other nutrients, and climate change. In addition to the lake monitoring program, park staff monitor benthic stream macroinvertebrates and bacteria at ANP swim beaches. There are also a number of water related research studies currently being conducted at the park that will help to better define water quality and watershed processes and function at ANP. 1


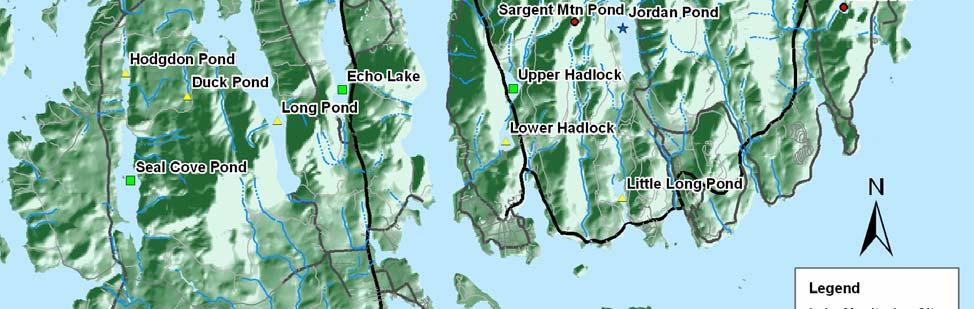
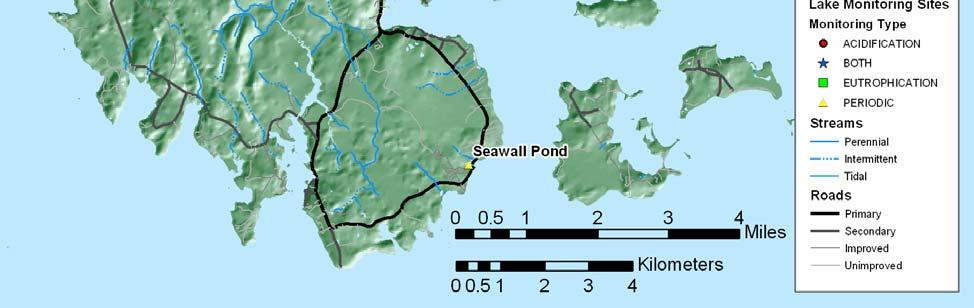
3 Figure 1: Acadia National Park Lake Monitoring Locations
4 MONITORING OBJECTIVES The primary objective of the ANP lake monitoring program is to detect changes in aquatic ecosystem structure and function; and determine if, and to what degree, human-induced factors are contributing to these changes. In order to measure human-induced changes it is necessary to determine the normal variability inherent in natural aquatic systems, and to establish baseline conditions from which future changes can be detected. Specific objectives of the lake monitoring program are: 1) characterize existing water quality conditions and establish a baseline for future comparisons; ) to serve as an early warning system for anthropogenic effects such as non-point source pollution (cultural eutrophication), climate change, and atmospheric deposition of acidic and toxic contaminants, nitrogen, and other nutrients; 3) assist in identifying potential sources of pollution; ) provide water quality data and information needed to manage and protect other ANP resources; 5) track long and short-term trends. As described previously, the process of designing a long-term monitoring program for freshwater resources was initiated at a workshop held in January of 1997 at ANP. Participants with diverse and multidisciplinary backgrounds represented a variety of state, federal agencies and academia at the workshop. The workshop concluded that the primary threats to ANP water resources are impacts associated with atmospheric deposition and nutrient enrichment (cultural eutrophication). Expanding and enhancing the existing ANP lake monitoring program was recommended as being a strategy to provide a broad foundation upon which additional water related monitoring and research can be supported. METHODS An Interim Report was prepared describing the 1997 workshop accomplishments, suggested monitoring priorities, and research and inventory needs (Kahl and Manski, 1997). Current monitoring protocols have been adopted based on recommendations in the Interim Report and guidelines identified in the WRMP. There has been no evaluation of monitoring protocols and their effectiveness in addressing set objectives since the program s inception in Because of funding and staff limitations, annual comprehensive monitoring of all ANP lakes, streams and other surface waters is not realistic. However, lakes to a large extent reflect the hydrogeochemical processes that occur within their respective watersheds. Therefore, the current freshwater monitoring program focuses on a subset of park lakes that provide a range of geophysical and ecological conditions, and allows for a preliminary assessment of changes and impacts associated with human related activity. 3
5 Sampling locations The core monitoring design identifies three subsets of lakes to sample (Table 1.). The first, is a set of five lakes (Jordan Pond, Bubble Pond, Sargent Mountain Pond, The Bowl, and Witch Hole Pond) that are sampled to determine response to acidification and changes in atmospheric deposition. These lakes were selected to be representative of: a) the main large/deep water lakes on Mount Desert Island that are most associated with ANP (Jordan and Bubble ponds); b) smaller headwater and/or high elevation lakes most likely to show chronic acidification trends (Sargent, The Bowl); and c) an organically affected lake, as it is adjacent to wetlands (Witch Hole). The second subset includes five lakes sampled for indicators of nutrient enrichment (Witch Hole Pond, Upper Hadlock, Seal Cove, Echo Lake, and Jordan Pond). These lakes were selected to be representative of the broad range of ANP lakes vulnerable to cultural eutrophication primarily from surrounding residential development. These lakes were also selected based on a variety of physical and environmental factors (e.g. size/depth, morphology, trophic state, watershed/ ecosystem type, amount of watershed development, burned/unburned in a major fire in 197, amount/type of recreational and other human use). Jordan Pond was included on both lists because it is considered the "jewel of Acadia waters and perhaps the entire state. A third group of lakes that are sampled as part of the core lake monitoring program are lakes with existing long-term monitoring records (Secchi transparency, some chemical/physical parameters) and are not included in the first two lake sets. These lakes, Eagle Lake, Long Pond (MDI) and Bubble Pond (also included in the set of acidification lakes) are sampled a minimum of once monthly May through October for temperature and Secchi, ph, ANC, and dissolved oxygen/temperature profile. Lake Area (acres) Max. Depth (m) Wshed (acres) 1 Flush rate/yr. Trophic state ANP Bndry Fishery type Water supply Monitoring Regime The Bowl Mesotrophic within --- No Acidification Bubble Pond Oligotrophic within Cold Yes Acid./ LT Eutr. Eagle Lake Oligotrophic within Cold Yes LT Eutrophica. Echo Lake Oligotrophic borders Cold No Eutrophication Jordan Pond Oligotrophic within Cold Yes Acid./ Eutroph. Long Pond Oligotrophic borders c/w Yes LT Eutrophica. Sargent Mtn Mesotrophic within --- No Acidification Seal Cove Pond Mesotrophic borders Warm No Eutrophication Upper Hadlock Mesotrophic within Cold Yes Eutrophication Witch Hole Mesotrophic within Cold No Acid./ Eutroph. Table 1: Lakes monitored by ANP from 199-
6 Sample collection and analysis The analytes selected for the acidification and eutrophication sampling regimes (Table.), and the annual monitoring schedule (Table 3.), are essentially unchanged since 1997 and follow closely the recommendations of the workshop. Acidification parameters are analyzed at the University of Maine (UMO) lab on samples taken in April and October during spring and fall turnover. Eutrophication parameters are analyzed at the UMO lab on samples taken in June and August, to represent the spectrum of productivity developing through summer season. Two additional measurements have been added to the eutrophication sampling regime: water column light extinction/attenuation using a LI-COR radiation sensor (scaled back to 1 profile/lake during the 5 season), and weekly lake surface level (stage) monitoring during the open water season spring through fall. The lake sampling regime entails collecting half-meter deep grab samples from the deep hole (or center, in the case of lakes with uniform depth) of the lake for acidification chemistry, based on the assumption that early spring and late fall water columns are relatively homogeneous. For eutrophication chemistry, an epilimnion core sample (- meter depth) is collected at the deep hole if the lake is stratified, or a half-meter grab sample if unstratified. For lakes with poor accessibility by boat, a throw bottle was used in fall 3 and spring/fall and 5 to collect epilimnion grab samples. The throw bottle took samples at a depth of. meters, at a distance of about 9 meters from shore. Table. Analytes for eutrophication and acidification sampling Eutrophication Acidification Field temperature X X Secchi transparency X X ph, closed cell X X ph, equilibrated X ANC X Specific conductance X X True color X X DOC X X DIC X Ca, Mg, K, Na X NH, Si X SO, Cl, NO3 X Al (total dissolved) X Total P X Total N X X Chlorophyll a X Lake Stage X X DO/Temp. Profile X X 5
7 Table 3. Lake Monitoring Schedule early May June July August September October Jordan Pond DO XXXXXX XXXXXX XXXXXX XXXXXX XXXXXX XXXXXX Temp/Secchi XXXXXX XXXXXX XXXXXX XXXXXX XXXXXX XXXXXX light profile XXXXXX XXXXXX XXXXXX XXXXXX XXXXXX XXXXXX eutroph. analytes XXXXXX XXXXXX acidif. analytes XXXXXX XXXXXX lake stage XXXXXX XXXXXX XXXXXX XXXXXX XXXXXX XXXXXX Bubble Pond DO XXXXXX Temp/Secchi XXXXXX XXXXXX XXXXXX light profile XXXXXX eutroph. analytes acidif. analytes XXXXXX XXXXXX lake stage XXXXXX XXXXXX XXXXXX XXXXXX XXXXXX XXXXXX Sargent Mt. Pond DO Temp/Secchi XXXXXX XXXXXX eutroph. analytes acidif. analytes XXXXXX XXXXXX The Bowl DO Temp/Secchi XXXXXX XXXXXX eutroph. analytes acidif. analytes XXXXXX XXXXXX Witch Hole Pond DO XXXXXX XXXXXX XXXXXX XXXXXX XXXXXX XXXXXX Temp/Secchi XXXXXX XXXXXX XXXXXX XXXXXX XXXXXX XXXXXX light profile XXXXXX XXXXXX XXXXXX XXXXXX XXXXXX XXXXXX eutroph. analytes XXXXXX XXXXXX acidif. analytes XXXXXX XXXXXX lake stage XXXXXX XXXXXX XXXXXX XXXXXX XXXXXX XXXXXX Upper Hadlock DO XXXXXX XXXXXX XXXXXX XXXXXX XXXXXX XXXXXX Temp/Secchi XXXXXX XXXXXX XXXXXX XXXXXX XXXXXX XXXXXX light profile XXXXXX XXXXXX XXXXXX XXXXXX XXXXXX XXXXXX eutroph. analytes XXXXXX XXXXXX acidif. analytes lake stage XXXXXX XXXXXX XXXXXX XXXXXX XXXXXX XXXXXX Seal Cove Pond DO XXXXXX XXXXXX XXXXXX XXXXXX XXXXXX XXXXXX Temp/Secchi XXXXXX XXXXXX XXXXXX XXXXXX XXXXXX XXXXXX light profile XXXXXX XXXXXX XXXXXX XXXXXX XXXXXX XXXXXX eutroph. analytes XXXXXX XXXXXX acidif. analytes lake stage XXXXXX XXXXXX XXXXXX XXXXXX XXXXXX XXXXXX Echo Lake DO XXXXXX XXXXXX XXXXXX XXXXXX XXXXXX XXXXXX Temp/Secchi XXXXXX XXXXXX XXXXXX XXXXXX XXXXXX XXXXXX light profile XXXXXX XXXXXX XXXXXX XXXXXX XXXXXX XXXXXX eutroph. analytes XXXXXX XXXXXX acidif. analytes lake stage XXXXXX XXXXXX XXXXXX XXXXXX XXXXXX XXXXXX Long Pond DO XXXXXX Temp/Secchi XXXXXX XXXXXX XXXXXX XXXXXX XXXXXX XXXXXX light profile XXXXXX eutroph. analytes acidif. analytes Eagle Lake DO XXXXXX Temp/Secchi XXXXXX XXXXXX XXXXXX XXXXXX XXXXXX XXXXXX light profile XXXXXX eutroph. analytes acidif. analytes lake stage XXXXXX XXXXXX XXXXXX XXXXXX XXXXXX XXXXXX
8 Specific methods used for field measurements, sample collection techniques, and QA/QC procedures are described in the Acadia National Park Lake Monitoring Field and Laboratory Methods (Gawley, 199). Secchi disk transparency, weather conditions; dissolved oxygen (DO), temperature, and light penetration profiles, and lake stage were measured in the field. A YSI 5 meter was used to measure DO and temperature, and LI-COR spherical PAR and deck cells measured light penetration. Light attenuation coefficients were calculated using methods developed for the NPS North Atlantic Coastal Parks (Kopp and Neckles, ). Lake stage was measured from a drilled hole ("tape down point") in a large rock in each pond using a wooden leveling stick and folding ruler. Laboratory analysis for acidification and eutrophication parameters was conducted by the Environmental Chemistry Lab at the University of Maine in from 199 to 3. Beginning in, samples were analyzed at the George Mitchell Center for Environmental and Watershed Research Laboratory at the University of Maine. Chemical analysis (summarized in Table ) and QA/QC procedures followed by the two EPA-certified University of Maine labs were similar in methods and protocol. Independent audits performed by Environment Canada in between the two UMO labs indicated data were consistent and not compromised for longterm analysis. The GMC continues to participate in both EPA and Environment Canada audits to ensure data quality. A recommendation of the 1997 workshop was for ANP staff to also perform analysis on closed cell ph, conductivity, ANC, and color at the park laboratory. Procedures for ANP chemistry and QC criteria are described in Gawley (199) and Seger (5). The workshop additionally recommended conducting an interlab comparison between the park lab and the University of Maine lab for these analytes. This comparison would provide an opportunity for park staff to evaluate the in-house capability to perform these standardized analyses. For data up to 1, casual comparisons suggested there was good agreement in most instances between the UMO and ANP labs, though a comprehensive statistical evaluation was not done. Monthly chemical analysis of these four analytes has continued at the ANP lab to maintain the dataset. In a more in-depth report (Seger, 5), preliminary interlab comparisons were again performed on to data using percent difference calculations. For consistency, and because agreement between the ANP lab and the EPAcertified UMO lab was not always within acceptable range, only UMO data are used for graphical analysis of chemical parameters in this report. Graphs and descriptive statistics were produced with Microsoft Excel 3 software. 7
9 Table. Analytical Methods for the University of Maine Laboratory. Analyte Method Reference ph, closed cell Electrode Hillman et al., EPA ph, aerated Electrode Hillman et al., EPA 5. 5 Specific conductance Wheatstone bridge EPA.1,EPA 3. 5 True color Spectrophotometer, 57.5 nm EPA 1. ANC Gran Titration Hillman et al., EPA 5. 5 Anions: Cl, NO 3, SO Ion chromatography EPA 3. 1 Pre 1999 analysis methods for Ca, Mg, Na, K, and Al Calcium AAS with N -acetylene flame EPA 15.1 Magnesium AAS with N -acetylene flame EPA.1 Sodium AAS with air-acetylene flame EPA 58.1 Potassium AAS with air-acetylene flame EPA 73.1 Aluminum (total) AAS with graphite furnace EPA to 3 methods for Ca, Mg, Na, K, and Al Calcium Inductively Coupled Atomic Emission Spectroscopy (ICP) EPA.15 Magnesium Inductively Coupled Atomic Emission Spectroscopy (ICP) EPA.15 Sodium Inductively Coupled Atomic Emission Spectroscopy (ICP) EPA.15 Potassium Inductively Coupled Atomic Emission Spectroscopy (ICP) EPA.15 Aluminum (total) Inductively Coupled Atomic Emission Spectroscopy (ICP) EPA.15 3 to present methods for Ca, Mg, Na, K, NH Calcium Ion Chromatography (IC) ASTM D Magnesium Ion Chromatography (IC) ASTM D Sodium Ion Chromatography (IC) ASTM D Potassium Ion Chromatography (IC) ASTM D Ammonium Ion Chromatography (IC) ASTM D to present methods for Al Aluminum (total) AAS with graphite furnace EPA.9 1 Dissolved Organic Carbon IR C analyzer, persulfate oxidation EPA
10 Table. (cont'd) Analytical Methods for the University of Maine Laboratory. Analyte Method Reference Ammonium (prior to 3) Autoanalyzer EPA 9. 5 and Bran & Luebbe 78-8T 7 Silica Autoanalyzer EPA. 5 and Bran & Luebbe 785-8T 7 Total P Persulfate Digestion/Ascorbic Method 5-P-B-5 3 Acid Method Method 5-P-E 3 AAS=atomic absorption spectrophotometry IR=Infrared Spectrophotometry CVAFS=cold vapor atomic fluorescence spectrometry Method references: 1. Methods for the Determination of Inorganic Substances in Environmental Samples, EPA /R-93-, Methods for Chemical Analysis of Water and Wastes, EPA /-79-, 1979, Revised Standard Methods for Examination of Water and Wastewater, th ed Methods for the Determination of Metals in Environmental Samples, EPA /-91/, 1991, Supplement 1, EPA /R-9/111, Handbook of Methods for Acid Deposition Studies: Laboratory Analysis For Surface Water Chemistry, EPA /-87-, Hillman,D.C., J. Potter, and S. Simon, 198. Analytical methods for the National Surface Water Survey, Eastern Lake Survey. EPA//-8/9, EPA Las Vegas. 7. Bran & Luebbe Manual 8. Mercury in Water by Oxidation, Purge and Trap, and Cold Vapor Atomic Fluorescence Spectrometry, EPA 81-R- 99-5, Methyl Mercury in Water by Distillation, Aqueous Ethylation, Purge and Trap, and Cold Vapor Atomic Fluorescence Spectrometry, EPA Draft, 1998 EPA.15, Determination of Metals and Trace Elements in Water by Ultrasonic Nebulization Inductively Coupled Plasma-Atomic Emission Spectrometry. Rev. 1., ASTM D Standard Test Method for Determination of Dissolved Alkali and Alkaline Earth Cations and Ammonium in Water and Wastewater by Ion Chromatography. Annual Book of ASTM Standards, Vol 11.1, 3. 9
11 RESULTS AND DISCUSSION General Data from the ANP and UMO labs from to 5 are included in tabular form in Appendix A. The lakes sampled in the ANP monitoring program have been selected to be representative of the broad range of hydrogeochemical and morphological conditions at the park. The core monitoring lakes range in size from 1 to 897 acres in surface area, and from 3 meters to 5 meters in depth. Although park lakes are poorly buffered, most are circumneutral in ph with trophic levels ranging from oligotrophic to eutrophic (most are mesotrophic), and acid neutralizing capacity (ANC) among the lowest in Maine. In general, the data indicate concentrations for most water quality parameters were within their historical range and continued to meet park water quality objectives. Precipitation Trends Statewide, 1 to was the worst drought period in over thirty years (Lombard, 3) and this is reflected in precipitation patterns at Acadia National Park as well. By late spring surface water levels returned to normal due to increased precipitation; however, groundwater levels statewide remained low throughout as there is a lag in response to climatic shifts in groundwater levels (Stewart et. al, 3). Mean precipitation measured at the McFarland Hill National Atmospheric Deposition Program (NADP) site at Acadia National Park headquarters for the period was 5.51 inches. Annual precipitation trends for this period are shown in Figure 1. For the Acadia area, to annual precipitation consecutively decreased over the three years from above normal conditions to a drier period (though was not nearly as dry as 1). In 5 annual precipitation reached the highest level since the NADP began monitoring at Acadia National Park (Figure ). Precipitation is one factor that has had relatively large seasonal fluctuations over the years. For example, above normal annual precipitation and temperature conditions occurred in, near normal in 3, then below normal in (though temperatures were average), then increasing again in 5. Seasonal changes however were different between the years. Winter temperatures, snow levels, spring rainfall, and annual precipitation were less in than the previous two years, but had a wetter/cooler summer and a drier fall than and 3 (Figure 3). In 5 precipitation was the highest it had been in over years, but most accumulation occurred in winter, spring, and fall. The 5 summer was similar in mean rainfall and temperatures to and 3. Mean summer (June-August) precipitation volumes were 3.15, 3.9,., and.1 inches in to 5 respectively. Again though, annual rainfall was below normal. Both seasonal and annual shifts in precipitation and temperatures can have distinctive short-term and cumulative effects on lake levels, physical lake properties, and water chemistry.
12 Figure. McFarland Hill Monthly Precipitation and Temperature to Precipitation (inches) Temperature (F) Mar- Jun- Sep- Dec- Mar-3 Jun-3 Sep-3 Dec-3 Mar- Jun- Sep- Dec- Mar-5 Jun-5 Sep-5 Dec-5 Precipitation Temperature Winter Summer Winter Summer Winter Summer Winter Summer Figure McFarland Hill Annual Precipitation Precipitation (inches) Year State of Maine NCDC thirty year normal precipitation mean (1971 to ) 1.7 inces. McFarland Hill site mean precipitation (1981 to 5) was 5.51 inches. 11
13 Lake Stage Monitoring Spring lake levels are influenced by snowmelt and spring rains. Summer and fall levels are influenced by precipitation and evapoconcentration. Additional factors that can affect lake levels are drinking water demand in water district lakes (Bubble, Eagle, Upper Hadlock, Jordan), use for fire control (the Tarn), and human and beaver damming activity. Some lakes are flashier in response to the timing, frequency, and duration of rainfall depending on their watershed influences and flushing rate. In general, lake levels reflected rainfall trends throughout the summer and into fall during to 5 (Appendix B). Upper Hadlock, The Tarn, and sometimes Bubble appeared to be more responsive to precipitation. Emergent vegetation at the Tarn and Aunt Betty ponds has continued to increase in recent years. Both of these ponds are naturally very shallow with summer water levels between 1 and meters, as well as have active beaver activity. These ponds appear to be slowly succeeding to freshwater wetlands as organic sediments accumulate on the pond bottom. Secchi Disk Transparency One long-term water quality measurement available for the core monitoring lakes at ANP is Secchi depth transparency. Mean, maximum, and minimum annual transparency and values for the core ponds (except Sargent Mountain Pond and The Bowl), can be seen in Table 5. Raw data of monthly readings are available on the University of Maine's Pearl website ( Mean annual transparency has remained remarkably stable in the core ponds despite a number of different monitors over the years. Some ponds appear to have experienced a slight increase in transparency since the mid-199 s, however this probably corresponds to a change in monitoring equipment. In 1995, the Secchi viewing scope was modified by adding two side flaps that shade the observer s eyes from peripheral light. These flaps help to reduce the glare seen by the observer looking through the scope and tend to increase the transparency reading. Graphs of annual mean Secchi transparency and Trophic State Index (TSI) data from 198s to present are included in Appendix C. The more oligotrophic lakes appear to have slightly more variation in annual Secchi readings and thus transparency conditions in these lakes may be more responsive to precipitation and other environmental influences. The general Secchi trend in most of the core lakes was a decrease in transparency since the drought of 1. This follows the pattern of increased summer precipitation from to. Often during drier conditions lakes will become more clear due to less runoff of nutrient and soil inputs. In 5 several lakes continued to have decreased secchi readings, due most likely to extremely high levels of spring and fall precipitation, and cumulative effects of a high rainfall year. 1
14 Table 5. Secchi Disk Readings Dissolved Oxygen Dissolved oxygen (DO) is the measure of the amount of oxygen occurring throughout the water column. Low oxygen rates can stress or directly kill organisms. Water with less than 1 mg/l of oxygen is considered anoxic and can promote the release of phosphorous from sediments and possibly increase algal blooms; less than 5 mg/l (hypoxia) is generally considered stressful to most coldwater fish. Temperature affects DO as well, in that increased water temperature leads to decreased oxygen solubility. Near the bottom of the water column, the more mesotrophic Seal Cove, Witch Hole, and Upper Hadlock ponds often reached below 5 mg/l or became anoxic during the months July through September. The more oligotrophic lakes sometimes reached below 1 mg/l, but only directly above the bottom sediment. Graphs of mean hypolimnion depth, dissolved oxygen, and temperature (Appendix D) suggest that these parameters are staying relatively constant over time. Although annual mean hypolimnion temperatures are somewhat variable due to normal fluctuations in climate, both mean hypolimnion depths and DO levels appear to be either stable or slightly increasing. This indicates that the majority of the water column in park lakes continues to be well oxygenated, since most hypoxia occurs in the hypolimnion and the relative proportion of hypolimnetic water remains fairly unchanged. Eutrophication Subset of Lakes In the lakes sampled for eutrophication indicators, annual and seasonal (June/August) values for total phosphorus, total nitrogen and chlorophyll a from 199 to 5 continued to be 13
15 relatively stable with concentrations generally within the historical range of variability for these lakes (see Appendix E.). Although tests for statistically significant trends were not conducted, general patterns were observed, with some anomalies. Often total phosphorous (TP) and total nitrogen (TN) were higher in the early summer compared to late. This is most likely due to spring runoff from snowmelt and rainfall. Chlorophyll a was higher in the late summer, as this is the prime growing time for phytoplankton and algae. TP concentrations from 199 to 5 in Witch Hole Pond were the highest of the five lakes, with a mean concentration of 9.9 ug/l. Mean total phosphorus concentration in the other eutrophication lakes ranged from.8 ug/l in Jordan Pond to.1 ug/l in Seal Cove Pond. Upper Hadlock had an unexplainably high TP concentration of 1 ug/l in June 1, but dropped to 3.9 ug/l in August, and then went back up to 11 ug/l the following June. Most likely this is due to spring rain runoff. In early summer 3, both TP and TN in Jordan were unusually high at.3 ug/l and.38 mg/l respectively. TN continued to be high in the late summer. In the levels were back to normal. TN ranged from a mean low of.13 mg/l in Bubble Pond to.377 mg/l in Witch Hole Pond from 199 to 5. Mean chlorophyll a concentrations ranged from a low of 1. ug/l in Jordan Pond to. ug/l in Witch Hole Pond from 199 to 5. Light Penetration Profiles Light penetration profiles were collected monthly for many of the eutrophication lakes from through, using a LI-COR submersible PAR cell and surface deck cell. The goal of this sampling was to obtain baseline data and to attempt to determine a relationship between Secchi transparency and the light meter readings. The light penetration data and corresponding Secchi depths were examined by USGS staff in 5 during the development of sampling protocols for NPS Vital Signs monitoring. Although the direct correlation between the Secchi depth and meter values was not as strong as anticipated, attenuation coefficients calculated from the profile data were shown to be a remarkably consistent index for seasonal comparison of lake transparency (Lombard, 5; pers.comm.). The profile information from deeper lakes may also be of value to compare with dissolved oxygen and temperature data, and to relate to productivity/food web studies. Secchi depth has long been considered a suitable and easily obtainable index for transparency, and the USGS comparison studies did not suggest there would be any advantage to augmenting (or replacing) Secchi transparency with LI-COR profiles in lakes that are deep enough to obtain Secchi readings. However, the greatest value of the LI-COR profiles is the ability to have an index of comparison (the attenuation coefficient) in shallower lakes. This data gap was noted in the Lake Monitoring Report (Breen, et.al, ), so the sampling strategy was modified in 5 to collect light profiles only in lakes too shallow for Secchi disk readings. Although each shallow lake was profiled once in 5, increasing sampling frequency in future years would provide a more statistically robust sample size. Light penetration profile data and graphs are found in Appendix F. Acidification Subset of Lakes Results for the five lakes sampled for acidification analytes indicate ph and acid neutralizing capacity (ANC) remained relatively stable both seasonally (spring/fall) and annually within each 1
16 lake from 199 to 5 (see Appendix G). From 1998 to 5 Sargent Mountain Pond was the most acidic lake with a mean air equilibrated ph of.91, and mean ANC of ueq/l. Jordan and Bubble Ponds were the most circumneutral lakes with mean ph values of.9, and mean ANC of 58.3 ueq/l and 5. ueq/l respectively. Spring ph and ANC tended to be somewhat lower than fall values in the Bowl, Jordan, Bubble, and Witch Hole Ponds, most likely due to spring melt episodic acidification. The reverse pattern was true for Sargent Mountain Pond, which is different in that it is a higher elevation headwater lake. However, in 5 more often fall ph and ANC values were lower in the lakes than in spring. This is most likely due to above average fall precipitation (1.9 inches in the ten days preceding the fall sampling dates). Interlab Comparison Detailed results and discussion of the interlab comparison can be found in Seger, 5. Overall results showed that apparent color analyzed at ANP is often less than true color values from the UMO lab. However, ANP values have been consistent since analysis began at ANP and are generally consistent within acceptable QC limits. ANC had the greatest discrepancy between the two labs. Conductivity differences between the two labs were generally less than %. Closed cell ph had the best agreement between the two labs. Again, these results were from a preliminary comparison. Percent difference limits followed were those used by the UMO lab for acceptable differences between field duplicate samples. Because differences are inevitable due to slightly varied analytical methods between the two labs, these percent difference limits may have been too strict. A stronger statistical comparison using peer-reviewed standards will be completed in the near future. CONCLUSIONS In summary of the results reported here using to 5 data (and 199 to 5 data for graphs presenting longer periods of record), recovery from the 1 drought occurred in, with the two subsequent years becoming consecutively drier on an annual basis, although summers received relatively average amounts of precipitation. 5 was an anomalous year with very high precipitation levels (totaling 8.3 inches), yet an average summer in temperature and rainfall. Secchi transparency and lake levels followed the precipitation trends of the seasons. Dissolved oxygen levels were within the expected ranges for the trophic type of each lake. In the eutrophication sampling subset of lakes, annual and seasonal (June/August) variation for total phosphorus, total nitrogen and chlorophyll a from 199 to 5 continued to be relatively stable with concentrations generally within the historical range of variability for these lakes. A notable exception is that TN appeared to be increasing over the years in Seal Cove Pond, though tests were not conducted to determine if this is a statistically significant trend. Results for the five acidification sampling subset of lakes indicate ph and acid neutralizing capacity (ANC) remained relatively stable both seasonally (spring/fall) and annually within each lake. Although the results of the to 5 lake monitoring were generally within their historical range, several samples with inexplicably elevated levels of TP and TN should be considered. 15
17 These nutrient spikes were initially attributed to episiodic loading due to heavy rainfall prior to sampling, but closer examination revealed that only one of the samples was preceded by more than." of rain in the 7 hours before sampling. It appears unlikely that rainfall was the cause of these transient high nutrient levels, and further investigation is suggested to try to establish the cause. Attempting to determine long-term trends for specific water quality parameters is complicated by a variety of factors. Although the ANP lakes database contains records dating back to 19, only the data collected using the current sampling and analytical protocols can be confidently used for trend analysis, and we are only now reaching the point of having a sufficient number of years of data to conduct such an analysis. Analytical methods for some analytes have changed in recent years from those used in earlier monitoring, making direct comparisons between different sets of data problematic. Analytical methods since the mid- 199s are much more uniform because the University of Maine laboratory has performed all of the analysis. In many instances, data from this period can be compared to data collected and analyzed by University of Maine researchers from the early 198s, through 1995 that used essentially the same methodology (Kahl, 199). However, data collected before 198 was often analyzed using different or unknown methods. Another factor making the analysis of trends difficult is the natural variation in annual and seasonal environmental/climatic conditions, especially in recent years. There has been great variation in seasonal and annual precipitation and temperature conditions in the past decade, as well as changes in atmospheric deposition patterns due to emission reductions as a result of amendments to the Clean Air Act in 199. Differences in various data sets can be observed but these relatively short-term differences may not represent long-term trends. The ANP lake monitoring program is designed to provide critical baseline data on the chemical status of ANP lakes and the temporal variability of individual constituents inherent within each water body. Because the monitored lakes reflect the broad range of lake types within ANP, these data also provide an indication of the relative status of unmonitored park lakes. Although there has not yet been a formal evaluation of the draft lake monitoring protocols, park staff and others who have informally reviewed the draft protocols believe they represent a reasonable and cost effective basis for a core long-term freshwater monitoring program. In addition to the current lake and invertebrate monitoring programs conducted by park staff, a number of research investigations are underway to more fully characterize freshwater and estuarine systems at ANP. Several USGS research projects are investigating water budgets and nutrient enhancement in major estuaries (Nielsen, ), identifying and characterizing key ecological indicators and developing long-term monitoring protocols for freshwater wetlands (Guntenspurgen and Neckles, in prog.), and characterizing groundwater recharge and contamination potential (Culbertson, in prog.). The University of Maine and the USGS collaborated in a comprehensive paired watershed study to assess chemical cycling and the potential ecological impacts of atmospheric deposition on forested ecosystems (Kahl, et al, 3). These additional water related research efforts are furnishing numerous datasets that can be integrated with other elements of the ANP long-term water monitoring program in the next few years. The Vital Signs Inventory and Monitoring Program currently being developed 1
18 within the National Park Service to identify key indicators of ecosystem health and a long-term monitoring program for parks will likely provide one opportunity for that integration. In preparation for this, a rigorous statistical analysis of the first years of lake monitoring data, including an assessment of earlier lake monitoring data sets, is needed to determine if the current monitoring strategy will provide the data necessary to determine long-term trends in key water monitoring parameters. The park hopes to receive a full evaluation of the current monitoring program in. RECOMMENDATIONS 1) Consider more thorough investigation of nutrient (TP, TN) concentrations and sources in eutrophication group of lakes. Examine the relationship between precipitation and nutrient levels to determine the relative contributions of direct deposition and runoff to lakes. ) Collect light profiles only in lakes too shallow for Secchi disk readings. Although each shallow lake was profiled once in 5, increasing sampling frequency in future years would provide a more statistically robust sample size. 3) Obtain a comprehensive statistical analysis of the first years of lake monitoring data collected using current protocols to determine if the current monitoring strategy will provide the data necessary to determine long-term trends in key water monitoring parameters. (Technical Assistance Request for this task was submitted to NPS Water Resources Division September 5) ) Obtain a formal evaluation of the draft lake monitoring protocols to determine if they represent a reasonable and cost effective basis for a core long-term freshwater monitoring program. (Technical Assistance Request for this task was submitted to NPS Water Resources Division September 5) 5) Continue to integrate lake monitoring data with information obtained from other aquatic monitoring and research conducted at ANP in order to better understand the current condition of the freshwater resources, as well as their responses to environmental variability and anthropogenic threats. 17
19 REFERENCES Breen, Robert, William Gawley, Michael Fraser, Heather Dumais.. Acadia National Park Lake Monitoring Report Acadia National Park Natural Resource Report -3. Culbertson, C.W. (Manuscript in preparation ) Assessing Ground Water Quality Degradation and its Impact on Estuaries in Acadia National Park, Maine. U.S. Geological Survey. Gawley, William G Acadia National Park Lake Monitoring: Field and Laboratory Methods. Acadia National Park Natural Resource Report 9-1. Gawley, William G., and Robert M. Breen Water Monitoring Program: Year End Report. Acadia National Park Natural Resource Report 9-. Gawley, William G. and Robert M. Breen Acadia National Park Lake Monitoring, 1997 Year-end Report. Acadia National Park Natural Resource Report 98-. Guntenspergen, G., and H. Neckles (Project in progress ). Development of a Wetland Monitoring Protocol for Acadia National Park. U.S. Geological Survey. Herlihy, A.T., D.H. Landers, R.F. Cusimano, W.S. Overton, P.J. Wigington, Jr., A.K. Pollack, and T.E. Mitchell-Hall Temporal Variability in Lakewater Chemistry in the Northeastern United States: Results of Phase II of the Eastern Lake Survey. EPA//3-91 /1. U.S. Environmental Protection Agency, Washington, D.C. Kahl, Jeffrey S Lake Chemistry at Acadia National Park, A report to: Acadia National Park. Water Research Institute, University of Maine, Orono, Maine. Kahl, Jeffrey S., Ivan Fernandez, Stephen Norton, G. Bruce Wiersma, George Jacobson, Sarah Nelson, Aria Amirbahman, Michael Bank, Janet Eckhoff, Jose Elvir, Heather Good, Terry Haines, Ken Johnson, Robert Lent, Cynthia Loftin, Martha Nielsen, Jennifer Parker, John Peckenham, Phillip Ruck, Molly Schauffler, John Stoddard, Robert Breen, Bill Gawley, David Manski, Charles Roman, Lindsey Rustad, Kathy Tonnessen, Kathleen Weathers, Christopher Cronan, Alan White. 3. Final integrated report: Establishing paired gauged watersheds at Acadia National Park for long-term research on acidic deposition, nitrogen saturation, forest health, and mercury biogeochemistry (1998-) University of Maine, Orono, Maine Kahl, Steve, and David Manski Developing Long-term Monitoring Protocols for Freshwater Resources at Acadia National Park. Interim Report from a workshop, January 9-,
20 Kopp, B.S. and Neckles, H.A.,, Monitoring protocols for the National Park Service North Atlantic Coastal Parks: Ecosystem Indicators of Estuarine Eutrophication, draft: USGS Patuxent Wildlife Research Center Lombard, P. J. 3. Drought Conditions in Maine, 1999-: A Historical Perspective, WRIR3-3. Augusta: U.S. Geological Survey. Mitchell-Hall, T.E., A.C. Neale, S.G. Paulsen, and J.E. Pollard Eastern Lake Survey- Phase II: Quality Assurance Report. EPA// U.S. Environmental Protection Agency, Las Vegas, Nevada. National Atmospheric Deposition Program (NADP/NTN). 1. Annual Data Summary, Precipitation Chemistry in the United States. Colorado State University Natural Resource Ecology laboratory, Fort Collins, CO. National Park Service.. Water Resources Management Plan. Acadia National Park, Bar Harbor Maine. Nielsen, M.G.. Water budget for and nitrogen loads to Northeast Creek, Bar Harbor, Maine. Water-Resources Investigations Report -. U.S. Geological Survey, Peck, D.V., M. Morrison, W. Mader, and D.J. Chaloud. June, Environmental Monitoring and Assessment Program: Integrated quality assurance project plan for the surface waters resource group. EPA /X-91/8. Seger, Emily M. 5. Preliminary Evaluation of In-House ANP Lake Monitoring Chemical Analysis. Acadia National Park Natural Resource Report 5-. Stewart, G.J., J.M. Caldwell, and A.R. Cloutier. 3. Water Resources Data Maine Water Year. WDR-ME--1. Augusta: U.S. Geological Survey. 19
21 National Park Service U.S. Department of the Interior `APPENDIX A Water Chemistry Data -5
22 Description Start Date Sample Depth (m) Lab Code QC Closed Cell ph eqph Color (PCU) Conductivity BEAR BROOK POND 8/5/5 G. ANP REG BUBBLE POND /1/5 G. ANP REG BUBBLE POND /1/5 G. ANP REP BUBBLE POND /1/5 G. GMC REG BUBBLE POND 5/18/5 G. ANP REG BUBBLE POND 5/18/5 G. ANP REP BUBBLE POND //5 G. ANP REG BUBBLE POND 7/1/5 C.5 ANP REG BUBBLE POND 8/19/5 G. ANP REG BUBBLE POND 9//5 G. ANP REG BUBBLE POND 9//5 G. ANP REG BUBBLE POND 9//5 G. ANP DUP BUBBLE POND 9//5 G. ANP DUP BUBBLE POND /18/5 G. ANP REG.8.31 BUBBLE POND /18/5 G. GMC REG DUCK POND 8//5 G. ANP REG DUCK POND 8//5 G. ANP REP EAGLE LAKE 5/1/5 G. ANP REG EAGLE LAKE 5/1/5 G. ANP DUP EAGLE LAKE /7/5 G. ANP REG EAGLE LAKE /7/5 G. ANP REP EAGLE LAKE 7/19/5 G. ANP REG EAGLE LAKE 8/3/5 G. ANP REG EAGLE LAKE 8/3/5 G. ANP REG EAGLE LAKE 9/7/5 G. ANP REG EAGLE LAKE /31/5 G. ANP REG ECHO LAKE 5/19/5 G. anp REG ECHO LAKE /1/5 C 3 ANP REG ECHO LAKE /1/5 C 3 GMC REG ECHO LAKE 7/13/5 C ANP REG ECHO LAKE 8/18/5 C 8 ANP REG ECHO LAKE 8/18/5 C 8 GMC REG ECHO LAKE 9/1/5 G. ANP REG ECHO LAKE /31/5 G. ANP REG ANC Chlorophyll a TP TN DOC DIC Ca Appendix A: Lake Chemistry -5 1
23 Description Start Date Sample Depth (m) Lab Code QC Closed Cell ph eqph Color (PCU) Conductivity FAWN POND 8//5 G.5 ANP REG FAWN POND 8//5 G.5 ANP REP HALFMOON POND 8//5 G. ANP REG HODGDON POND 8//5 G. ANP REG JORDAN POND /1/5 G. ANP REG JORDAN POND /1/5 G. GMC REG JORDAN POND 5/18/5 G. ANP REG JORDAN POND /13/5 C ANP REG JORDAN POND /13/5 C GMC REG JORDAN POND 7//5 C ANP REG JORDAN POND 8/1/5 C 8 ANP REG JORDAN POND 8/1/5 C 8 GMC REG JORDAN POND 9/19/5 G. ANP REG JORDAN POND /18/5 G. ANP REG JORDAN POND /18/5 G. GMC REG LAKE WOOD 9//5 G. ANP REG LAKE WOOD 9//5 G. ANP REP LONG POND (MDI) 5/19/5 G. ANP REG LONG POND (MDI) /1/5 G. ANP REG LONG POND (MDI) 7/13/5 G. ANP REG LONG POND (MDI) 8//5 G. ANP REG LONG POND (MDI) 9/3/5 C. ANP REG LONG POND (MDI) /31/5 G.5 ANP REG LOWER BREAKNECK 8//5 G. ANP REG LOWER HADLOCK 8/19/5 G. ANP REG MILL FIELD RESERVOIR 8//5 G. ANP REG ROUND POND 7/7/5 G. ANP REG SARGENT MTN POND 5//5 G 1 ANP REG SARGENT MTN POND 5//5 G. GMC REG SARGENT MTN POND 9//5 G.5 ANP REG SARGENT MTN POND /19/5 G. GMC REG SEAL COVE POND //5 C 5 ANP REG SEAL COVE POND //5 C 5 ANP DUP SEAL COVE POND //5 C 5 GMC REG ANC Chlorophyll a TP TN DOC DIC Ca Appendix A: Lake Chemistry -5
24 Description Start Date Sample Depth (m) Lab Code QC Closed Cell ph eqph Color (PCU) Conductivity SEAL COVE POND 7//5 C 3 ANP REG SEAL COVE POND 8/17/5 C ANP REG SEAL COVE POND 8/17/5 C GMC REG SEAL COVE POND 9/8/5 G. ANP REG SEAL COVE POND /31/5 G.5 ANP REG THE BOWL //5 G 1 ANP REG THE BOWL //5 G. GMC REG THE BOWL 8//5 G.5 ANP REG THE BOWL /18/5 G. ANP REG.7.9 THE BOWL /18/5 G. GMC REG THE TARN 8/5/5 G. ANP REG THE TARN 8/5/5 G. ANP DUP UPPER BREAKNECK 8//5 G. ANP REG UPPER HADLOCK 5/17/5 G.5 ANP REG UPPER HADLOCK /13/5 G. ANP REG UPPER HADLOCK /13/5 G. GMC REG UPPER HADLOCK 7/11/5 C ANP REG UPPER HADLOCK 8/15/5 C ANP REG UPPER HADLOCK 8/15/5 C GMC REG UPPER HADLOCK 9/19/5 G. ANP REG UPPER HADLOCK /31/5 G. ANP REG WITCH HOLE POND //5 G 1 ANP REG WITCH HOLE POND //5 G. GMC REG WITCH HOLE POND 5/17/5 G.5 ANP REG WITCH HOLE POND //5 C 3 ANP REG WITCH HOLE POND //5 C 3 GMC REG WITCH HOLE POND 7/13/5 C ANP REG WITCH HOLE POND 7/13/5 C ANP DUP WITCH HOLE POND 8/18/5 C 3 ANP REG WITCH HOLE POND 8/18/5 C 3 ANP DUP WITCH HOLE POND 8/18/5 C 3 GMC REG WITCH HOLE POND 9/1/5 G. ANP REG WITCH HOLE POND /19/5 G. GMC REG WITCH HOLE POND /19/5 G. GMC REG ANC Chlorophyll a TP TN DOC DIC Ca Appendix A: Lake Chemistry -5 3
25 Description Start Date Sample Depth (m) Lab Code QC Closed Cell ph eqph Color (PCU) Conductivity ANC Chlorophyll a TP TN DOC DIC Ca AUNT BETTYS 7// G. ANP BEAR BROOK POND 7/1/ G. ANP BEAR BROOK POND 7/1/ G. ANP DUP BEAR BROOK POND 7/1/ G. ANP REP BUBBLE POND 5/5/ G. GMC BUBBLE POND 7// C 3 ANP BUBBLE POND 8/5/ G. ANP DUP BUBBLE POND 8/5/ G. ANP BUBBLE POND 8/7/ G. ANP BUBBLE POND 9/7/ G. ANP BUBBLE POND 9/7/ G. ANP DUP BUBBLE POND // G. ANP BUBBLE POND // G. GMC DUCK POND 8/5/ G. ANP EAGLE LAKE 5// G. ANP EAGLE LAKE /1/ G. ANP EAGLE LAKE 7// G. ANP DUP EAGLE LAKE 7// G. ANP EAGLE LAKE 9/1/ G. ANP EAGLE LAKE 9/7/ G. ANP ECHO LAKE /1/ C GMC ECHO LAKE /1/ C ANP ECHO LAKE 7// G ANP ECHO LAKE 8/5/ C 9 ANP ECHO LAKE 8/5/ C 9 GMC ECHO LAKE 9/1/ C ANP FAWN POND 8// G.8 ANP HALFMOON POND 7/1/ G. ANP HODGDON POND 8// G. ANP JORDAN POND 5/5/ G. GMC JORDAN POND /17/ C 7 ANP JORDAN POND /17/ C 7 GMC Appendix A: Lake Chemistry -5
26 Description Start Date Sample Depth (m) Lab Code QC Closed Cell ph eqph Color (PCU) Conductivity JORDAN POND 7/7/ C ANP JORDAN POND 8/9/ C GMC JORDAN POND 8/9/ C ANP JORDAN POND 9// C ANP JORDAN POND // G. ANP JORDAN POND // G. GMC JORDAN POND // G. ANP REP LAKE WOOD 8// G. ANP LONG POND (MDI) /3/ G. ANP LONG POND (MDI) 7/9/ G. ANP LONG POND (MDI) 8// G. ANP LONG POND (MDI) 8// G. ANP DUP LONG POND (MDI) 9// G. ANP LOWER BREAKNECK 7/1/ G. ANP LOWER BREAKNECK 7/1/ G. ANP REP LOWER HADLOCK 8// G. ANP MILL FIELD RESERVOIR 7/19/ G.8 ANP SARGENT MTN POND 5// G. ANP SARGENT MTN POND 5// G. GMC SARGENT MTN POND 8/1/ G.75 ANP SARGENT MTN POND // G. GMC SARGENT MTN POND // G. ANP SEAL COVE POND /3/ C ANP SEAL COVE POND /3/ C GMC SEAL COVE POND 7/9/ C ANP SEAL COVE POND 8/5/ C 9 GMC SEAL COVE POND 8/5/ C 9 ANP SEAL COVE POND 9/1/ C ANP THE BOWL /1/ G. ANP THE BOWL /1/ G. GMC THE BOWL 8/3/ G.75 ANP THE BOWL /19/ G. GMC THE BOWL /19/ G. ANP THE TARN 7/1/ G.5 ANP ANC Chlorophyll a TP TN DOC DIC Ca Appendix A: Lake Chemistry -5 5
Lake & Watershed Resource Management Associates P O Box 65; Turner, ME
 Lake & Watershed Resource Management Associates P O Box 65; Turner, ME 207-336-2980 LWRMA @megalink.net 2009 Baseline Water Quality Monitoring and Assessment of McCurdy Pond At the request of the Pemaquid
2016 Summit Lake Water Quality Report Prepared by Thurston County Environmental Health Division
 ! 216 Summit Lake Water Quality Report Prepared by Thurston County Environmental Health Division PART OF TOTTEN INLET WATERSHED LENGTH OF LAKE: 2.2 miles SHORELINE LENGTH: 5.6 miles LAKE SIZE: 53 acres
Lake & Watershed Resource Management Associates P O Box 65; Turner, ME
 Lake & Watershed Resource Management Associates P O Box 65; Turner, ME 207-336-2980 LWRMA@megalink.net 2008 Baseline Water Quality Monitoring and Assessment of Pemaquid and Biscay Ponds At the request
Water Quality Analysis of Lakewood Lakes
 Water Quality Analysis of Lakewood Lakes December 2016 Prepared by WEST Consultants, Inc. Bellevue, Washington With support from HDR, Inc., Olympia, Washington TABLE OF CONTENTS EXECUTIVE SUMMARY... V
Hadlock Pond, Washington Co., Lake Hadlock Association, Inc.
 Hadlock Pond, Washington Co., Lake Hadlock Association, Inc. Lake Characteristics Watershed Characteristics Surface Area (ac/ha) Max Depth (ft/m) Mean Depth (ft/m) Retention Time (years) Water Class Dam
After reviewing data collected from ISLAND POND, STODDARD, the program coordinators have made the following observations and recommendations.
 OBSERVATIONS & RECOMMENDATIONS After reviewing data collected from ISLAND POND, STODDARD, the program coordinators have made the following observations and recommendations. Thank you for your continued
Portage Lake CASS COUNTY
 Portage Lake 11-0204-00 CASS COUNTY Summary Portage Lake is located near Bena, MN in Cass County. It covers 1,539 acres, which places it in the upper 10% of lakes in Minnesota in terms of size. Portage
Lake Elsinore and San Jacinto Watersheds Authority. Canyon Lake Phase 2 Water Quality Monitoring Plan
 Lake Elsinore and San Jacinto Watersheds Authority December 2010 Background Canyon Lake was formed in 1928 when the Canyon Lake (Railroad Canyon) Dam was constructed; the lake has three main sections the
Long-Term Volunteer Lake Monitoring in the Upper Woonasquatucket Watershed
 Long-Term Volunteer Lake Monitoring in the Upper Woonasquatucket Watershed Linda Green URI Watershed Watch 1-87-95, lgreen@uri.edu WATER QUALITY IS A REFLECTION OF THE ACTIVITIES IN THE LANDS AND WATERS
Pebble Lake - Water Quality Report
 Emerald Lakes Village, Oakland County January 8 th, 218 Pebble Lake - Water Quality Report The goal of this testing protocol was to monitor various water quality parameters of the lake, compare results
Continuous records for the Chariton River indicate that 2004 was an average water year, with total flow approximately equal to the average annual
 2004 Rathbun Report Iowa State University Limnology Laboratory John A. Downing, Ph.D. George Antoniou, Assistant Scientist For Rathbun Land and Water Alliance August 31, 2005 A. Tributaries Personnel of
Lake Washington. Water Quality Assessment Report. Copyright 2012 PLM Lake & Land Management Corp.
 Lake Washington 2012 Water Quality Assessment Report Copyright 2012 PLM Lake & Land Management Corp. Water Quality Report On May 22nd, June 18th, July 30th, August 29th, and September 27 th, 2012, PLM
Interpreting Lake Data
 Interpreting Lake Data Indiana Clean Lakes Program The Indiana Clean Lakes Program was created in 1989 as a program within the Indiana Department of Environmental Management's (IDEM) Office of Water Management.
Boy Lake CASS COUNTY
 Boy Lake 11-143- CASS COUNTY Summary Boy Lake is located near Remer, MN in Cass County. It covers 3,452 acres, which places it in the upper 1% of lakes in Minnesota in terms of size. Boy Lake has two main
2015 Range Ponds Water Quality Report
 2015 Range Ponds Water Quality Report Prepared by Scott Williams, Aquatic Biologist Lake & Watershed Resource Management Associates PO Box 65; Turner, ME 04282 207-576-7839 The Range Ponds Environmental
CLMP+ Report on Grass Lake (Anoka County) Lake ID# CLMP+ Data Summary
 Lake ID# CLMP+ Data Summary") CLMP+ Report on Grass Lake (Anoka County) Lake ID# 02-0113-00 2012-2013 CLMP+ Data Summary October 2014 Authors Shannon Martin, MPCA Editing and graphic design Public Information Office Staff The (MPCA)
CLMP+ Report on Grass Lake (Anoka County) Lake ID# 02-0113-00 2012-2013 CLMP+ Data Summary October 2014 Authors Shannon Martin, MPCA Editing and graphic design Public Information Office Staff The (MPCA)
Results from the 2017 Water Quality Monitoring Program
 Results from the 217 Water Quality Monitoring Program As part of a larger project, this summer the BWC conducted water sampling throughout the Belleisle Bay to get a baseline of data and determine the
2012 Range Ponds Water Quality Report
 2012 Range Ponds Water Quality Report Prepared by Scott Williams, Aquatic Biologist Lake & Watershed Resource Management Associates The Range Ponds Environmental Association continued to monitor the health
Interpreting Lake Data
 Interpreting Lake Data Indiana Clean Lakes Program The Indiana Clean Lakes Program was created in 1989 as a program within the Indiana Department of Environmental Management's (IDEM) Office of Water Management.
Gull Lake CASS & CROW WING COUNTIES
 Gull Lake 11-0305-00 CASS & CROW WING COUNTIES Summary Gull Lake is located just northwest of Brainerd, Minnesota, on the border of Cass and Crow Wing Counties. It covers 9,947 acres, which places it in
Laurel Lake water quality, nutrients, and algae, summer
 Laurel Lake water quality, nutrients, and algae, summer 2011 1 H.A. Waterfield, W.N. Harman and M.F. Albright SAMPLING ACTIVITIES Site visits to Laurel Lake were made on 16 June and 25 July 2011; water
White Lake 2017 Water Quality Report
 Introduction Watersheds Canada believes that every person has the right to access clean and healthy lakes and rivers in Canada. We work to keep these precious places naturally clean and healthy for people
2017 Water Quality Report and Historical Analysis. Long Lake Mickey Lake Ruth Lake. Monitoring Years
 2017 Water Quality Report and Historical Analysis Long Lake Mickey Lake Ruth Lake Monitoring Years 1993-2017 Submitted to: Long Lake Association October 2017 Prepared by: Great Lakes Environmental Center
Report on the Health of Thompson Lake 2015
 lake & watershed Resource management associates PO Box 65 Turner ME 04282 207-336-2980 lwrma@megalink.net Report on the Health of Thompson Lake 2015 This report is a summary and analysis of findings of
2011 Acid Deposition Summary
 2011 Acid Deposition Summary New Jersey Department of Environmental Protection NATURE AND SOURCES Atmospheric deposition is a process in which pollutants are deposited on land or water from the air. Deposition
U.S. Geological Survey s Update on the Water Quality of Delavan Lake
 Memo to: Town of Delavan Lake Committee Date: February 2, 2013 From: Ryan Simons, Town of Delavan Lake Committee Chairman Subject: U.S. Geological Survey s Update on the Water Quality of Delavan Lake On
Lake Whatcom Water Quality - Presentation to Bellingham City Council
 Western Washington University Western CEDAR Lake Whatcom Other Reports Lake Whatcom 7-6-2015 Lake Whatcom Water Quality - Presentation to Bellingham City Council Robin A. Matthews Western Washington University,
CLMP+ Report on Fleming Lake (Aitkin County)
") CLMP+ Report on Fleming Lake (Aitkin County) Lake ID# -5-5-6 CLMP+ Data Summary July 7 Authors Shannon Martin Contributors/acknowledgements Terry Dahlberg Sandy Dahlberg Pam Anderson For questions regarding
CLMP+ Report on Fleming Lake (Aitkin County) Lake ID# -5-5-6 CLMP+ Data Summary July 7 Authors Shannon Martin Contributors/acknowledgements Terry Dahlberg Sandy Dahlberg Pam Anderson For questions regarding
Hydrology and Water Quality. Water. Water 9/13/2016. Molecular Water a great solvent. Molecular Water
 Hydrology and Water Quality Water Molecular Water Exists as an equilibrium But equilibrium altered by what is dissolved in it Water Molecular Water a great solvent In reality, water in the environment
Michael Jakubowski University of Maine Graduate Student
 Multidecadal Response in Soil Carbon, Nitrogen, and Mercury to the Mt. Desert Island Fire of 1947 Using Paired Watersheds in Acadia National Park, Maine Michael Jakubowski University of Maine Graduate
What s Happening in Lake Whatcom?
 What s Happening in Lake Whatcom? Dr. Robin A. Matthews, Director Institute for Watershed Studies Huxley College of the Environment Western Washington University June 6, 2011 Site 2 Basin 2 Lake Whatcom
Ploof s Creek South. Johannes Creek. Grand Lake, Ploof s Creek South, Johannes Creek. Introduction
 524 4th Street South Sauk Centre, MN 56378 320.352.2231 Grand Lake, Ploof s Creek South, Johannes Creek Introduction Since the 2012 monitoring season, the Grand Lake Improvement District (Grand LID) and
Smithville Lake 2000 Water Quality Report
 Smithville Lake 2 Water Quality Report 1. General. a. Project location. The dam is located at river mile 12.9 on the Little Platte River, a tributary of the Platte River. The drainage area above the dam
Mr. Leach Science Burrillville High School
 Mr. Leach Science Burrillville High School The Clear River subwatershed, is located in northwestern Rhode Island. This subwatershed is a component of the Lower Blackstone River Watershed, the Blackstone
HORSESHOE LAKE WATER QUALITY IMPROVEMENT PROJECT FINAL REPORT
 KITSAP COUNTY HEALTH DISTRICT ENVIRONMENTAL HEALTH DIVISION POLLUTION IDENTIFICATION AND CORRECTION PROGRAM HORSESHOE LAKE WATER QUALITY IMPROVEMENT PROJECT FINAL REPORT By Kimberly Jones Environmental
Hydrology and Water Quality. Water. Water 9/11/2018. Molecular Water a great solvent. Molecular Water
 Hydrology and Water Quality Water Molecular Water Exists as an equilibrium But equilibrium altered by what is dissolved in it Water Molecular Water a great solvent In reality, water in the environment
2018 WATER QUALITY MONITORING BLUE MARSH RESERVOIR LEESPORT, PENNSYLVANIA
 2018 WATER QUALITY MONITORING BLUE MARSH RESERVOIR LEESPORT, PENNSYLVANIA U.S. Army Corps of Engineers Philadelphia District Environmental Resources Branch January 2019 2018 Water Quality Monitoring Blue
By: Martin E. Lebo Charles R. Goldman. Ecological Research Associates. Davis, California Submitted to:
 Evaluating the Impact of Truckee River Operating Agreement (TROA) Alternatives on Pyramid Lake Algal Production and Hypolimnetic Oxygen: Final Alternatives By: Martin E. Lebo Charles R. Goldman Ecological
2016 WATER QUALITY MONITORING BELTZVILLE RESERVOIR LEHIGHTON, PENNSYLVANIA
 2016 WATER QUALITY MONITORING BELTZVILLE RESERVOIR LEHIGHTON, PENNSYLVANIA U.S. Army Corps of Engineers Philadelphia District Environmental Resources Branch December 2016 2016 Water Quality Monitoring
Okanagan Large Lakes Water Quality Monitoring Program Ellison Lake Wood Lake Kalamalka Lake Okanagan Lake Skaha Lake Osoyoos Lake
 Okanagan Large Lakes Water Quality Monitoring Program Ellison Lake Wood Lake Kalamalka Lake Okanagan Lake Skaha Lake Osoyoos Lake 1 Table of Contents Goals & Objectives... Trophic Status... Data Collection...
2016 WATER QUALITY MONITORING PROMPTON RESERVOIR PROMPTON, PENNSYLVANIA
 2016 WATER QUALITY MONITORING PROMPTON RESERVOIR PROMPTON, PENNSYLVANIA U.S. Army Corps of Engineers Philadelphia District Environmental Resources Branch December 2016 2016 Water Quality Monitoring Prompton
The Lake Partner Program
 The Lake Partner Program Anna DeSellas Scientist, Inland Lakes Monitoring & Lake Partner Program Coordinator Dorset Environmental Science Centre 1 Phosphorus and water quality Phosphorus: A nutrient that
Monitoring Update April 1, Northeast Aquatic Research George Knoecklein Hillary Kenyon Sabina Perkins
 Monitoring Update April 1, 215 Northeast Aquatic Research George Knoecklein Hillary Kenyon Sabina Perkins Lake Monitoring Approach for 214 Tonight's discussion will focus on in-lake aspects: Assessment
Water Quality Monitoring Stations
 Water Quality Monitoring Stations Eastern Basin Race Narrows Western Basin Central Basin The CT Department of Environmental Protection (CT DEP) conducts a water quality CT DEP monitoring program for the
2007 Inland and Purdy Reservoirs Report. Rivers and Reservoirs Monitoring Program
 2007 Inland and Purdy Reservoirs Report Rivers and Reservoirs Monitoring Program Field Operations Division Environmental Indicators Section Aquatic Assessment Unit June 2012 Rivers and Reservoirs Monitoring
National Atmospheric Deposition Program
 National Atmospheric Deposition Program Annual Summary Sulfate Sulfate Nitrate Nitrate Ammonium Ammonium - - Estimated Annual Deposition (millimoles/meter ) What Is NADP? In, scientists, students, educators,
LCI Lake Water Quality Summary
 LCI Lake Water Quality Summary General Information Lake Name: Location: Basin: Size: Lake Origins: Major Tributaries: Lake Tributary to?: Water Quality Classification: Shandelee Lake Town of Callicoon,
How may climate change affect shallow inland lakes of New York State? A simple question with a complex answer
 How may climate change affect shallow inland lakes of New York State? A simple question with a complex answer Bruce Gilman, Professor and Director Muller Field Station Finger Lakes Community College 3325
Monitoring the Effects of Acid Rain on Freshwater Metal Chemistry. Tyler Ueltschi University of Puget Sound Tacoma, WA
 Monitoring the Effects of Acid Rain on Freshwater Metal Chemistry Tyler Ueltschi University of Puget Sound Tacoma, WA Advisor: Anne Giblin Marine Biological Laboratory 7 MBL Street, Woods Hole, MA 2543
Otter Lake Otter Lake Association Town of Forestport Oneida County
 Otter Lake Otter Lake Association Town of Forestport Oneida County Lake Characteristics Watershed Characteristics Surface area (ac/ha) 282 / 114 Max depth (ft/m) / 3 Mean depth (ft/m) 5 / 1 Retention time
Phosphorus Goal Setting Process Questions and Answers 2010
 Lake Winnipesaukee Watershed Management Plan Phase I: Meredith, Paugus, Saunders Bays 1. What is phosphorus? Phosphorus (P) is a naturally occurring element and a major nutrient required for biological
Water Monitoring in Spa Creek: A Summary
 Water Monitoring in Spa Creek: A Summary Written by: Alexis Jones & Blake Harden Edited by: Hannah Krauss Water monitoring is very important in order to determine the health of the Chesapeake Bay and its
Sediment Trapping and Inflow/Outflow Phosphorus Turnover
 Sediment Trapping and Inflow/Outflow Phosphorus Turnover By: Dan Carey Field Research If you have ever been swimming in Lake Eau Claire you know exactly what everyone else on the lake is also thinking,
Acidity and Alkalinity:
 Evaluation of Pollution Sources to Lake Glenville Quarterly Report December 2018 Kimberlee K Hall, PhD Environmental Health Program, Western Carolina University Summary Chemical and microbial analysis
Water Quality Study In the Streams of Flint Creek and Flint River Watersheds For TMDL Development
 Water Quality Study In the Streams of Flint Creek and Flint River Watersheds For TMDL Development Idris Abdi Doctoral Dissertation Presentation Major Advisor: Dr. Teferi Tsegaye April 18, 2005 Alabama
Spanaway Lake Management Plan
 Spanaway Lake Management Plan Background Spanaway Lake is a valuable Pierce County resource. The lake is threatened by a variety of water quality problems including excess algae and weed growth and elevated
Watershed and Water Quality Modeling to Support TMDL Determinations Lake Oologah
 Watershed and Water Quality Modeling to Support TMDL Determinations Lake Oologah 26 th Annual Conference Oklahoma Clean Lakes and Watersheds Association (OCLWA) April 5-6, 2017 Stillwater, Oklahoma Lake
URI Watershed Watch Program. Block Island Monitoring Results May 2007 Elizabeth Herron and Linda Green, URI Watershed Watch
 URI Watershed Watch Program Block Island Monitoring Results 1-6 May 7 Elizabeth Herron and Linda Green, URI Watershed Watch Summary: To date both the field monitoring and laboratory analyses indicate that
Climate Change Effects on Maine Lakes
 Climate Change Effects on Maine Lakes Linda Bacon Aquatic Biologist II Lakes Assessment Section Maine Volunteer Lake Monitoring Program Annual Meeting July 21, 2012 Protecting Maine s Air, Land and Water
Leesville Lake Water Quality Monitoring
 Leesville Lake Water Quality Monitoring Prepared for: Leesville Lake Association Prepared by: Dr. Thomas Shahady Lynchburg College Funds Supplied by: American Electric Power & Leesville Lake Association
Water Quality Sampling Presentation Ministry of the Environment. Presented by Dana Cruikshank Surface Water Specialist October 2009
 Water Quality Sampling Presentation Ministry of the Environment Presented by Dana Cruikshank Surface Water Specialist October 2009 1 5W s of Water Quality Sampling WHY WHAT WHERE WHEN WHO Sampling is an
A December 18, 2007 article (printed below) from South Dakota State University on the Plant Management Network web site addresses this issue.
 from South Dakota State University on the Plant Management Network web site addresses this issue.") Number 122 January 18, 2008 1. Surface applications of nitrogen on snow-covered fields of wheat 1 2. Chloride as a fertilizer nutrient for wheat 2 3. Reducing phosphorus movement into surface water: Eutrophication
Number 122 January 18, 2008 1. Surface applications of nitrogen on snow-covered fields of wheat 1 2. Chloride as a fertilizer nutrient for wheat 2 3. Reducing phosphorus movement into surface water: Eutrophication
Lime Lake Lime Lake District Town of Cuba Cattaraugus County
 Lime Lake Lime Lake District Town of Cuba Cattaraugus County Lake Characteristics Watershed Characteristics Surface area (ac/ha) 14 / 2 Max depth (ft/m) 3 / 11 Mean depth (ft/m) 18 / Retention time (years)
2018 Sebago Lake Assessment
 2018 Sebago Lake Assessment Portland Water District Sebago Lake Watershed Monitoring Programs Lake Monitoring Presenting data from 1976 to 2018 Nathan Whalen Introduction Sebago Lake is the primary drinking
Cultural accelerated by anthropogenic activities
 EUTROPHICATION IMPLICATIONS OF N & P Intent of this lecture? Link our discussions of terrestrial N & P dynamics with its influences on receiving water bodies How the relative amounts of N & P can influence
July 2009 WATER QUALITY SAMPLING, ANALYSIS AND ANNUAL LOAD DETERMINATIONS FOR NUTRIENTS AND SOLIDS ON
 July 2009 WATER QUALITY SAMPLING, ANALYSIS AND ANNUAL LOAD DETERMINATIONS FOR NUTRIENTS AND SOLIDS ON THE BALLARD CREEK, 2008 LESLIE B. MASSEY, WADE CASH, AND BRIAN E. HAGGARD Submitted to Arkansas Natural
Pebble Project Surface Water Quality Program Streams, Seeps, and Ponds
 Day1_1445_Surface Water Quality_PLP_McCay.mp3 Pebble Project Surface Water Quality Program Streams, Seeps, and Ponds Mark Stelljes SLR International February 1, 2012 Outline Stream Program Overview Results
LAKE AUBURN: THE EFFECT OF CLIMATE DRIVERS ON LAKE WATER QUALITY
 LAKE AUBURN: THE EFFECT OF CLIMATE DRIVERS ON LAKE WATER QUALITY Bernadette Kolb, Zachary Eichenwald and Daniel Bisson, CDM Smith John Storer, Auburn Water District* David Jones, Lewiston Water Division
CHERRY CREEK RESERVOIR DESTRATIFICATION SYSTEM
 CHERRY CREEK RESERVOIR DESTRATIFICATION SYSTEM Memorandum William P. Ruzzo, PE, LLC 6641 West Hamilton Drive, Lakewood, Colorado 80227 (303) 985-1091 (303) 989-6561 fax bill.ruzzo@comcast.net To: Chuck
City of River Falls North Kinnickinnic River Monitoring Project Summary. Report prepared by SEH Inc., for the
 City of River Falls North Kinnickinnic River Monitoring Project 2012 Summary Report prepared by SEH Inc., for the City of River Falls Engineering Department December 2012 Project Introduction: City of
Putnam Lake Putnam Lake Park District Town of Patterson Putnam County
 Putnam Lake Putnam Lake Park District Town of Patterson Putnam County Lake Characteristics Watershed Characteristics Surface area (ac/ha) 226 / 92 Max depth (ft/m) 18 / 5 Mean depth (ft/m) 11 / 3 Retention
Lakewater Chemistry at Acadia National Park, Maine, in Response to Declining Acidic Deposition
 occurred since 1996. One of the intended effects of the CAAA reductions was to decrease the acidity of lowalkalinity waters and thereby improve their biological condition. The key science and policy questions
Technical Document EPA s Draft Report on the Environment Chapter 1 - Cleaner Air 1.2 Acid Deposition 1-25
 Technical Document EPA s Draft Report on the Environment 3 1. Acid Deposition Sulfur dioxide and NO X emissions in the atmosphere react with water, oxygen, and oxidants to form acidic components, also
Continuing Acidification of Organic Soils Across the Northeastern U.S. between 1984 and 2001: Fact or Fiction. Richard A. F. Warby (Ph.D.
 Continuing Acidification of Organic Soils Across the Northeastern U.S. between 1984 and 2001: Fact or Fiction Richard A. F. Warby (Ph.D.) Soils: Acid Deposition Effects on: Soil sulfur and nitrogen enrichment
LIMNOLOGY. Inland Water Ecosystems. JACOB KALFF McGill University. Prentice Hall. Upper Saddle River, New Jersey 07458
 LIMNOLOGY Inland Water Ecosystems JACOB KALFF McGill University Prentice Hall Prentice Hall Upper Saddle River, New Jersey 07458 Contents CHAPTER 1 Inland Waters and Their Catchments: An Introduction and
Elsinore Valley Municipal Water District. Lake Elsinore Phase 2 Water Quality Monitoring Plan
 Elsinore Valley Municipal Water District Lake Elsinore Phase 2 Water Quality Monitoring Plan to Evaluate the Efficacy of the In-Lake Nutrient Reduction Facilities (Aeration and Mixing) for Lake Elsinore
Bathing Water Quality Monitoring Programme
 Bathing Water Quality Monitoring Programme 2005 Report on monitoring of physico-chemical parameters Malta Environment and Planning Authority April 2006 Executive Summary As a Member State of the European
OKLAHOMA CLEAN LAKES AND WATERSHEDS 23rd ANNUAL CONFERENCE AGENDA. SUCCESS STORY: 20 YEARS of HYPOLIMNETIC OXYGENATION of a RESERVOIR
 OKLAHOMA CLEAN LAKES AND WATERSHEDS 23rd ANNUAL CONFERENCE AGENDA SUCCESS STORY: 20 YEARS of HYPOLIMNETIC OXYGENATION of a RESERVOIR Agenda EBMUD & Camanche Reservoir Water Quality Challenges Speece Cone
Lake Oscaleta Three Lakes Council Town of South Salem Westchester County
 Lake Oscaleta Three Lakes Council Town of South Salem Westchester County Lake Characteristics Watershed Characteristics Surface area (ac/ha) 8 / 23 Max depth (ft/m) 38 / 12 Mean depth (ft/m) 22 / 7 Retention
The Snapshot CONODOGUINET CREEK WATERSHED SNAPSHOT
 CONODOGUINET CREEK WATERSHED SNAPSHOT ABOVE: CONODOGUINET CREEK AT RT 74 BRIDGE FACING DOWNSTREAM The Snapshot The Conodoguinet Watershed Snapshot was a collaborative effort to engage local citizens in
Isotope Hydrology Investigation of the Pawcatuck Watershed. Principle Investigators. Anne I. Veeger
 Isotope Hydrology Investigation of the Pawcatuck Watershed Principle Investigators Anne I. Veeger Introduction There are three new research projects for the FY1999 annual research program for the Water
Investigation of the Impact of Forrest Fires on the Chemistry and Water Quality of Ground Water in Yellowstone National Park
 University of Wyoming National Park Service Research Center Annual Report Volume 13 13th Annual Report, 1989 Article 38 1-1-1989 Investigation of the Impact of Forrest Fires on the Chemistry and Water
ADDENDUM 2 (2013) TO WORK PLAN FOR PILOT TEST TO ADD NITRATE TO THE HYPOLIMNION OF ONONDAGA LAKE
 TO WORK PLAN FOR PILOT TEST TO ADD NITRATE TO THE HYPOLIMNION OF ONONDAGA LAKE") NITRATE TO THE HYPOLIMNION OF Prepared for: 301 Plainfield Road, Suite 330 Syracuse, NY 13212 Prepared by: 301 Plainfield Road, Suite 350 Syracuse, New York 13212 JUNE 2013 TABLE OF CONTENTS LIST OF ACRONYMS...
NITRATE TO THE HYPOLIMNION OF Prepared for: 301 Plainfield Road, Suite 330 Syracuse, NY 13212 Prepared by: 301 Plainfield Road, Suite 350 Syracuse, New York 13212 JUNE 2013 TABLE OF CONTENTS LIST OF ACRONYMS...
2012 Nutrient Regulations Update
 2012 Nutrient Regulations Update OWEA Government Affairs Workshop March 1, 2012 Guy Jamesson, PE, BCEE Malcolm Pirnie, The Water Division of ARCADIS Imagine the result Agenda Nutrient impacts Nutrient
Owasco Lake Day
 Introductions Halfman apologizes for not presenting this talk himself. A family reunion took precedent. Owasco Lake Day 6-25--14 1 The beginnings Preliminary water quality comparison of the Finger Lakes
ÆÕ 65. Sullivan Lake Monitoring Report Æÿ Monitoring Sites. MWMO Watershed Bulletin: Lake Levels Lake Water Quality
 Sullivan Lake Monitoring Report 2013 "S Mississippi River æº 2013 Monitoring Sites æº Lake Levels Lake Water Quality ÆÕ 65 Sullivan Lake æº Æÿ65 MWMO Watershed Bulletin: 2014-4 ÆÕ 65 Sullivan Lake Monitoring
Status and Trends of Water Quality in Wisconsin s Lakes, Streams, and Rivers
 Status and Trends of Water Quality in Wisconsin s Lakes, Streams, and Rivers Tim Asplund, Matt Diebel, Katie Hein, and Mike Shupryt Water Resources Program, WDNR AWRA Wisconsin Section Annual Meeting March
Chapter Seven: Factors Affecting the Impact of Nutrient Enrichment on the Lower Estuary
 Chapter Seven: Factors Affecting the Impact of Nutrient Enrichment on the Lower Estuary As presented in Chapter Six, the water quality data for the upper stations of the tidal freshwater Potomac Estuary
EXECUTIVE SUMMARY LEGISLATIVE REPORT 2011
 EXECUTIVE SUMMARY LEGISLATIVE REPORT 2011 January, 2012 2011 RiverNet Program RIVERNET: Continuous Monitoring of Water Quality in the Neuse River Basin Dr. William J. Showers Dept. of Marine, Earth & Atmospheric
Primer on Pond & Lake Ecology & Watershed Dynamics
 Primer on Pond & Lake Ecology & Watershed Dynamics The water quality of a lake is often described as a reflection of its surrounding watershed. The term lake collectively refers to reservoirs (man-made
Jordan River TMDL Update
 Jordan River TMDL Update 2010 Watershed Symposium August 4 th, 2010 Hilary N. Arens Utah Division of Water Quality Jordan River TMDL Outline What is a TMDL and what is the Jordan impaired for? Evaluation
Ecosystem Consulting Service, Inc. July 15, P a g e
 Prepared for: Normanoch Association Prepared by: Robert W. Kortmann, Ph.D. Ecosystem Consulting Service, Inc. July 17, 2014 Culver Lake Status 2014 (a brief mid-summer report) Cold water fish need water
2017 Data Report for Lake Independence, Marquette County
 Michigan Lakes Ours to Protect 217 Data Report for Lake Independence, Marquette County Site ID: 2149 46.88337 N, 87.711393 W The CLMP is brought to you by: 1 About this report: This report is a summary
Effects of Acid Rain on Sensitive Forest and Freshwater Ecosystems: Is the Problem Solved? By Charles Driscoll Syracuse University
 Effects of Acid Rain on Sensitive Forest and Freshwater Ecosystems: Is the Problem Solved? By Charles Driscoll Syracuse University Acid rain sources and background Effects of acidic deposition on forest
Real-Time Water Quality Deployment Report
 Real-Time Water Quality Deployment Report Rattling Brook Network February 19, 2016 to March 23, 206 Government of Newfoundland & Labrador Department of Environment and Conservation Water Resources Management
2017 Data Report for Rogers Pond, Mecosta County
 Michigan Lakes Ours to Protect 2017 Data Report for 43.6175478 N, 85.4718313 W The CLMP is brought to you by: 1 About this report: This report is a summary of the data that have been collected through
Limnology 101. PA AWWA SE District & Eastern Section WWOAP Joint Technical Conference October 13, 2016
 Limnology 1 PA AWWA SE District & Eastern Section WWOAP Joint Technical Conference October, 2 Kristen Bowman Kavanagh, P.E. Flow Science Incorporated Limnology is the study of the biological, chemical,
Nathan Whalen, Water Resources Specialist, Portland Water District February, 2010
 Characterization of Sebago Lake Lower Bay Trophic State Since 1976 A Statistical Calibration of Pre-1990 Secchi Transparency, Total Phosphorous and Chlorophyll a to Post- 1990 Secchi Transparency, Total
Eastman Lake Town of Irondequoit Monroe County
 Eastman Lake Town of Irondequoit Monroe County Lake Characteristics Watershed Characteristics LCI Participation Surface area (ac/ha) 9 / 8 Max depth (ft/m) 9 / Mean depth (ft/m) 4 / Retention time (years)